Deficit-Reduction Package That Lacks Significant Revenues Would Shift Very Substantial Costs to States and Localities
Ryan Budget Cuts to State and Local Services Would Be Far Deeper than Cuts Under Sequestration
If it fails to include significant new revenues, a major legislative package to shrink federal deficits would almost certainly make deep cuts in federal funds that support states and localities as they perform many basic public functions, including educating children, building roads and bridges, protecting public health, and providing law enforcement.
To keep the national debt from growing faster than the economy after the next few years, the deficit must be reduced by about $2 trillion over the next 10 years, in addition to the $1.7 trillion in savings from complying with the spending caps imposed by last summer’s Budget Control Act (BCA). They also agree in broad terms that cuts in Social Security and Medicare that affect current beneficiaries should be limited and that defense spending should not be cut below the BCA spending caps. If the savings from Social Security, Medicare, and defense — which together account for well over half of non-interest federal spending — are limited and the deficit plan does not include significant revenues, federal support for programs operated by state and local governments will stand out as one of the few remaining sources of large potential savings.
The House-passed budget from Budget Committee Chairman Paul Ryan is indicative of the sort of approach Congress likely would take if it rejects a balanced approach to deficit reduction that includes significant revenues:
- The Ryan budget would heavily shift costs to states by cutting Medicaid funding. It would cut federal funding for the federal-state Medicaid program by 34 percent by 2022 (relative to what federal Medicaid funding for states would be under current law), and by steadily larger amounts in years after that. These cuts would be in addition to reductions in federal Medicaid funding for states that would result from the Ryan budget’s call to repeal the health reform law.
- The Ryan budget would impose deep cuts in funding for a wide range of other state and local services, as well. The Ryan budget also would cut non-defense “discretionary” (i.e. non-entitlement) funding by 22 percent in 2014 and later years, on top of the substantial cuts imposed by the BCA spending caps. About one-third of this category of funding goes for grants to state and local governments to support services that states and localities provide, such as education, law enforcement, water treatment facilities, and disaster response.
If funding for these grants to state and local governments is cut by 22 percent, in line with the cut to overall non-defense discretionary funding, states and localities would lose nearly $28 billion in 2014 — on top of the cuts they will absorb as Congress shrinks funding for such grants, along with other discretionary programs, to comply with the BCA caps. States and localities would lose $247 billion over the nine years from 2013 through 2021, in addition to the cuts they would absorb due to the BCA caps, as a result of the deep reductions the Ryan budget would make in funding for non-defense discretionary programs. (These figures do not include additional cuts that the Ryan budget would make in highway, mass transit, and other transportation spending, as explained below.)
In theory, policymakers could spare state and local funding and take all of the required cuts from purely federal areas of non-defense discretionary spending; in reality, there is no chance that would occur, as it would entail extremely deep cuts in funding for veterans health care, biomedical research to find cures and better treatments for various diseases, protecting the borders, the FBI, the Social Security Administration, and the like. Indeed, federal policymakers likely would cut state and local aid by more than 22 percent in order to protect funding for federal activities such as these. - Cuts in funding for state and local governments under the Ryan plan would be much deeper than the automatic cuts (or “sequestration”) scheduled to begin in January. The BCA not only established caps that will require cuts in funding for defense and non-defense discretionary programs over the next nine years, but also established a mechanism that would require additional cuts — through a process called “sequestration” — in defense and non-defense discretionary funding (and cuts in some mandatory programs) if a “Supercommittee” did not recommend, and Congress and the President did not enact, a deficit reduction package that saved at least $1.2 trillion over 10 years. Since such a package was not enacted, sequestration is scheduled to take effect automatically starting in January 2013. But the cuts to non-defense discretionary funding under the Ryan budget would be three times as deep in 2014 as the cuts from sequestration. In later years, the difference would be even larger.
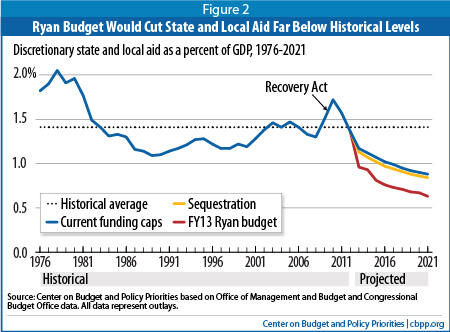
- The Ryan budget cuts likely would bring funding for state and local services far below historical levels. By 2021, the Ryan budget would reduce discretionary state and local grants to an estimated 0.6 percent of GDP, less than half the average of the last 35 years.
Cuts of such magnitude would force states and localities to reduce the quality and reach of their basic public systems — their schools, clean water facilities, and law enforcement activities, for example — or raise new revenue or cut other programs to continue meeting these needs. Either way, the result would be a huge cost shift from the federal government to states and localities. By contrast, if Congress adopts a balanced deficit-reduction plan that includes significant new revenues, the resulting cost shift to states and localities almost certainly would be far smaller.
Without Revenues, Aid to States and Localities Likely Will Face Massive Cuts
About $2 trillion in deficit reduction is required over the coming decade (on top of the $1.7 trillion in deficit reduction due to cuts to discretionary spending already required under the Budget Control Act) to stop the debt from growing faster than the economy.[1] This step is necessary because debt that persistently rises relative to the size of the economy is unsustainable and ultimately may pose threats to the nation’s financial stability and longer-term growth.
Moreover, leaders of both parties, including President Obama, have signaled they believe it is appropriate to avoid major cuts in Social Security and Medicare benefits for current beneficiaries or those near retirement, meaning that any large savings from those programs would not occur until subsequent decades.[2] In addition, policymakers are unlikely to cut defense spending much if at all below the BCA cap levels. The strong opposition voiced to the cuts in defense that would occur if the pending sequestration takes effect, and the fact that many policymakers are calling for increases above the BCA cap levels, show how unlikely such cuts are.
As such, there are only two major parts of the federal budget left from which the bulk of the savings in any plan that does not include significant new revenue would have to come:
- Non-defense discretionary programs, that is, programs subject to annual appropriations. Funding for services administered by states and localities such as transportation, K-12 education, water treatment, and various health care services (as distinguished from Medicaid) accounts for about one-third of federal non-defense discretionary spending. Many of the remaining non-defense discretionary programs support core federal functions, such as funding for the National Institutes for Health, the Federal Bureau of Investigation, national parks, food safety, and border protection.
- Entitlements other than Social Security and Medicare. About two thirds of the spending in this category is for programs that reduce poverty and promote opportunity, such as Medicaid, SNAP (formerly known as food stamps), assistance for disabled veterans, and a range of other programs that are targeted to low-income people
Achieving $2 trillion in deficit reduction over the next decade primarily from non-defense discretionary programs and entitlement programs other than Social Security and Medicare likely would require very large cuts in discretionary grants to state and local governments, as well as in Medicaid. Thus, without substantial revenues, state and local governments are likely to be hit hard by federal actions in the fiscal policy arena. Much is riding for states upon whether federal policymakers achieve deficit reduction in a balanced manner.
States Already Are Hurting; More Cuts Would Further Slow Economic Recovery
The Ryan budget’s deep cuts in funding to states and local governments to carry out various functions would come at a time when states and localities already are hobbled by the recession and sluggish recovery. Further cuts would make it even harder for states and localities to repair the budgetary damage carried by the recession and would assure that state and local cuts continue to be a drag on the national economy’s recovery.
The Great Recession that started in 2007 caused the largest collapse in state revenues on record. Since bottoming out in 2010, revenues have begun to grow again but are still far from fully recovered. As of the first quarter of 2012, state revenues remained 5.5 percent below pre-recession levels adjusted for inflation, and are not growing fast enough to recover fully any time soon.
Meanwhile, states’ education and health care obligations continue to grow. States expect to educate 540,000 more K-12 students and 2.5 million more public college and university students in the upcoming school year than in 2007-08.a In addition, 4.8 million more people are projected to be eligible for subsidized health insurance through Medicaid in 2012 than were enrolled in 2008, as some employers have dropped their coverage and people have lost jobs and wages.b
States have been forced to close enormous budget shortfalls totaling nearly $600 billion since the 2009 fiscal year.c The actions that states have taken to close these budget gaps, primarily spending cuts, have imposed a significant drag on the economic recovery. Since the recession took hold in August 2008, state and local governments have shed 675,000 jobs.
Deep additional federal cuts in funding to state and local governments would cause further damage to states’ and localities’ budgets, reducing the number of jobs that states and localities produce as the national economy recovers and holding back the country’s efforts to recover more fully and expeditiously from the recession.
a U.S. Department of Education, “Condition of Education 2012,” , tables A-3-1, A-10-1, and A-11-1 (endnote 1), http://nces.ed.gov/pubsearch/pubsinfo.asp?pubid=2012045.
b CBPP calculations based on data from the Congressional Budget Office and Centers for Medicare and Medicaid Services. (endnote 2).
c Phil Oliff, Chris Mai, and Vincent Palacios, “States Continue to Feel Recession’s Impact,” Center on Budget and Policy Priorities, updated June 27, 2012, https://www.cbpp.org/cms/index.cfm?fa=view&id=711.
The Ryan Budget Illustrates Threat to States and Localities of a Cuts-Only Approach
The budget proposed earlier this year by House Budget Committee Chairman Paul Ryan, and passed by the House, illustrates the likely impact on states if federal policymakers do not take a balanced approach to deficit reduction. Major bipartisan deficit reduction proposals, such as the proposal put forward by a majority of the members of the Bowles-Simpson commission and the proposal issued by a Bipartisan Policy Center task force headed by Alice Rivlin and former Senator Pete Domenici, would raise taxes substantially as well as cutting spending in order to shrink the federal deficit. The Ryan budget, by contrast, includes no new revenues.
At the same time, the Ryan budget would impose massive federal spending cuts totaling a whopping $5.3 trillion (not including interest savings) over the next ten years. Most of Ryan’s budget cuts would come from repealing the Affordable Care Act (ACA), cutting non-defense discretionary programs deeply, and cutting Medicaid and other programs that reduce poverty and inequality.[3]
The Ryan plan would cut non-defense discretionary programs nearly $1.2 trillion below the already tough annual budget caps imposed on these programs by the Budget Control Act. Under the Ryan budget, funding for these programs would be cut by an additional 22 percent in 2014 and later years beyond the cuts already needed to comply with the BCA caps.
If grants to state and local governments were cut by the same 22 percent that non-defense discretionary funding as a whole would be reduced, then states and localities would lose nearly $28 billion in 2014 alone. Over the nine years through 2021, states and localities would absorb a cumulative federal funding cut of $247 billion. (These figures exclude additional cuts to federal funding for road-building and other transportation projects that require a different methodology to calculate; see the appendix for state-by-state estimates.)
In principle, the appropriations process could spare funds for states and localities while taking most or all of the required cuts from purely federal areas of non-defense discretionary spending. A more likely scenario, however, is that programs providing funding to state and localities would receive at least their proportionate share of these cuts, and perhaps more. If Congress chooses largely to protect funding for federal functions such as the FBI, border enforcement, medical research, veterans health care, and food safety (all of which are part of non-defense discretionary funding), then federal funding for programs administered at the state and local level would face cuts significantly deeper than 22 percent.
In addition to imposing deep cuts to non-defense discretionary programs, the Ryan budget also imposes a number of other severe cuts, including some with major implications for state budgets. These include cutting federal Medicaid funding by 34 percent by 2022 (on top of repealing the Affordable Care Act’s Medicaid expansion) and by still larger amounts in subsequent decades. As the Congressional Budget Office explains, the magnitude of the Medicaid and Children’s Health Insurance Program cuts in the Ryan budget “means that states would need to increase their spending on these programs, make considerable cutbacks in them, or both.”[4]
Ryan Budget Cuts Much Deeper Than Sequestration
The Budget Control Act (BCA) established annual funding caps that will necessitate significant reductions in both non-defense and defense discretionary spending. The BCA also requires a further round of cuts known as “sequestration,” starting in January 2013.[5] Much attention has been paid to the effects of sequestration, but the Ryan budget would impose cuts far deeper than those scheduled under sequestration, other than in defense funding.
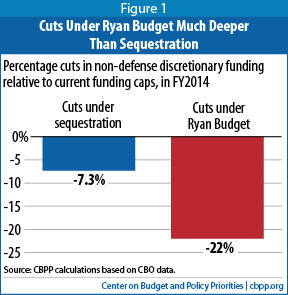
Those cuts are substantial, but the Ryan budget would cut non-defense discretionary programs much more deeply — by about 22 percent below the BCA caps, starting in 2014 — and would not diminish over the next decade.
That is, in 2014 the overall cuts in funding for non-defense discretionary programs under the Ryan budget would be three times as deep as the cuts scheduled under sequestration. In later years the difference is even larger. States and localities are justifiably worried about sequestration’s major federal funding cuts; but if federal policymakers enact a deficit reduction plan that relies entirely or almost entirely on spending cuts, the damage to state and local aid likely will be much more severe.
Ryan Budget Would Cut Discretionary Aid Far Below Historical Levels
The Ryan budget likely would cut discretionary spending so heavily that this funding would fall far below historical levels over the coming decade.
Even the current caps on discretionary spending under the Budget Control Act (BCA) would cut federal discretionary funding for states and localities significantly as a share of the economy. Assuming the cuts to state and local aid are proportional to the cuts in non-defense discretionary funding overall, they would bring federal funding to states and local governments through discretionary programs to the lowest levels in four decades, measured as a share of the economy — even without sequestration.
Deep Cuts to Discretionary Funding Would Shift Costs to States and Localities
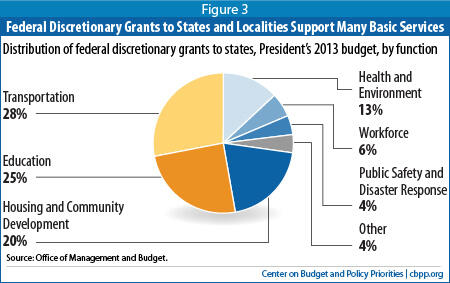
Federal discretionary grants to states and localities finance a number of national priorities. More than a quarter of federal discretionary grant funding for states and localities supports transportation projects — mainly road and bridge construction, planning, and repair. Another quarter goes to education. Thus, more than half of federal discretionary grants to states help pay for education or transportation projects — two functions of state and local governments that are basic building blocks of the future economy.
The remainder of federal discretionary grant funding helps states and localities undertake a wide range of other important functions, including protecting waterways from sewage contamination, protecting public safety, reducing homelessness, revitalizing run-down neighborhoods, providing technical job skills training to community college students and others, and responding after disasters.
To be sure, states and localities bear a heavy responsibility themselves to finance these areas of spending, and even after years of state and local budget cuts, state and local taxes still provide the lion’s share of the funding for most of these services. But state and local tax revenue remains depressed by the recession and is unlikely to recover soon, much less to grow anywhere near fast enough to make up for substantial new federal cutbacks.
Transportation
Over a quarter (28 percent) of federal discretionary grants to states helps build and improve roads and other transportation systems. These projects are crucial to the nation’s economic health, since businesses require efficient transportation systems to get their products to market in a timely way, and workers use these systems to commute to their jobs. Cutting federal support for these projects would shift costs to states and localities, which would have to choose between raising more revenue in-state or reducing their future transportation investments and absorbing the indirect cost to their economies and quality of life.
- Road and bridge planning, construction, and rehabilitation. Some 73 percent of federal aid for state transportation programs goes to help states plan, build, and make major repairs to their roads and bridges. These programs help assure that the National Highway System, which carries about 85 percent of the vehicle miles driven nationally each year, continues to efficiently transport goods and people as the economy grows over time.[6]
- Public transit. Federal grants for public transit have provided an average of $8 billion a year over the last decade to help plan, upgrade, and (in small urban areas) operate bus and rail transit systems and other forms of public transportation. Other programs help people who have disabilities or are elderly to access public transit, promote job access for low-income commuters, and develop pathways for cyclists and pedestrians.
Ryan Budget Would Impose Additional Cuts to Transportation Aid
The Ryan budget would impose substantial cuts to highways and other transportation aid for states and localities. These cuts would come on top of the large cuts to other forms of state and local funding discussed in this paper.
Unlike other discretionary grant funding, funding for state and local transportation projects such as building highways and new airport runways is not affected by the spending caps imposed last year under the Budget Control Act (this funding is outside the caps), and is exempt from sequestration. As such, estimating how much states and localities would lose in transportation funding requires a different methodology than other forms of discretionary funds for which the BCA spending caps provide an appropriate baseline.
In 2014, the Ryan budget would reduce discretionary aid to states and localities for transportation projects by about 20 percent — about $12 billion — relative to 2012 levels adjusted for inflation.a Over the next nine years, the Ryan budget would require about $194 billion in cumulative cuts to state and local transportation aid, relative to current levels adjusted for inflation.
These cuts would come on top of the Ryan budget’s cuts to other forms of discretionary spending, which total $247 billion through 2021, relative to the current BCA spending caps.
a See methodological appendix for a description of how these estimates were developed. .
- Airports. In 2011, these funds financed over 2,000 projects at airports around the country to improve runways and to accommodate growth in flights, passengers, and the size of aircraft. [7]
Education
Another quarter of the value of federal discretionary grants goes to help states educate children. These funds mostly end up with elementary and high schools, primarily to help them educate children from low-income families and children with learning disorders and other types of disabilities. The funds also go to agencies that provide preschool education to low-income children through the Head Start program, and to school districts to help them train better teachers and reduce class sizes.
If these federal grants are reduced sharply, as they would be under the Ryan budget, states and local governments will be forced to choose between increasing their own spending to protect their schools or allowing their schools to take the financial hit, which could damage the quality of their education systems.
Cutting this funding would hurt high-poverty schools the most, since the federal aid is targeted disproportionately to those schools. That could undermine education reform efforts in many states and deepen already disturbing inequities in the educations received by children from families of varying income levels. Heavy cuts to Head Start would deepen these problems further by allowing many thousands of low-income children nationally to start kindergarten less prepared than they otherwise would be.
The cuts likely also would cause school districts to lay off more teachers and other education workers, weakening the economy’s sluggish recovery. (School districts have already cut 305,000 teaching and other education jobs since August 2008, even as school enrollment has continued to grow.) And by diminishing the quality of the education received by many of the nation’s children, deep cuts to education funding — on top of those already imposed by states since the recession hit — could also adversely affect the nation’s long-term economic prospects since children who receive an inadequate education are less likely to become highly productive adults.
Indeed, most school administrators report that, in planning for the federal spending reductions that would be imposed under sequestration, they already are planning cuts that would affect the educational experiences of children. In a June 2012 survey, a majority of administrators reported that sequestration cuts would mean “reducing professional development (69.4 percent), reducing academic programs (58.1 percent), eliminating personnel (56.6 percent) and increasing class size (54.9 percent).”[8] Under the Ryan budget’s much deeper cuts, even more schools likely would be forced to reduce the quality of the education they offer.
Major education programs threatened with deep cuts under the Ryan budget include:
- High-poverty schools (Title I). Title I provides financial assistance to schools with high numbers or percentages of children from low-income families, to help these children meet state academic standards. Some 56,000 schools nationally received this funding in 2009, helping them educate 21 million children that year.[9]
- Special education (IDEA). Funding through the Individuals with Disabilities Education Act provides federal support to schools to help them educate children with learning disorders, speech impairments, and other disabilities. Some 6.5 million children nationally received specialized learning assistance through this funding in 2010.[10]
- Pre-school programs provided through Head Start. Head Start promotes school readiness among at-risk children up to age 5 by enhancing social and cognitive development through education, health, nutritional, and other services and by engaging families in children’s learning. Early Head Start serves children from birth to age 3 and some pregnant women. Together, these programs served 904,000 children nationally in 2009.[11]
- Improving teacher quality. The U.S. Department of Education provides grants to states and school districts to improve the quality of teaching in their schools. School districts with the highest poverty levels receive a disproportionately large share of the funds. Most of the grant money is spent on training programs to help teachers be more effective and to reduce class sizes (by employing more teachers). School districts used this funding to pay the salaries of over 14,000 teachers nationally to reduce class sizes in the 2011-12 school year.[12]
- Impact Aid. These funds provide support to school districts near military bases, Indian lands, or other types of property that cannot be taxed by the school district. In 2008, over 900,000 students attended schools that received this aid. Nearly 40 percent of them were children from military families.[13]
Housing and Community Development
Another 20 percent of discretionary grant funding to states and local entities goes to housing and community development programs. Most of this funding is used to help low-income renters find housing they can afford. The biggest program in this category, known as “Section 8,” is really two programs, one of which provides low-income renters with vouchers they can use to help them afford the rent on modest apartments, and the second of which directly funds private property owners to offer units to low-income people at affordable rental charges. The category also includes funding for energy assistance payments that help low-income people pay their heating and cooling bills; community development programs that — among other things —revitalize blighted neighborhoods and build public infrastructure such as sewer systems and recreation centers; and public housing.
Large cuts to the funding for these programs would shift substantial costs to states and localities. Such cuts would make housing and utility bills significantly less affordable to a large number of low-income people, likely increasing the number of homeless people. This would increase the need for shelter space, which is significantly more expensive per unit than rent subsidies. Since community development funds are often used to revitalize run-down areas, cutting them sharply could cause some property values to slip and blight to increase, especially in lower-income neighborhoods and other areas nearby. Lower property values also would diminish the revenue available for local governments to fund schools and other fundamental local public services. Increased blight could also increase other costs for cities and other localities, for example by adding to demands on building inspectors, housing agencies, and police departments.
The major housing and community development programs threatened with large cuts under the Ryan budget include:
- Rental assistance for low-income people. The Housing Choice Voucher program, the principal component of “Section 8” provides vouchers that nearly 2.2 million low-income families use to defray part of the rent on a modest apartment or other home in the private retail market. Roughly half of the low-income households benefiting are headed by seniors or people with disabilities; most of the rest are families with children.
The other “Section 8” program, the Project-Based Rental Assistance (PBRA) program, provides rental assistance payments to private owners of 1.2 million units of affordable housing. Two-thirds of the residents of these housing units are low-income seniors or people with disabilities.[14] - Assistance for paying heating or cooling bills (through the Low Income Home Energy Assistance Program, or LIHEAP). Many low-income people receive help paying their home energy bills through this program. In 2008, 6.9 million people nationally received this assistance.[15]
- Community Development Block Grants. States, cities, and counties use this funding to revitalize deteriorating neighborhoods, improve water and sewer systems, and build community centers, youth centers and libraries, and a range of other public infrastructure projects.[16]
- Public Housing.Public housing provides affordable homes to 1.1 million of the nation’s poorest residents. More than half of these households are headed by seniors or people with disabilities.[17]
Health and Environment
Some 13 percent of discretionary aid to states and localities funds states to provide nutrition to low-income newborns and expecting mothers, protect waterways from sewage contamination, prevent and treat addictions, provide health care to people with limited access to it, and do a range of other things that protect the public’s health or the environment.
Deep cuts to this funding would force states and localities to choose between using more of their own funds to sustain these efforts and allowing the programs to diminish. If states and localities replaced the lost funds with their own revenues, the cost shift would be direct.
Providing fewer new low-income mothers and their very young children with nutritional food could lead to more children with health problems, which would increase state Medicaid costs, among other near-term impacts, and could affect the state’s long-term economic potential by reducing the productivity of the future workforce. Similarly, completing fewer clean water projects could lead to public health problems deriving from contaminated rivers and lakes and diminish the value of those waterways for recreational purposes, reducing the local quality of life and the area’s attractiveness to tourists and investors. Providing help to fewer people with mental illnesses or addictions could mean police officers will confront more people with untreated mental health or addiction problems, adding to their costs, among other indirect costs to states and localities.
- Nutrition support for new and expecting mothers, and for their young children (WIC). The Special Supplemental Nutrition Program for Women, Infants, and Children provides nutritious food and nutritional education (including breastfeeding education and support) to new and expecting low-income mothers, including those with children under age 5. In an average month in 2010, the program — delivered by thousands of agencies and health clinics across the country — served over 2 million low-income women and 7 million infants and children.[18]
- Clean Water State Revolving Fund. Every state operates a revolving loan program — paid for mostly with federal money — that funds wastewater treatment projects, sewer projects, and other infrastructure that protects and restores the health of rivers, lakes, and estuaries. In 2009, these funds allowed for agreements to support nearly 2,000 clean water projects and over $5 billion in loans.[19]
- Mental health and substance abuse services. These grants help states prevent and treat alcohol and drug abuse and provide community mental health services to adults and children with serious mental illness. In 2008, over two million individuals attended substance abuse facilities that received federal funding; over six million received federally supported mental health services.[20]
- Community Health Centers. These non-profit facilities provide primary-care medical services to people with limited access to health care. In 2010, more than 8,000 centers nationally provided medical care to over 19 million patients, many of them poor.[21]
Workforce
Another 6 percent of federal discretionary funding provided to states and localities goes to help state and local governments train, protect, and build stronger workforces. People who are unemployed often need training and help finding new employment. Low-income people often need help affording child care so they can go to work. High school and community college students often benefit from classes that teach job skills. And people who lack basic reading and language skills often need basic education classes to help them find employment and succeed on the job. These sorts of human capital investment can improve the quality of the state and local workforce, helping employers find productive workers and boosting the economy. Sharp reductions in the federal funds that help pay for these programs would shift costs to states and localities, forcing them to either pick up the costs themselves or absorb the damage to the quality of their workforce if the cuts take effect.
- Training and Employment Services.State and local governments receive these grantsto provide job search and placement assistance, occupational training, and career counseling to unemployed adult workers and to low-income youth who need help building their skills.[22]
- Child care subsidies for low-income working parents. These funds subsidize child care for low-income parents so they can find and keep a job. In 2010, the subsidies helped 1 million parents find child care.[23]
- Adult and vocational education. Adult education classes help people get the basic skills they need to be productive as workers (and in their families and communities); for example, these classes may help people learn to read, do basic math, get a GED, or speak English. In 2009, 2.4 million people participated in classes to learn these sorts of basic skills.[24] Vocational education funds pay for technical and vocational education for high school and community college students, giving them skills they can carry into the workforce.
- Unemployment Insurance administration. These funds help finance the administration of state unemployment insurance programs.
Public Safety and Disaster Response
States and local areas hit by natural disasters such as hurricanes, earthquakes, floods, wildfires, and tornadoes often seek help from the federal government. In the immediate aftermath of a disaster, at a governor’s request, the Federal Emergency Management Agency (FEMA) helps people affected by the disaster get food, water, and shelter, and can help with search-and-rescue missions and providing electric power. FEMA also helps states and local governments repair or replace public facilities and infrastructure, which often is not insured. This form of discretionary federal aid would be subject to cuts under the Ryan budget. If it were scaled back substantially, states and localities would need to bear a larger share of the costs of disaster response and recovery, or attempt to make do with less during difficult times.
Federal discretionary funds also help states, cities, and other local governments hire police officers. Big cuts in funds to hire police officers would shift more of the cost of hiring these officers to state and local budgets.
- Disaster relief.Last year, the President declared 99 major disasters, which enables federal disaster assistance to be provided for states, localities, and affected individuals.[25]
- Justice Assistance Grants (JAG). Most of these grants go to help local law enforcement agencies train police officers, supply them with police cars, bullet proof vests, and other equipment, cover overtime, and deter crime. The rest helps states and localities operate other aspects of their criminal justice systems, including prosecuting criminals, taking other actions to reduce crime, and protecting victims and witnesses.[26]
- Funds to hire state & local police officers (COPS). These funds help state and local law enforcement agencies hire police officers. In 2011, these grants helped to fund or maintain over 1,000 law enforcement positions nationally.[27]
Methodological Appendix
Concepts: Our approach requires us to examine both budget authority and outlays for non-defense discretionary grants to states and localities. For discretionary programs, budget authority refers to the funding level determined by the annual appropriations process. Outlays refer to the actual spending that results from budget authority. Because budget authority provided in a single year may be spent over several subsequent years, changes in outlays tend to lag behind changes in budget authority. Generally, budget authority is the best benchmark for comparison between different discretionary funding proposals because of the lag that occurs with outlays.
Funding for transportation grants, however, is not counted as discretionary budget authority. Therefore, we evaluate the impact of the Ryan budget on outlays for discretionary transportation grants and on budget authority for all other non-defense discretionary grants. Since, as explained below, sequestration does not apply to transportation grants, we only look at the impact of sequestration on other non-defense discretionary grants.
Baseline Assumptions: To determine how sequestration or the Ryan budget would affect grants to states and localities, we need to construct a baseline from which to measure those cuts. We began this analysis with a set of baseline assumptions to project how much funding will be allocated to federal grants to states and localities from 2013-2021 under current policies. We assume that under current policy, lawmakers will adhere to the annual caps on aggregate non-defense discretionary budget authority set in the Budget Control Act of 2011 (BCA). (The BCA also established caps on defense discretionary funding, but only an occasional, miniscule amount of defense funding is distributed in the form of grants to state and local governments. This report does not address those grants.) These non-defense caps (and the defense caps) decline slightly in nominal terms from 2012 to 2013, and grow slightly slower than inflation from 2013 through 2021.
In constructing our baseline, we assume that funding for discretionary grants to states and localities other than transportation grants will grow at the rate of growth of the BCA caps on aggregate non-defense discretionary budget authority from 2012 through 2021, using the enacted level of funding for 2012 as our base. That is, we assume that such grants will represent the same share of total non-defense discretionary funding in 2013 through 2021 as they do in 2012.
Transportation grants are not subject to the caps on non-defense discretionary budget authority because the funding for transportation grants is not counted as discretionary budget authority. The expenditures that eventually flow from the funding are, however, classified as discretionary outlays. Our baseline for those outlays is the same as the Congressional Budget Office’s baseline projection of spending for those programs under current policies, which assumes the current (2012) level of available funding will grow with inflation.
Methods: We estimated the cuts in grants to state and local governments due to sequestration and the Ryan budget by, in each case, applying in each year a percentage cut applicable to discretionary transportation grants and a percentage cut applicable to all other non-defense discretionary grants. We assume these percentage cuts apply across-the-board to all transportation grants and across-the-board to all other non-defense grants, respectively. And we assume that the percentage cuts to grants within the transportation category or within the other non-defense category would be the same as the percentage cut (if any — as noted, sequestration does not apply to programs funded through the transportation trust funds) required in the overall level of funding for each such budget category by sequestration or by the Ryan budget.
The cuts in funding for non-defense discretionary programs other than transportation required by the BCA sequestration are based on the requirements of that law and our estimates of its impacts, which are detailed in a Center analysis issued earlier this year.
The Ryan budget would cut both transportation discretionary grants and other non-defense discretionary grants. For non-transportation grants, we assume they would be cut in proportion to Ryan’s total cuts to non-defense discretionary funding, which is about 22 percent below current policy (the BCA caps) in 2014 and later years. We assume transportation grants to state and localities would be cut in proportion to Ryan’s total cuts to discretionary transportation outlays. We determine Ryan’s cuts to discretionary transportation outlays by taking the Ryan budget’s total cuts in discretionary outlays in the transportation budget function, plus a proportional share of the plan’s proposed cuts in discretionary outlays that were not attributed to any budget function. (The Ryan budget contains cuts of over $600 billion in non-defense discretionary funding and outlays that are left unspecified — that is, that are not attributed to any programmatic budget function. To reflect the impact of the Ryan proposal on various programs, we distribute these cuts proportionally among all of the non-defense discretionary budget functions, including transportation.)
We estimated a state-by-state distribution of the cuts in non-transportation discretionary grants under the Ryan budget based on the distribution of such grants in recent years. (We excluded cuts to transportation funding from these state-by-state estimates because we estimated the size of the cuts relative to the BCA spending caps, and transportation is exempted from these caps, as explained above.) We used the Census’ Federal Aid to States to determine each state’s average share
of non-defense, non-transportation discretionary grants for 2006-2010, excluding grants for 2009 due to the unusual impact of the American Reinvestment and Recovery Act on funding for that year.
| Table 1: Ryan Budget Would Cause Deep Cuts in Discretionary State and Local Aid in 2014 | ||
| Total Discretionary Grants to States & Localities in 2014 Under Current Funding Caps* (in millions) | Estimated Cuts of 22 Percent to These Grants in 2014 Under Ryan Budget (in millions) | |
| United States | $ 125,252 | -$27,606 |
| Alabama | 1,783 | -393 |
| Alaska | 803 | -177 |
| Arizona | 2,069 | -456 |
| Arkansas | 1,056 | -233 |
| California | 13,515 | -2,979 |
| Colorado | 1,660 | -366 |
| Connecticut | 1,572 | -347 |
| Delaware | 393 | -87 |
| District of Columbia | 2,786 | -614 |
| Florida | 5,918 | -1,304 |
| Georgia | 2,553 | -563 |
| Hawaii | 640 | -141 |
| Idaho | 585 | -129 |
| Illinois | 5,169 | -1,139 |
| Indiana | 1,855 | -409 |
| Iowa | 1,074 | -237 |
| Kansas | 1,024 | -226 |
| Kentucky | 1,495 | -330 |
| Louisiana | 4,615 | -1,017 |
| Maine | 681 | -150 |
| Maryland | 2,331 | -514 |
| Massachusetts | 3,251 | -716 |
| Michigan | 3,782 | -834 |
| Minnesota | 1,907 | -420 |
| Mississippi | 2,626 | -579 |
| Missouri | 1,735 | -382 |
| Montana | 646 | -142 |
| Nebraska | 688 | -152 |
| Nevada | 894 | -197 |
| New Hampshire | 574 | -127 |
| New Jersey | 3,435 | -757 |
| New Mexico | 1,033 | -228 |
| New York | 10,761 | -2,372 |
| North Carolina | 2,879 | -635 |
| North Dakota | 500 | -110 |
| Ohio | 3,413 | -752 |
| Oklahoma | 1,566 | -345 |
| Oregon | 1,516 | -334 |
| Pennsylvania | 4,821 | -1,063 |
| Rhode Island | 549 | -121 |
| South Carolina | 1,554 | -343 |
| South Dakota | 464 | -102 |
| Tennessee | 2,030 | -447 |
| Texas | 8,897 | -1,961 |
| Utah | 766 | -169 |
| Vermont | 423 | -93 |
| Virginia | 2,470 | -544 |
| Washington | 2,431 | -536 |
| West Virginia | 885 | -195 |
| Wisconsin | 1,872 | -413 |
| Wyoming | 307 | -68 |
| * Total discretionary grants in 2014 are estimated based on funding for 2012 and use the funding caps established by the Budget Control Act as a baseline. Other notes: Distribution of these grants by state is estimated based on the average distribution of discretionary grants to states in 2006–2010 (excluding 2009 due to the unusual impact of the American Reinvestment and Recovery Act). Assumes that grants to states will be reduced by a percentage equal to the projected cut in all non-defense discretionary funding under the Ryan budget. Excludes grants to states from the U.S. Department of Transportation, because estimating the future size of these grants requires a different methodology from the one used here. | ||
| Table 2: Ryan Budget Would Cause Deep Cuts in Discretionary State and Local Aid from 2013 – 2021 | ||
| Total Discretionary Grants to States & Localities from 2013 – 2021 Under Current Funding Caps* (in millions) | Estimated Cuts of 20.6 Percent to These Grants from 2013 – 2021 Under Ryan Budget (in millions) | |
| United States | $ 1,200,701 | -$ 247,099 |
| Alabama | 17,094 | -3,518 |
| Alaska | 7,699 | -1,584 |
| Arizona | 19,834 | -4,082 |
| Arkansas | 10,122 | -2,083 |
| California | 129,554 | -26,662 |
| Colorado | 15,912 | -3,275 |
| Connecticut | 15,072 | -3,102 |
| Delaware | 3,770 | -776 |
| District of Columbia | 26,703 | -5,495 |
| Florida | 56,727 | -11,674 |
| Georgia | 24,472 | -5,036 |
| Hawaii | 6,137 | -1,263 |
| Idaho | 5,604 | -1,153 |
| Illinois | 49,547 | -10,197 |
| Indiana | 17,782 | -3,660 |
| Iowa | 10,295 | -2,119 |
| Kansas | 9,821 | -2,021 |
| Kentucky | 14,334 | -2,950 |
| Louisiana | 44,239 | -9,104 |
| Maine | 6,531 | -1,344 |
| Maryland | 22,348 | -4,599 |
| Massachusetts | 31,162 | -6,413 |
| Michigan | 36,256 | -7,461 |
| Minnesota | 18,285 | -3,763 |
| Mississippi | 25,171 | -5,180 |
| Missouri | 16,631 | -3,423 |
| Montana | 6,193 | -1,275 |
| Nebraska | 6,600 | -1,358 |
| Nevada | 8,568 | -1,763 |
| New Hampshire | 5,507 | -1,133 |
| New Jersey | 32,928 | -6,776 |
| New Mexico | 9,904 | -2,038 |
| New York | 103,154 | -21,229 |
| North Carolina | 27,599 | -5,680 |
| North Dakota | 4,797 | -987 |
| Ohio | 32,714 | -6,732 |
| Oklahoma | 15,011 | -3,089 |
| Oregon | 14,530 | -2,990 |
| Pennsylvania | 46,214 | -9,511 |
| Rhode Island | 5,261 | -1,083 |
| South Carolina | 14,898 | -3,066 |
| South Dakota | 4,451 | -916 |
| Tennessee | 19,462 | -4,005 |
| Texas | 85,285 | -17,551 |
| Utah | 7,339 | -1,510 |
| Vermont | 4,053 | -834 |
| Virginia | 23,676 | -4,872 |
| Washington | 23,308 | -4,797 |
| West Virginia | 8,488 | -1,747 |
| Wisconsin | 17,948 | -3,694 |
| Wyoming | 2,946 | -606 |
| * Total discretionary grants in 2014 are estimated based on funding for 2012 and use the funding caps established by the Budget Control Act as a baseline. Other notes: Distribution of these grants by state is estimated based on the average distribution of discretionary grants to states in 2006–2010 (excluding 2009 due to the unusual impact of the American Reinvestment and Recovery Act). Assumes that grants to states will be reduced by a percentage equal to the projected cut in all non-defense discretionary funding under the Ryan budget. Excludes grants to states from the U.S. Department of Transportation because estimating the future size of these grants requires a different methodology from the one used here. | ||
End Notes
[1] See Richard Kogan, “$2 Trillion in Deficit Savings Would Achieve Key Goal: Stabilizing the Debt Over the Next Decade,” Center on Budget and Policy Priorities, November 1, 2012, and “Congress Has Cut Discretionary Funding by $1.5 Trillion over Ten Years,” Center on Budget and Policy Priorities,” November 8, 2012.
[2] Some lawmakers have proposed to change the measure of inflation used both to determine annual cost of living adjustments for Social Security and other benefit programs and to adjust various parameters of the tax code each year. Such a change would affect current Social Security beneficiaries. Many deficit reduction plans do also include cuts in Medicare provider payments in the near term and some modest changes affecting beneficiary premiums and cost-sharing charges; the Ryan and Obama budgets save a few hundred billion dollars over the next 10 years from Medicare proposals such as these. However, the larger savings that many policymakers ultimately would like to secure in Medicare would not come until later decades.
[3] Kelsey Merrick and Jim Horney, “Chairman Ryan Gets 62% of His Huge Budget Cuts from Programs for Lower-Income Americans,” Center on Budget and Policy Priorities, March 23, 2012, https://www.cbpp.org/cms/index.cfm?fa=view&id=3723.
[4] Congressional Budget Office, “The Long-Term Budgetary Impact of Paths for Federal Revenues and SpendingSpecified by Chairman Ryan,” March 2012, p. 9, http://www.cbo.gov/publication/43023.
[5] The Budget Control Act imposed caps on defense and non-defense discretionary programs that will reduce their funding by about $1.5 trillion over the ten years from 2012 through 2021, relative to funding levels in 2010 (the last budget enacted before Congress began to cut discretionary programs substantially) adjusted for inflation. Roughly three-fifths of these cuts would come from non-defense discretionary programs. The BCA also established a Joint Select Committee on Deficit Reduction to propose legislation reducing deficits by another $1.2 trillion over that period, and established “sequestration” as a back-up procedure to increase the incentive on the Joint Committee to reach a compromise. Because the Joint Committee failed to achieve its goal, sequestration is now scheduled to occur starting in January 2013 and to cover the period through 2021.
[6] Federal Highway Administration, “2010 Status of the Nation's Highways, Bridges, and Transit: Conditions & Performance,” p. 2-12, http://www.fhwa.dot.gov/policy/2010cpr/pdfs/chap2.pdf.
[7] Federal Aviation Administration,“Funding and Grant Breakdown by Service Level,”, http://www.faa.gov/airports/aip/grant_histories/media/fy2011_aip_grants_states.pdf.
[8] Noelle M. Ellerson, “Cut Deep: How the Sequester Will Impact Our Nation’s Schools,” American Association of School Administrators, p. 3, http://aasa.org/uploadedFiles/Policy_and_Advocacy/files/AASA%20Sequestration%20July%202012.pdf.
[9] U.S. Department of Education, “Improving Basic Programs Operated by Local Educational Agencies (Title I, Part A)”, http://www2.ed.gov/programs/titleiparta/index.html.
[10] National Center for Education Statistics, “The Condition of Education,” http://nces.ed.gov/programs/coe/indicator_cwd.asp.
[11] U.S. Department for Health and Human Services , “Head Start Program Fact Sheet Fiscal Year 2010,” http://eclkc.ohs.acf.hhs.gov/hslc/mr/factsheets/fHeadStartProgr.htm.
[12] U.S. Department of Education, “Findings from the 2011-12 Survey on the Use of Funds Under Title II, Part A,” March 2012, p. 4, http://www2.ed.gov/programs/teacherqual/finalfindings32312.pdf.
[13] National Association of Federally Impacted Schools, “Getting a Grip on the Basics of Impact Aid,” July 2009, http://militarystudent.whhive.com/Content/Media/File/MISA/thebasics.pdf.
[14] Douglas Rice, “Senate Funding Bill Improves on President’s Budget Request for Rental Assistance,” Center on Budget and Policy Priorities, May 22, 2012, https://www.cbpp.org/cms/index.cfm?fa=view&id=3782.
[15] U.S. Department of Health and Human Services, “Low Income Home Energy Assistance Program: Report to Congress for Fiscal Year 2008,” http://www.acf.hhs.gov/programs/ocs/liheap/publications/liheap08rc.pdf.
[16] U.S. Department of Housing and Urban Development, “Community Development Block Grant Program – CDBG,”, www.hud.gov/cdbg.
[17] Douglas Rice, “Senate Funding Bill Improves on President’s Budget Request for Rental Assistance,” Center on Budget and Policy Priorities, May 22, 2012, https://www.cbpp.org/cms/index.cfm?fa=view&id=3782.
[18] U.S. Department of Agriculture, “Nutrition Program Facts,” http://www.fns.usda.gov/wic/WIC-Fact-Sheet.pdf.
[19] U.S. Environmental Protection Agency, “Clean Water State Revolving Fund Programs, 2009 Annual Report,” http://water.epa.gov/grants_funding/cwsrf/upload/2009_CWSRF_AR.pdf.
[20] Substance Abuse and Mental Health Services Administration, “FY 2012 Online Performance Appendix,” http://www.samhsa.gov/Budget/FY2012/SAMHSA-FY12CJ-OPA.pdf.
[21] National Association of Community Health Centers, “Key Health Center Data by State, 2010,” http://www.nachc.com/client//state_X_key_facts_2010.pdf.
[22] U.S. Department of Labor, “Labor Market and Workforce Information, Workforce Investment Act Adult Program,” http://www.doleta.gov/programs/wia.cfm.
[23] U.S. Department of Health and Human Services, “FY 2010 CCDF Data Tables (Preliminary Estimates),” http://www.acf.hhs.gov/programs/ccb/data/ccdf_data/10acf800_preliminary/table1.htm.
[24] U.S. Department of Education, “Adult Education – Basic Grants to States,” http://www2.ed.gov/programs/adultedbasic/index.html.
[25] Federal Emergency Management Agency, “Declared Disasters,” http://www.fema.gov/news/disaster_totals_annual.fema.
[26] Bureau of Justice Assistance, Quarterly Performance Update: Justice Assistance Grant (JAG) Program
[27] U.S. Department of Justice,“COPS Office Awards Over $243 Million to Hire New Officers,” http://www.cops.usdoj.gov/Default.asp?Item=2600.
[28] For historical reasons, the funding provided for transportation programs from the Highway, Mass Transit, and Airport and Airways trust funds — which is called “contract authority” and is determined by periodic legislation within the jurisdiction of House and Senate transportation authorizing committees —is counted as mandatory budget authority. The amount of this funding that is actually available each year, however, is set by obligation limits enacted in annual appropriation acts. While those obligation limits are not counted as providing budget authority, the expenditures flowing from the funding made available by them are counted as discretionary outlays.
[29] There are three minor exceptions to the assumption about the sequestration cuts applying across-the-board to all state and local grants. The BCA limits the sequestration cuts that can be made in 2013 funding for two small grant programs: it exempts half of the Commodity Assistance Program funding from sequestration and limits the cut in Community Health Center funding to 2 percent. In addition, a few small discretionary grants are exempt from sequestration in 2013 because they are administered by the Department of Veterans affairs. We take those limits and exemptions into account in our calculations. No such limits or exemptions apply in subsequent years because the sequestration operates in those years by reducing the caps on overall non-defense funding, so all non-transportation discretionary programs are affected.
[30] For more explanation of how sequestration would occur, see Richard Kogan, “How the Across-the-Board Cuts in the Budget Control Act Will Work,” Center on Budget and Policy Priorities, Revised April 27, 2012, https://www.cbpp.org/cms/index.cfm?fa=view&id=3635.
[31] These cuts are shown in the budget resolution in budget function 920 (“Allowances”), which does not contain any programs and is used to show cuts or other budget changes that have yet to be allocated among the regular budget functions.
More from the Authors

Areas of Expertise


Areas of Expertise
