Poverty and Financial Distress Would Have Been Substantially Worse in 2010 Without Government Action, New Census Data Show
Six temporary federal initiatives enacted in 2009 and 2010 to bolster the economy by lifting consumers’ incomes and purchases kept nearly 7 million Americans out of poverty in 2010, under an alternative measure of poverty that takes into account the impact of government benefit programs and taxes. These initiatives — three new or expanded tax credits, two enhancements of unemployment insurance, and an expansion of benefits through the Supplemental Nutrition Assistance Program (SNAP, formerly called food stamps) — were part of the 2009 Recovery Act. Congress subsequently extended or expanded some of them.
To gauge the impacts of these initiatives on poverty, analysts cannot use the official poverty measure because it counts only cash income and does not take refundable tax credits, SNAP benefits, and other non-cash assistance into account. Therefore, we use a poverty measure that adopts recommendations of the National Academy of Sciences (NAS), and that most experts prefer to the traditional poverty measure. Using the NAS measure to analyze newly released Census data for 2010, we find that the six Recovery Act initiatives kept 6.9 million people above the poverty line in 2010:
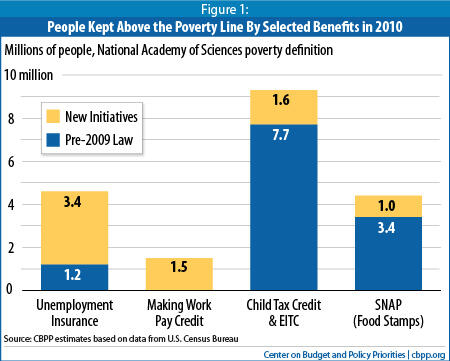
- Expansions in the Earned Income Tax Credit (EITC) and Child Tax Credit (CTC) kept 1.6 million people out of poverty.
- The Making Work Pay tax credit, which expired at the end of 2010, kept another 1.5 million people out of poverty.
- Expansions in the duration and level of unemployment insurance benefits kept 3.4 million people out of poverty.
- Expansions in SNAP benefits kept 1.0 million people out of poverty. [1]
These initiatives had a wide reach across the population, reaching a majority of American households. The 6.9 million people kept above the poverty line in 2010 included an estimated 2.5 million children, 200,000 seniors, 3.1 million non-Latino whites, 1.3 million non-Latino blacks, and 2.0 million Latinos.
The six initiatives also reduced the severity of poverty for 32 million of the 47 million people who were poor under this poverty measure in 2010.
Some of the six initiatives targeted low- and moderate-income households broadly, not just people below or near the poverty line. Because of these initiatives:
- 4.0 million people in 2010 had their family disposable income kept above the equivalent of $50,000 a year for a two-adult, two-child family (adjusted for family size);
- 5.6 million were kept above the equivalent of $40,000;
- 7.8 million were kept above the equivalent of $30,000;
- 6.1 million were kept above the equivalent of $20,000; and
- 2.4 million were kept above the equivalent of $10,000.
These effects are separate from the poverty reduction that resulted from the effects of these and other measures in preventing a deeper economic downturn with a greater loss of jobs. The Congressional Budget Office has estimated that the 2009 Recovery Act preserved or created between 1.0 and 2.9 million jobs through June 2011. The six initiatives examined here contributed to that result by helping to shore up collapsing consumer demand.
In addition to these six provisions enacted in 2009 and 2010, existing policies to promote family income kept millions of additional Americans out of poverty in 2010. Under the same NAS poverty measure, the SNAP and unemployment insurance benefits provided under ongoing law (before taking account of the effect of the program expansions examined here) kept more than 3 million and 1 million people out of poverty in 2010, respectively. If the government safety net as a whole (existing policies, as well as the temporary Recovery Act policies) had not existed in 2010, the poverty rate would have been 28.6 percent, nearly twice the actual 15.5 percent.
The Center's Analysis
The Center estimated the impact of six initiatives enacted in early 2009 as part of the Recovery Act, chosen because their effects can be calculated fairly reliably from available survey data. The six are: three federal income tax credits (expansions to the EITC and Child Tax Credit and creation of a new Making Work Pay tax credit), two unemployment insurance provisions (an increase in the number of available weeks of benefits, and an increase in the weekly benefit amount that was in effect through December 2011 but has since ended), and an increase in monthly SNAP benefit levels.
Data are from the nationally representative Current Population Survey, which the Census Bureau uses for both its official and its alternative measures of poverty. To determine poverty status, we used a measure developed by the Census Bureau and Bureau of Labor Statistics that follows the recommendations of the National Academy of Sciences’ panel and that most experts prefer to the official poverty measure. The NAS measure differs from the official poverty measure in three significant ways: it counts more income sources, including tax credits and non-cash benefits such as SNAP assistance (the official measure counts only cash income); it subtracts certain expenses that reduce disposable income, including income and payroll taxes and out-of-pocket medical expenditures and work expenses such as child care; and it employs a modestly revised poverty line that is set at $24,267 for a two-adult, two-child family in an average-cost community and that varies with local housing costs and family composition.
Individuals are considered poor if their family’s annual income is below the poverty line for a family of their size and age composition living in their locality. Individuals are considered to have been kept above the poverty line by a particular program if their family income not counting the benefits from that program is below the poverty line, but their total income — including those benefits — is above the poverty line.
Details of the methodology are provided in the Appendix.
Existing Policies Kept Millions out of Poverty
This analysis focuses on the six initiatives enacted in 2009 and 2010, which include one new program (the now-expired Making Work Pay tax credit) and five expansions of existing programs (two unemployment insurance expansions, two tax credit expansions, and a SNAP expansion). But assistance provided under existing policies to protect family income also had a marked effect in reducing poverty. Figure 1 compares the estimated poverty impact of the new assistance with that of the programs of which they are a part.
The unemployment insurance program as a whole, for example, kept 4.6 million people above the poverty line in 2010, according to the NAS poverty measure:
- An estimated 3.4 million of that 4.6 million was due to expansions that Congress enacted in the Recovery Act and subsequent legislation in 2009 and 2010. (The additional weeks of eligibility kept 3.2 million people out of poverty, while higher weekly benefits kept another 200,000 people out of poverty in 2010.)
- The remaining 1.2 million people kept out of poverty by unemployment insurance were people lifted out of poverty primarily by assistance that unemployment insurance would have provided under pre-2009 law.[2]
In other words, even without the Recovery Act, government safety-net programs would have protected many people from poverty as the economy turned down. Programs such as unemployment insurance are designed to respond quickly and automatically to an increase in the number of households seeking assistance during a recession. (In 2007, prior to the onset of the recession, the unemployment insurance program kept 700,000 people above the NAS poverty line; our estimates suggest that this figure would have risen to close to 1.2 million by 2010 even without the new initiatives.) Likewise, SNAP would have kept over 3 million people above the poverty line in 2010 — up from 2.2 million in 2007 — even without the expansion in maximum benefits in the 2009 Recovery Act.
Nonetheless, the new initiatives represent a sizable increase in the protection that these programs — and the safety net as a whole — have provided during one of the most severe economic downturns in decades.
Government Programs Prevented Much Larger Surge in Poverty
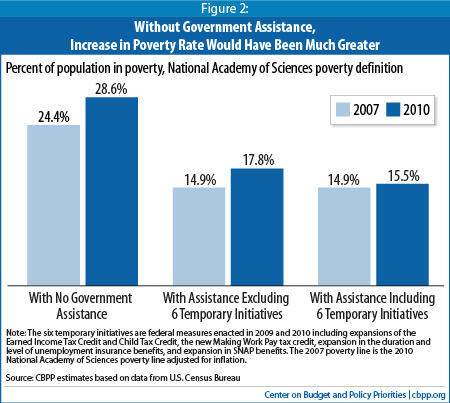
Census data show that in 2010, poverty rates without government income assistance of any sort would have been nearly twice as high as they actually were: 28.6 percent rather than 15.5 percent (see Figure 2). [3] This shows the impact of public programs, including not only tax credits, unemployment insurance, and SNAP benefits but also Social Security, Supplemental Security Income, veterans’ benefits, public assistance (including Temporary Assistance for Needy Families), and housing assistance, among others, and the net effect of the tax system. Without government help from the six initiatives highlighted in this analysis, but with the rest of the safety net, the poverty rate in 2010 under our NAS measure would have been 17.8 percent in 2010.
The six initiatives brought poverty down further, so that poverty was considerably lower in 2010 than it otherwise would have been.
- Between 2007 and 2010, the number of Americans below the poverty line increased by 2.9 million (from 44.4 million to 47.3 million), based on the NAS poverty line adjusted for inflation, [4] while the poverty rate under this measure rose from 14.9 percent to 15.5 percent.
- Without the six initiatives, the number of people in poverty would have risen by an estimated 9.9 million people since 2007, or more than three times as much, while the poverty rate would have risen to 17.8 percent, or nearly five times as much as it actually rose.
Figure 2 also shows that the safety net was responding to the economic downturn even without these six initiatives. In 2007, some 9.5 percent of all Americans were kept above the NAS poverty line by the remainder of the safety net; this is the percentage of people whose incomes were below the poverty line before any government benefits were counted but above the poverty line after assistance other than the six Recovery Act initiatives was counted. And by 2010, the safety net other than the six temporary initiatives was keeping 10.8 percent of Americans out of poverty. This increase in poverty protection as the economy deteriorated largely reflects the increase in assistance provided by unemployment benefits, tax credits, SNAP assistance, and other benefits that respond automatically to increases in the number of low-income people during economic downturns.
But these automatic increases would not have been enough by themselves to prevent the NAS poverty rate from rising quite substantially. Without the additional assistance provided by the six initiatives, the poverty rate would have increased from 14.9 percent to 17.8 percent between 2007 and 2010, and 6.9 million more people would have become poor than actually did.
2010 Still a Very Bad Year for Many
These figures indicate that government assistance shielded the incomes and buying power of millions of families and individuals enough to keep them above the poverty line despite the sharpest deterioration in the economy in decades and prevented a much larger increase in poverty than actually occurred (using the alternative poverty measure discussed here). That is no small accomplishment.
It does not mean, of course, that government assistance staved off all, or even most, recession-related hardship. To the contrary. Neither the official poverty rate nor the alternative poverty rate captures the financial losses of families whose incomes dropped from comfortable levels to only slightly above the poverty line, or of working-poor families that lost wages and fell deeper into poverty, or of families whose assets were depleted or wiped out by plummeting home values or a drop in the value of their retirement savings. Nor do these measures capture rising foreclosures and the lack of affordable housing or disruption and anxiety due to job loss.
Poverty Could Rise Higher as Assistance Expires, Joblessness Remains Widespread, and Governments Cut Budgets
The six temporary initiatives assessed here all have expired or are scheduled to expire in coming months or in the next year or two, along with various other federal initiatives enacted to promote job growth and ease poverty and hardship during the recession. These expirations, combined with continuing high rates of joblessness and budgets cuts by federal, state, and local governments, raise questions about what will happen to struggling families and to the level of poverty and hardship in the period ahead.
Two of the six initiatives have already expired: in December 2010, unemployed workers received their last payments of an additional $25 per week in unemployment benefits, and the Making Work Pay tax credit expired at the end of 2010. (It was replaced by a payroll tax holiday that is generally less valuable to the lowest-income households and that is currently slated to expire on December 31, 2011.[5]
Long-term unemployment benefits through the Emergency Unemployment Compensation program are scheduled to expire after January 3, 2012. The expansions in the Child Tax Credit and EITC are due to expire at the end of 2012. And by November 2013, the temporary increase in SNAP benefits, which is phasing down year by year, will end entirely, as well.
Other federal initiatives not analyzed here also have expired. For example, the TANF Emergency Fund, which supported (among other things) roughly a quarter-million subsidized jobs for low-income parents and youth, expired in September 2010.
Forecasters project stubbornly high unemployment over the next few years; the Congressional Budget Office predicts unemployment rates above 8.0 percent through the end of 2014. The Federal Reserve is not quite so pessimistic as CBO but just released projections that the unemployment rate will range from 7.8 to 8.2 percent in 2013 and from 6.8 to 7.7 percent in 2014. In addition, history suggests that poverty may remain elevated longer than unemployment does: in the last three recessions, the poverty rate did not begin to fall until a year after the annual unemployment rate began to decline. If this pattern holds true, poverty may not return to pre-recession levels for a very long time.
At the state level, policymakers have enacted some of the harshest cuts in recent history for many vulnerable families. In 2011, a number of states cut cash assistance deeply for significant numbers of families that live far below the poverty line, including many with physical or mental health problems. For example, South Carolina cut TANF benefits by 20 percent, reducing benefits for a family of three from $270 per month to $216 — just 14 percent of the poverty line. Numerous states are also cutting child care and other work-related assistance, which will make it harder for some poor parents with jobs to retain them.[6] Ten states also have taken steps to cut regular state unemployment benefits.
This suggests that whether the Joint Select Committee on Deficit Reduction ensures that any proposals it produces do not worsen poverty — as the bipartisan Bowles-Simpson report called upon policymakers to do — or whether federal policymakers instead impose significant cuts in programs for those at the bottom of the income scale will have a large bearing on poverty levels in the years ahead. If significant federal cutbacks occur, the combination of those cuts, state budget cuts, and ongoing labor-market weakness may drive poverty still higher in the next few years and cause it to remain very high long after the economy recovers.
Methodological Appendix
We consider persons to be kept above the poverty line by a program if their family’s income not counting that program was below the poverty line in 2009 but their income counting benefits from that program was above the line.
We do not use the official poverty measure because it is based only on cash income and misses the impact of tax credits and SNAP benefits. Instead, we use a broader measure that closely follows NAS recommendations.[7] Income by this measure includes all cash income after taxes plus the value of selected cash-like benefits (SNAP, school lunch subsidies, housing assistance, and home energy assistance) minus estimates of child care and other work expenses and medical out-of-pocket (MOOP) expenditures. Taxes are federal and state income and payroll taxes net of tax credits.[8] Data are from the public use file of the Census Bureau’s Current Population Survey (CPS) 2011 Annual Social and Economic Supplement and refer to income year 2010.[9]
Under this measure, 47.3 million Americans, or 15.5 percent of the population, were below the poverty line in 2010, counting all assistance from the Recovery Act and other sources. Without the six initiatives that we examine, an estimated 54.3 million people, or 17.8 percent of the population, would be below the poverty line.
| Table 1: Persons in Families with Income Below the Poverty Line, 2010 (NAS Definition) |
||
| Number of People | Percent | |
| All Ages | 47,320,000 | 15.5% |
| Under 18 Years | 12,948,000 | 17.4% |
| Ages 65 and Older | 6,467,000 | 16.5% |
| Source: CBPP analysis of Census data. | ||
We assess the poverty-reducing impact of six temporary initiatives. These are three tax credits (the Making Work Pay Tax Credit, which provided up to $800 per worker; an improvement to the Child Tax Credit that provided up to $1,433 more for a working family with near-minimum-wage earnings; and an expansion in the Earned Income Tax Credit for married couples and for families with three or more children); two unemployment insurance provisions (a continuation of the temporary federal Emergency Unemployment Compensation, or EUC, program created in 2008 for long-term jobless workers who had exhausted their unemployment benefits; plus an additional payment of $25 per week, called Federal Additional Compensation, for each week of state or federal unemployment benefits); and a 13.6 percent increase in maximum benefits in the Supplemental Nutritional Assistance Program (SNAP).
We estimate the effect of each of these provisions on poverty as follows:
Making Work Pay Tax Credit. Census provides on the CPS public use file an estimate of the value of this credit for each individual, which we use.
Improved Child Tax Credit (CTC) and Earned Income Tax Credit (EITC). Census provides an estimate of the total value of the CTC and EITC in 2009 but does not separately show the portion that represents the Recovery Act improvements. Therefore, we use income data available on the public use file to make our own calculation of each person’s taxes and tax credits, both with and without the Recovery Act improvements. The difference between the credit value with and without these improvements constitutes the effect of the Recovery Act. Our estimates closely match the Census estimates of the total value of the credits in terms of their impact on poverty:
- The total Child Tax Credit kept nearly 2.6 million people above the NAS poverty line in 2010 according to both the Census Bureau’s tax calculations and our own. Without the Recovery Act’s CTC improvements, this figure would be just over 1.5 million people, indicating that those improvements kept about 1.0 million people above the poverty line.
- The EITC as a whole kept 6.26 million people above the poverty line in 2010 according to Census estimates and 6.25 million according to our own. Without the Recovery Act’s improvements, our estimate is 5.76 million people, indicating that those improvements had an anti-poverty effect of 0.49 million.
Emergency Unemployment Compensation (EUC) for long-term unemployed workers. For most survey participants with unemployment income, the CPS does not provide sufficient information about the duration and timing of their unemployment spells to identify eligibility for this program. However, we can identify eligibility among certain long-term unemployed workers in the survey — those whose unemployment spell in 2010 persisted until the following year when they were interviewed for the CPS.[10] We use information about these unemployed workers to determine that, for every 100 such workers who reported receiving unemployment income in 2010 and who we identify as having a long-term unemployment spell eligible for EUC, about 36 persons (including workers’ family members) were kept above the poverty line by that income. We apply this ratio to the 4.5 million workers who, according to Labor Department data, were receiving EUC benefits in the average week of January 2010 and the additional 4.9 million who entered the program between February and December of 2010. The result indicates that 3.2 million people were kept above the poverty line by these EUC benefits.
Under pre-2009 law, they would not have been eligible for this help. Many of them, however, would have been eligible for a shorter period of long-term unemployment insurance benefits under a separate program, the permanent federal Extended Benefits (EB) program. We estimate that, under rules in place before the 2009 Recovery Act, EB would have kept 0.7 million people out of poverty. While do not show this amount separately, we subtract it from the total when we calculate that the overall net effect of the six initiatives was to keep 6.9 million people out of poverty.
$25 per week in Federal Additional Compensation (FAC) added to unemployment benefits. For every person who reports receiving unemployment insurance benefits during the year, we consider their FAC benefit to be equal to $25 for each of the first 26 weeks of unemployment reported for the year (not to exceed the total value of unemployment compensation reported).
Higher SNAP benefits. For families that report receiving SNAP benefits, we multiply the expected monthly benefit increase specified by the Recovery Act by the number of months of SNAP receipt. The expected monthly benefit increase is $85.25 for a family of four and varies by family size.[11]
How Well Does the Method Work?
For the six initiatives, the analysis is likely to understate the amounts that some types of families received and overstate the amounts for other types of families, but for the programs for which we have data, the analysis appears on balance to modestly understate the total amount received. The aggregate dollar value we estimate for the two unemployment initiatives is $65.6 billion in 2010, somewhat less than the $80.4 billion shown by program records from the Department of Labor, suggesting that our estimates may be conservative.[12] Likewise, the aggregate value of higher SNAP payments we estimate is $8.0 billion, compared with $11.3 billion reported by the Bureau of Economic Analysis (BEA). On the other hand, the Census estimate that we use for the Making Work Pay Credit is $55.5 billion for tax year 2010; although data on the true actual of the credit in tax year 2010 are not yet available, Treasury and BEA reports suggest that about $53 billion was paid in calendar year 2010.[13] Administrative data for the other two tax credit expansions we assess are not yet available, but preliminary figures suggest our method likely does not overstate the value of Recovery Act tax credits overall.[14]
| Table 2: Number of People Kept Out of Poverty by Six Initiatives in 2010 (NAS Poverty Measure) |
|||||||
| Total | Under 18 | White non-Hispanic | Black non-Hispanic | Hispanic | |||
| Total, Six Initiatives | 6,947,000 | 2,526,000 | 3,054,000 | 1,325,000 | 2,019,000 | ||
| Tax Credit Expansions | |||||||
| Child Tax Credit | 1,036,000 | 613,000 | 346,000 | 199,000 | 401,000 | ||
| EITC | 490,000 | 275,000 | 114,000 | 95,000 | 206,000 | ||
| (CTC+EITC combined) | 1,567,000 | 913,000 | 499,000 | 248,000 | 677,000 | ||
| Making Work Pay Tax Credit | 1,477,000 | 439,000 | 601,000 | 237,000 | 511,000 | ||
| Unemployment Insurance: | |||||||
| EUC (more weeks) | 3,238,000 | 776,000 | 1,888,000 | 496,000 | 643,000 | ||
| FAC ($25 more per week) | 197,000 | 53,000 | 102,000 | 33,000 | 42,000 | ||
| SNAP Expansion | 989,000 | 450,000 | 333,000 | 332,000 | 243,000 | ||
| Note: Items do not sum to totals as a result of program overlap. Source: CBPP analysis of March 2011 Current Population Survey. | |||||||
End Notes
[1] Details may not sum to the total because of program overlap. That is, some people are kept above the poverty line by more than one program, but in the total they are counted only once; for other people, no single program is enough to alter their poverty status, but they are counted in the total because two or more programs combined kept them above the poverty line. In addition, as explained below, the 6.9 million total is net of the effect of certain unemployment insurance benefits that would have become available if the Recovery Act had not been enacted.
[2] This figure also includes some smaller unemployment insurance improvements made in the 2009 Recovery Act, including “UI modernization” provisions, that were not part of the two unemployment initiatives whose effects we were able to quantify separately.
[3] These figures assume, as seems likely in most cases, that people who suffered lost income during the recession due to job loss, investment losses, or other reasons generally would not have been able to avert those income losses if government assistance had not been available. The figures also do not include additional private-sector employment and earnings created by government assistance as a result of its boost to consumer purchasing power during the economic downturn.
[4] NAS-based poverty measures use a number of methods of updating from year to year. The main NAS measure we use here (called MSI-GA-CE) is generally updated based on the increase in the typical (median) two-adult two-child family’s consumer expenditures on basic needs (food, clothing, shelter and utilities) averaged over three years. A number of other NAS measures released by the Census Bureau use a poverty line updated only for inflation using the Consumer Price Index (CPI). Here, to be conservative, we use the 2010 poverty threshold adjusted to 2007 dollars using the CPI method. If we use the consumer expenditure (CE) method preferred by the NAS panel, our findings on the efficacy of the safety net are even more dramatic — poverty would have risen by only 1.6 million from 2007 to 2010 — rather than 8.5 million without the effect of the six initiatives — implying that the initiatives averted an even larger share of the increase in poverty.
If we use a non-NAS measure, we again find similar results. Defining poverty as cash income after taxes plus the value of SNAP benefits and housing assistance, we find that poverty rose by 3.0 million (from 11.0 percent in 2007 to 11.7 percent in 2010). Without the six initiatives, it would have risen by 8.8 million (to 13.6 percent), or about three times as much.
[5] The enacted payroll tax holiday would have kept 1.1 million people above the NAS poverty line if it had been in place in 2010, based on our analysis of the 2010 data. The Obama Administration has proposed an enlarged version of the payroll tax holiday that we estimate would have kept 1.7 million people above the poverty line in 2010.
[6] Erica Williams, Michael Leachman, and Nicholas Johnson, "State Budget Cuts in The New Fiscal Year Are Unnecessarily Harmful," Center on Budget and Policy Priorities, updated July 28, 2011 ; Liz Schott and LaDonna Pavetti, "Many States Cutting TANF Benefits Harshly Despite High Unemployment and Unprecedented Need," Center on Budget and Policy Priorities, May 19, 2011.
[7]Census tables include eight alternative NAS-based based poverty measures, in addition to the Supplemental Poverty Measure (SPM), which is a newer refinement of those measures. We cannot use the Supplemental Poverty Measure in this analysis because the Census Bureau has not yet released the detailed data needed for reproducing the measure and the measure is not available for years before 2009. Therefore, we use the NAS measure that most closely corresponds to the original NAS recommendations, issued in 1995. That measure is referred to in Census tables as "MSI-GA-CE," which stands for Medical-out-of-pocket expenditures Subtracted from Income, with Geographic Adjustment of the poverty threshold and year-to-year updating of the poverty line in accordance with Consumer Expenditure data on basic needs expenditures of typical households rather than with the Consumer Price Index.
[8] The Census Bureau counts tax credits as income in the tax year for which they are filed, even if the family receives them in the following year, a practice we follow.
[9] The survey data are merged with an additional data file from the Census Bureau's Experimental Poverty Measures website that includes geographic adjustments and other poverty measurement information.
[10] We identify unemployment compensation recipients eligible for EUC benefits between January and December of 2010, based on complete data on the length of the worker’s current unemployment spell, reported in the monthly basic CPS file for February, March, and April 2011. In general, we count the participant’s 27th through 80th weeks of unemployment in 2009 as eligible for EUC assistance, because regular state unemployment benefits run out after 26 weeks. (In Massachusetts and Montana, regular state unemployment benefits last longer, a difference we account for.) We consider a person’s EUC benefit to be a percentage of their reported annual total unemployment income, based on the share of their reported unemployment weeks that appear to be eligible for EUC. For example, if a person reports an unemployment spell that began in the first week of April, 2010, we assume that his or her regular unemployment benefits expired 26 weeks later, and the EUC benefits lasted the remaining 13 weeks of the year through December 31, so the EUC benefits were 13 / (26+13) or 33 percent of his or her total unemployment benefits for the year.
[11] For a family of four, the increase during calendar year 2010 was $85 per month from January to September and, after the start of a new federal fiscal year on October 1, $86 per month from October to December, yielding an average of $85.25 per month. We multiply the appropriate monthly figure for each family by the number of months of SNAP benefits reported by the household and cap the result so that it does not exceed the family’s reported total SNAP income.
[12] We also check that our method is not overstating the average duration of long-term unemployment benefits. In our method, the average EUC spell is 24 weeks, similar to or slightly lower than what program records suggest (25 weeks).
[13] BEA records suggest the credit provided about $38.6 billion in reduced income tax withholding in 2010 (for tax year 2010) while Treasury Department records show $13.9 billion in outlays during CY 2010 (corresponding with credit refunds paid for tax year 2009).
[14] According to BEA, the combined value of all Recovery Act refundable tax credits paid out in 2010 (generally for the 2009 tax year) plus the tax reduction under the Making Work Pay credit in 2010 equals $68 billion. Our estimates produce a slightly lower figure, $65 billion, for the value of the three Recovery Act credits in tax year 2010.
More from the Authors
