Poverty Rate Second-Highest in 45 Years; Record Numbers Lacked Health Insurance, Lived in Deep Poverty
Driven by the persistent weakness in the economy, the poverty rate in 2010 reached its second-highest point since 1965, median income declined, and the number and percentage of Americans without health insurance stood at record highs, the Census Bureau said yesterday. The share of Americans in "deep poverty" — with incomes below half of the poverty line — also hit the highest level on record, with data going back to 1975 (see Appendix Table 1).
Contributing to the high percentage of Americans who have no health insurance was the decline in the percentage of Americans with employer-provided health coverage. The new data also highlight the importance of implementing health care reform, slated to take full effect in 2014.
The new Census figures also show that millions more Americans would have fallen into poverty or become uninsured if not for programs like unemployment insurance, food stamps, the Earned Income Tax Credit (EITC), and Medicaid, which face major decisions by federal and state policymakers — and could face substantial cuts.
Several facts stand out from the new Census data:
- The poverty rate reached a near-record high. One in seven or 15.1 percent of Americans were poor in 2010, up from 14.3 percent in 2009. The last time the poverty rate hit 15.1 percent was in 1993. Since 1965, the poverty rate has surpassed 15.1 percent only once, in 1983, when it stood at 15.2 percent. The number of Americans with incomes below the official poverty line ($22,314 for a family of four) rose by 2.6 million in 2010 to 46.2 million.
- The ranks of the uninsured remained at an all-time high. While statistically indistinguishable from 2009, the percentage of people uninsured in 2010 stood at a record high of 16.3 percent. The number of people without health insurance rose by 900,000 in 2010, to an all-time high of 49.9 million, with data going back to 1987. [1] The increase in the uninsured population reflected the ongoing erosion of employer-sponsored insurance, which covered a record low share of Americans (55.3 percent) in 2010. For children, Medicaid and the Children's Health Insurance Program (CHIP) have successfully countered this trend; the percentage of children who were insured was lower in 2010 than in 2007 before the economic downturn started, because Medicaid and CHIP expanded and offset the loss of employer coverage among children. In 2010, the number of children with employer-based coverage fell by 800,000, but 700,000 children gained coverage through Medicaid or CHIP. Among adults, by contrast, Medicaid failed to offset the decline in employer coverage, largely because Medicaid eligibility rules are far more restrictive for adults than for children.
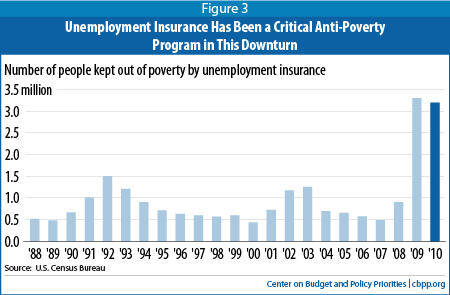
- Government assistance — both ongoing programs like unemployment insurance, the Earned Income Tax Credit (EITC), and SNAP (formerly called food stamps), and temporary increases in these and other programs enacted in the 2009 Recovery Act — kept millions of Americans above the poverty line. The Census figures show, for example, that unemployment benefits — including federal benefits scheduled to expire at the end of this year and state unemployment benefits that a number of states have recently chosen to pare back — kept 3.2 million people above the poverty line in 2010. In addition, while the official poverty measure does not count SNAP (food stamp) or EITC benefits as income, the Census Bureau reported that if they were counted, SNAP benefits would lift 3.9 million people out of poverty while the EITC would lift 5.4 million people out of poverty. (These benefits are counted under an alternative measure of poverty that many analysts favor and that the Census Bureau will issue later this year.)
- Deep poverty reached its highest point on record. In 2010, the number and share of Americans who lived below half of the poverty line (below $11,157 for a family of four) reached its highest level on record. Some 20.5 million people (6.7 percent of the population) had incomes this low.
Poverty may rise still higher in 2011 and 2012. Analysts expect unemployment to remain high over this period. After recessions, poverty typically is slower to decline than unemployment; in each of the previous three recessions, the poverty rate did not begin to fall until at least a year after the unemployment rate began to drop. In addition, large cuts in federal and state assistance to low-income families could increase poverty: temporary federal initiatives designed to create jobs and ease hardship during the recession are expiring, and the provision of additional weeks of unemployment benefits to long-term unemployed workers is scheduled to phase out after December 2011.
Congress also could make sizeable cuts in low-income assistance as part of deficit-reduction efforts, and states are already cutting assistance to poor families. Much may depend on whether the new congressional Joint Select Committee on Deficit Reduction adheres to the core principle that the Bowles-Simpson Commission report set forth and the "Gang of Six" plan also sought to honor — that deficit reduction should not increase poverty and that low-income assistance programs should be shielded from cuts. A departure from this principle likely would cause large increases in poverty in the years ahead.
Enactment of a significant federal jobs package, however, such as the proposals President Obama outlined on September 8, could have beneficial impacts in lessening poverty while the economy remains weak.
Poverty Increased by 8.9 Million Since Start of Recession
By 2010, the number of people in poverty had risen by 8.9 million since 2007, the last year before the economy turned down. These numbers largely reflect the struggling labor market.
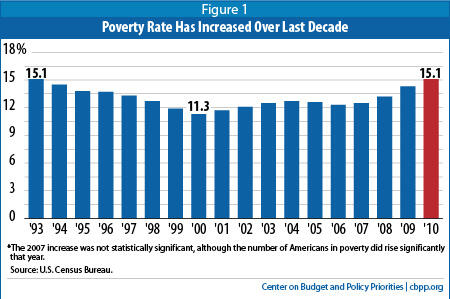
Adding to this gloomy picture is the fact that the poverty rate has increased significantly in seven of the last ten years, [2] including most of the years from 2001 to 2007, a time when the overall economy was growing (see Figure 1). For the poverty rate to be higher at the peak year of an economic recovery (2007) than in the last year of the previous recession (2001) is unprecedented (and adds to the evidence that the economic growth of that period was not widely shared). [3] Thus, even before the recession began, a growing number of Americans were already being left behind by the economy.
The Census Bureau's official poverty figures do not count as income some important forms of government assistance that have helped push back against rising poverty, such as SNAP benefits and refundable tax credits like the Earned Income Tax Credit, because the official poverty measure is based on pre-tax cash income. The Census Bureau also publishes alternative poverty measures that do count these and other additional types of income; those measures generally show a far smaller increase in the poverty rate from 2007 to 2009 than the official measure, reflecting increases in tax credits and SNAP during these years. The Census Bureau plans to release 2010 poverty data using these alternative measures later this year.
Public Health Insurance Initiatives Offset Erosion of Employer Health Coverage
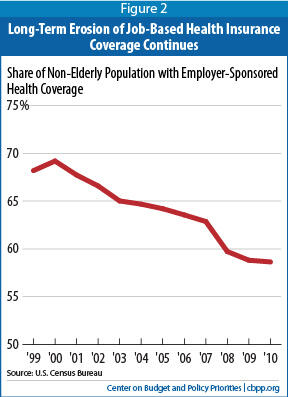
The increase in the uninsured population in 2010 resulted from a decline in private health coverage, which in turn reflected a decline in employer-based coverage. Employer coverage has been eroding for a number of years, and this trend accelerated sharply in 2009 and 2010, due in part to steep job losses (see Figure 2). Only 58.6 percent of the non-elderly population had employer coverage in 2010, down from 59.4 percent in 2009, 63.4 percent in 2007, and 68.2 percent in 1999, the first year for which comparable data are available. (Medicare covers virtually all elderly people.)
Only a significant increase in coverage by Medicaid and other government-funded health care programs prevented a more severe decline in overall insurance coverage since the start of the recession. The percentage of non-elderly people insured by Medicaid increased significantly, from 13.9 percent in 2007 to 16.9 percent in 2010. Significant cuts in federal or state Medicaid funding would weaken this coverage and leave more individuals uninsured or underinsured.
Age differences in the insurance data highlight the role of public programs in offsetting some of the erosion in private coverage. While the number of uninsured people overall grew in 2010 due principally to continued erosion in employer-based health coverage, children escaped this trend because Medicaid and the Children's Health Insurance Program (CHIP) filled the gap. Both the number and the percentage of children who were uninsured were actually lower in 2010 than in 2007, before the economic downturn started, because Medicaid and CHIP expanded and more than offset the loss of employer coverage among children. Between 2007 and 2010, the number of children with employer-based coverage fell by 3.4 million but significantly larger numbers of children gained coverage through Medicaid or CHIP. Some 570,000 fewer children were uninsured in 2010 than in 2007 as a result.
These data underscore the importance of implementing the Affordable Care Act reforms scheduled to take effect in 2014, which are designed to make coverage available and affordable to people who do not have employer-based insurance. Full implementation of the Affordable Care Act will strengthen and extend coverage to most of the 41.8 million adults age 18-64 who lacked insurance in 2010. Full implementation of health reform also will prevent insurance companies from denying coverage or charging people with medical conditions very high premiums that they often cannot afford. Indeed, the new data suggest that the health reform law may already be having a positive effect on coverage; the requirement that health insurers cover adult dependent children up to age 26 likely contributed to the significant reduction in the number and percentage of young adults age 19-25 without health insurance between 2009 and 2010. This is the only age group of non-elderly adults for which the percentage without insurance declined between 2009 and 2010.
Safety Net Programs Proving Effective at Reducing Poverty
The Census data show the impact that various federal programs had on poverty in 2010.
- Unemployment benefits kept 3.2 million people above the poverty line in 2010. That is, 46.2 million people were poor under the official poverty measure, which counts unemployment benefits as part of income, but 49.4 million would have been poor if these benefits were excluded. (See Figure 3.)
- Social Security kept 20.3 million people out of poverty, including 13.8 million seniors and 1.1 million children.
- SNAP is not counted as income in the official poverty definition but does help reduce financial hardship; counting the value of families' SNAP benefits as income — as alternative poverty measures do — would have lifted an additional 3.9 million people, including 1.7 million children, above the poverty line in 2010.
- Taxes, likewise, are not considered in the official poverty measure. Counting the value of the Earned Income Tax Credit (EITC), as alternative poverty measures also do, would reduce the number of people in poverty by 5.4 million in 2010, including 3.0 million children. Image
Previous analyses of Census data have shown that overall, safety net programs reduce the number of poor Americans by almost half, based on an expanded measure of poverty that counts non-cash benefits and taxes and makes other adjustments to better reflect the resources available to households. [4] According to researchers, poverty would increase dramatically in the absence of these programs.[5]
Poverty Could Rise Higher Due to Continuing Joblessness, Budget Cuts, and Expiring Assistance
Forecasters project stubbornly high unemployment over the next few years; the Congressional Budget Office, for example, predicts unemployment rates above 8.0 percent through the end of 2014. In addition, history suggests that poverty may remain high longer than unemployment does: as noted, in the last three recessions, the poverty rate did not begin to fall until a year after the annual unemployment rate began to decline. If this pattern holds true, poverty will not start to decline until 2012 at the earliest, given the failure of unemployment to improve in 2010, and poverty may not return to pre-recession levels for a very long time.
Exacerbating this grim outlook, various federal initiatives enacted to promote job growth and ease poverty and hardship during the recession have expired or are scheduled to expire soon. For example, the TANF Emergency Fund, which supported (among other things) roughly a quarter-million subsidized jobs for low-income parents and youth, expired in September 2010, and federal unemployment benefits for jobless workers who have been looking for work for more than half a year (currently serving 3.6 million such workers) are scheduled to expire at the end of December.
At the state level, legislators have implemented some of the harshest cuts in recent history for many of the nation's most vulnerable families. In 2011, a number of states cut cash assistance deeply or ended it entirely for many families that live far below the poverty line, including many with physical or mental health problems. For example, South Carolina cut TANF benefits by 20 percent, reducing benefits for a family of three from $270 per month to $216 — from 18 percent to 14 percent of the poverty line. Numerous states are also cutting child care and other work-related assistance, which will make it harder for some poor parents with jobs to retain them.[6] Ten states also have taken steps to cut regular state unemployment benefits.
The decisions that the joint congressional committee on deficit reduction makes — about whether to ensure that its proposals do not worsen poverty, as the Bowles-Simpson report called upon policymakers to do, or whether instead to impose significant cuts in programs for those at the bottom of the income scale — will be of particular importance.
If significant federal and state government cutbacks are made, the combination of those cuts and ongoing labor market weakness will likely drive poverty higher in coming years and could cause poverty to remain at quite high levels long after the economy recovers.
New Data Signal Need for More Government Help, Not Less
The increase in poverty in 2010 is further evidence of how weak the economy was for millions of Americans. These data, and the continuing weakness in the labor market in 2011, underscore the need to bolster both job creation and the safety net in order both to shore up the economy and to ease hardship. Although the economy has been growing since mid-2009, the pace has slowed this year; in the first half of 2011, growth fell below 1 percent — far too slow to generate enough jobs to reduce unemployment and poverty noticeably.
The Census data also document the effectiveness of government safety-net programs in keeping financial hardship from rising still higher. As noted earlier, unemployment benefits kept several million people above the poverty line in 2010, and while the official poverty figures do not count SNAP benefits and tax credits such as the EITC and Child Tax Credit, these programs did reduce the economic burdens on poor families.
Such safety-net programs help not only participating households but also the broader economy. In an economic slump like the one we are experiencing now, every additional dollar spent on assistance such as unemployment benefits generates about $1.50 in spending as it ripples through the private economy, according to Mark Zandi, Chief Economist at Moody's Analytics. Strong effects also are seen for SNAP ($1.70 per dollar spent) and refundable tax credits like the Earned Income Tax Credit (about $1.25) and Child Tax Credit (about $1.40). CBO estimates that, thanks to these and various other recession-fighting measures in the 2009 Recovery Act, the number of jobs in 2010 was between 1.3 million and 3.3 million greater than it would have been otherwise.
Strong government action against poverty and inequality need not conflict with deficit reduction. The three major federal deficit-reduction packages of the last two decades — those in 1990, 1993, and 1997 — actually reduced poverty and inequality even as they shrank deficits, thanks to increases in the EITC (in the 1990 and 1993 packages) and food stamps (in the 1993 package) and the creation of CHIP (in the 1997 package). The United States already has higher degrees of poverty and inequality than most other Western industrialized nations; deficit reduction need not make these problems worse.
Additional Details from the Census Data
- Overall median household income, regardless of age, stood at $49,445 in 2010, down 2.3 percent from $50,599 in 2009. Compared with 2007, when the recession began, median income was down 6.4 percent or $3,378.
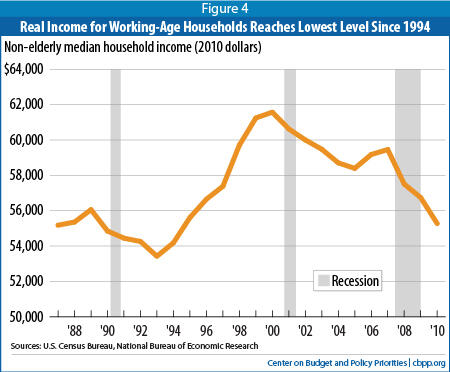
- The median income of working-age households declined in 2010. Median income dropped 2.6 percent for households headed by someone under age 65, continuing a decade-long downward trend. Median income for this group has declined in eight of the last ten years, falling from $61,574 in 2000 (in 2010 dollars) to $59,460 in 2007 and to $55,276 in 2010, a cumulative loss of 10.2 percent over the decade. (See Figure 4.)
- One-third of Americans had what many researchers term "low incomes" — incomes below 200 percent of the poverty line. The share of Americans with low incomes rose in 2010 to 33.9 percent, from 33.0 percent in 2009.
- Child poverty rose to 22.0 percent, up from 20.7 percent in 2009 and 18.0 percent in 2007, before the recession began. Poverty in early childhood has been found to hinder later school achievement.Image
- For people ages 18 to 64, the poverty rate reached 13.7 percent, the highest level since at least 1966.
- Poverty rose most in 2010 for blacks and Hispanics. The poverty rate of blacks rose to 27.4 percent in 2010, up 1.6 percentage points (from 25.8 percent in 2009). For Hispanics, the poverty rate rose to 26.6 percent, up 1.3 points (from 25.6 percent). Poverty for non-Hispanic whites rose by 0.5 percentage points, to 9.9 percent.
- Suburban poverty rates reached their highest point since at least 1967. Some 11.8 percent of people living in suburbs were poor in 2010.
| APPENDIX TABLE 1: Poverty Worst in Decades by Several Measures | ||
| Worst... | In 2010 | |
| Share of overall population in poverty | Since 1993 | 15.1% |
| Number of people in poverty | On record* | 46.2 million |
| Share of people below half of the poverty line | On record* | 6.7% |
| Share of poor people below half of the poverty line | On record* | 44.3% |
| Share of children in poverty | Since 1993 | 22.0% |
| Share of adults aged 18 to 64 in poverty | Since 1966 | 13.7% |
| Share of people living in suburbs in poverty | Since 1967 | 11.8% |
| * Data on the number of people in poverty are available from 1959. Data on the share of people below half of the poverty line are available from 1975. These figures use the official Census Bureau definition of poverty — which does not count non-cash benefits and tax credits such as the EITC, a number of which were created or expanded over the period from the 1960s to the present. Under alternative poverty measures that include such benefits and that analysts generally regard as superior measures of poverty, such as a revised measure of poverty proposed by a National Academy of Sciences panel in the mid-1990s, many of the 2010 figures shown here likely would not represent such long-term highs. Data using an NAS-type measure of poverty are not yet available for 2010, however, and are available for past years only on a limited basis. Source: U.S. Census Bureau | ||
| APPENDIX TABLE 2: Key Changes in Poverty, Income and Health Insurance | ||
| 2010 | Change from 2009 to 2010 | |
| Number Poor (millions of people) | 46.2 million | + 2.6 million* |
| Poverty Rate (percentage points) | 15.1% | + 0.8 pts* |
| Poverty Rate for Children (percentage points) | 22.0% | + 1.3 pts* |
| Real Median Household Income | $49,445 | - $1,154* |
| Real Median Income of Non-Elderly Households | $55,276 | - $1,466* |
| Number of Americans without Health Insurance (millions of people) | 49.9 million | + 0.9 million* |
| Percentage of Americans without Health Insurance (percentage points) | 16.3% | + 0.2 pts |
| Percentage of Children without Health Insurance (percentage points) | 9.8% | + 0.2 pts |
| * Denotes statistically significant change Source: U.S. Census Bureau | ||
End Notes
[1] Fully comparable data on health insurance are available back to 1999. Census has earlier data back to 1987 but cautions users that the earlier series is not fully comparable and likely understates the number of people with some forms of insurance. If fully consistent data were available from 1987 onward, they would show an even larger increase in people with no health insurance.
[2] The poverty rate increased significantly in 2001-2004, 2008, 2009, and 2010. (It edged upward in 2007, and downward in 2005, but those changes were not statistically significant.) The poverty rate fell by a statistically significant amount in only one year in this period, 2006.
[3] Hannah Shaw and Chad Stone, "Tax Data Show Richest 1 Percent Took A Hit In 2008, But Income Remained Highly Concentrated At The Top," Center on Budget and Policy Priorities, October 21, 2010, https://www.cbpp.org/sites/default/files/atoms/files/10-21-10inc.pdf.
[4] Arloc Sherman, "Safety Net Effective at Fighting Poverty But Has Weakened for the Very Poorest," Center on Budget and Policy Priorities, July 6, 2009, https://www.cbpp.org/sites/default/files/atoms/files/7-6-09pov.pdf.
[5] Yonatan Ben-Shalom, Robert Moffitt, and John Karl Scholz, "An Assessment of the Effectiveness of Anti-Poverty Programs in the United States," available at http://www.irp.wisc.edu/publications/dps/pdfs/dp139211.pdf. See also Arloc Sherman, "Public Programs Keep Millions Out of Poverty, New Study Shows," Off the Charts blog, May 18, 2011, http://www.offthechartsblog.org/public-programs-keep-millions-out-of-poverty-new-study-shows .
[6] Erica Williams, Michael Leachman, and Nicholas Johnson, "State Budget Cuts in The New Fiscal Year Are Unnecessarily Harmful," Center on Budget and Policy Priorities, updated July 28, 2011, https://www.cbpp.org/sites/default/files/atoms/files/7-26-11sfp.pdf; Liz Schott and LaDonna Pavetti, "Many States Cutting TANF Benefits Harshly Despite High Unemployment and Unprecedented Need," Center on Budget and Policy Priorities, May 19, 2011, https://www.cbpp.org/sites/default/files/atoms/files/5-19-11tanf.pdf.
More from the Authors

Areas of Expertise

Areas of Expertise