Making Sense of Next Week’s Poverty Data
Here are five points to keep in mind regarding the official poverty figures for 2010, which the Census Bureau will release on September 13:
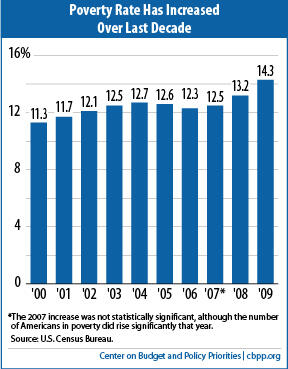
- Poverty may well increase. Key bellwethers of poverty, such as long-term unemployment, worsened from 2009 to 2010, so the poverty rate may worsen as well. Moreover, after recessions, increases in poverty typically persist longer than increases in unemployment do — in each of the previous three recessions, the poverty rate did not begin to fall until a year after the annual unemployment rate began to decline. Poverty is unlikely, however, to have risen as steeply in 2010 as it did in 2009, when it climbed from 13.2 percent to 14.3 percent in response to widespread job losses.
Poverty has already risen for most of the last last ten years (see graph). Over the last economic expansion — from 2001 through 2007 — the poverty rate actually increased (from 11.7 percent in the recession year of 2001 to 12.5 percent in the peak recovery year of 2007), an unprecedented development. As a result, the nation entered the current economic downturn with poverty already at an elevated level. - "Deep poverty" could hit a record high. The Census Bureau will also release figures on the number and percentage of people living below half of the poverty line (that is, with incomes below about $11,000 a year for a family of four). The previous record high deep-poverty rate was 6.3 percent in 2009, which means that about one in every 16 Americans lived in deep poverty that year. If this percentage hits 6.4 percent or higher in 2010, it will mark the highest level on record, with data going back to 1975.
- Looking ahead, poverty seems unlikely to improve in 2011, and there is significant risk it will remain high for some time. As noted, after the previous three recessions, the poverty rate didn't begin declining until a year after the annual unemployment rate started to fall. If this pattern holds, poverty will not improve in 2011, given the failure of the unemployment rate to decline in 2010. Moreover, the economy continues to struggle; GDP grew by less than 1 percent in the first half of 2011.
- Exacerbating these problems, state and federal governments are retrenching and thereby further slowing economic growth. State and local governments are instituting substantial cutbacks, which mainstream economists agree is placing a drag on growth. At the federal level, several key measures enacted in response to the recession are scheduled to expire soon: federal extended unemployment insurance benefits and the reduction in payroll taxes both expire on December 31. Reductions also are coming in a range of federal programs in order to comply with the new discretionary spending caps enacted last month in the Budget Control Act.Image
A rise in poverty in 2010 would indicate a need for more government action on a temporary basis, not less. The economy has been growing since mid-2009, but barely enough to generate the jobs needed to keep pace with normal population growth. Growth has been nowhere near strong enough to generate the jobs needed to noticeably reduce elevated rates of unemployment and poverty. Robust safety nets — much like jobs — not only reduce hardship in a weak economy but also help the economy by shoring up unusually weak consumer demand. - Government assistance — both ongoing programs like unemployment insurance and SNAP (formerly called food stamps) and temporary increases in these and other programs enacted in the 2009 Recovery Act — kept poverty from climbing much higher . Last year's Census data showed that unemployment insurance benefits kept 3.3 million people above the poverty line in 2009, while SNAP benefits kept 3.6 million people above poverty. The Census Bureau is likely to release updated data on these matters on Tuesday.
Alternative measures of poverty that analysts generally favor and that the Census Bureau will issue later this year will give a fuller picture of the impact of government assistance on poverty. While the official poverty measure considers only families' pre-tax cash income, the Census Bureau also produces more comprehensive poverty measures that include cash-like assistance such as SNAP and housing assistance, and subtract income and payroll taxes and medical and work expenses. (The alternative measures also use a modernized poverty line.) Many experts regard the alternative measures as better indicators of poverty because they better reflect the role of public benefit programs and taxes on poverty and give a fuller picture of the income available to a family.
The increase in poverty in 2010 may be modestly less under these alternative measures than under the official measure. A main reason is that the alternative, more comprehensive measures count SNAP benefits as income, and SNAP enrollment and SNAP benefit payments increased in 2010 in response to continuing joblessness.
Topics:
More from the Authors

Areas of Expertise
Receive the latest news and reports from the Center