Misunderstandings Regarding State Debt, Pensions, and Retiree Health Costs Create Unnecessary Alarm
Misconceptions Also Divert Attention from Needed Structural Reforms
Summary
A spate of recent articles regarding the fiscal situation of states and localities have lumped together their current fiscal problems, stemming largely from the recession, with longer-term issues relating to debt, pension obligations, and retiree health costs, to create the mistaken impression that drastic and immediate measures are needed to avoid an imminent fiscal meltdown.
The large operating deficits that most states are projecting for the 2012 fiscal year, which they have to close before the fiscal year begins (on July 1 in most states), are caused largely by the weak economy. State revenues have stabilized after record losses but remain 12 percent below pre-recession levels, and localities also are experiencing diminished revenues. At the same time that revenues have declined, the need for public services has increased due to the rise in poverty and unemployment. Over the past three years, states and localities have used a combination of reserve funds and federal stimulus funds, along with budget cuts and tax increases, to close these recession-induced deficits. While these deficits have caused severe problems and states and localities are struggling to maintain needed services, this is a cyclical problem that ultimately will ease as the economy recovers.
Unlike the projected operating deficits for fiscal year 2012, which require near-term solutions to meet states’ and localities’ balanced-budget requirements, longer-term issues related to bond indebtedness, pension obligations, and retiree health insurance — discussed more fully below — can be addressed over the next several decades. It is not appropriate to add these longer-term costs to projected operating deficits. Nor should the size and implications of these longer-term costs be exaggerated, as some recent discussions have done. Such mistakes can lead to inappropriate policy prescriptions.
Bond Indebtedness
Some observers claim that states and localities have run up huge bond indebtedness, in part to finance operating costs, and that there is a high risk that a number of local governments will default on their bonds. Both claims are greatly exaggerated.
- States and localities have issued bonds almost exclusively to fund infrastructure projects, not finance operating costs, and while the amount of outstanding debt has increased slightly over the last decade it remains within historical parameters. Recently, the Build America Bond provisions of the Recovery Act encouraged borrowing for infrastructure building as a way to improve employment; these bonds can only be used to finance infrastructure.
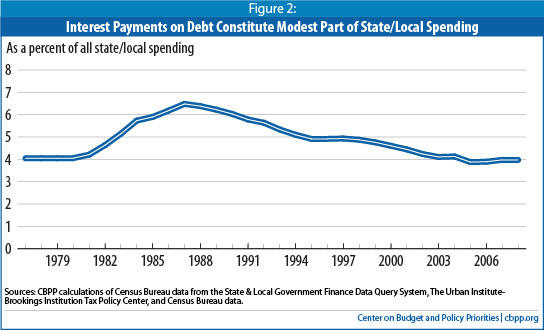
- Interest payments on state and local bonds generally absorb just 4 to 5 percent of current expenditures — no more than they did in the late 1970s.
- Municipal bond defaults have been extremely rare; the three rating agencies calculate the default rate at less than one-third of 1 percent .[1] Between 1970 and 2009, only four defaults were from cities or counties. Most defaults are on non-general obligation bonds to finance the construction of housing or hospitals and reflect problems with those individual projects; they provide no indication of the fiscal health of local governments.
- While some have compared the state and local bond market to the mortgage market before the bubble burst, the circumstances are very different. There is no bubble in state and local bonds, nor are there exotic securities that hide the underlying value of the asset against which bonds are being issued (as was the case with subprime mortgage bonds). Most experts in state and local finance do not expect a major wave of defaults. For example, a Barclays Capital December 2010 report states, “Despite frequent media speculation to the contrary, we do not expect the level of defaults in the U.S. public finance market to spiral higher or even approach those in the private sector.”
Pension Obligations
Some observers claim that states and localities have $3 trillion in unfunded pension liabilities and that pension obligations are unmanageable, may cause localities to declare bankruptcy, and are a reason to enact a federal law allowing states to declare bankruptcy. Some also are calling for a federal law to force states and localities to change the way they calculate their pension liabilities (and possibly to change the way they fund those liabilities as well). Such claims overstate the fiscal problem, fail to acknowledge that severe problems are concentrated in a small number of states, and often promote extreme actions rather than more appropriate solutions.
- State and local shortfalls in funding pensions for future retirees have gradually emerged over the last decade principally because of the two most recent recessions, which reduced the value of assets in those funds and made it difficult for some jurisdictions to find sufficient revenues to make required deposits into the trust funds. Before these two recessions, state and local pensions were, in the aggregate, funded at 100 percent of future liabilities.
- A debate has begun over what assumptions public pension plans should use for the “discount rate,” which is the interest rate used to translate future benefit obligations into today’s dollars. The discount rate assumption affects the stated future liabilities and may affect the required annual contributions. The oft-cited $3 trillion estimate of unfunded liabilities calculates liabilities using what is known as the “riskless rate,” because the pension obligations themselves are guaranteed and virtually riskless to the recipients. In contrast, standard analyses based on accepted state and local accounting rules, which calculate liabilities using the historical return on plans’ assets, put the unfunded liability at about a quarter of that amount, a more manageable (although still troubling) $700 billion.
- Economists generally support use of the riskless rate in valuing state and local pension liabilities because the constitutions and laws of most states prevent major changes in pension promises to current employees or retirees; they argue that definite promises should be valued as if invested in financial instruments with a guaranteed rate of return. However, state and local pension funds historically have invested in a diversified market basket of private securities and have received average rates of return much higher than the riskless rate. And economists generally are not arguing that the investment practices of state and local pension funds should change.
- A key point to understand is that the two issues of how states and localities should value their pension liabilities and how much they should contribute to meet their pension obligations are not the same. The $3 trillion estimate of unfunded liabilities does not mean that states and localities should have to contribute that amount to their pension funds, since the funds very likely will earn higher rates of return over time than the Treasury bond rate, which will result in pension fund balances adequate to meet future obligations without adding the full $3 trillion to the funds. In fact, two of the leading economists who advocate valuing state pension fund assets at the riskless rate have observed, “…the question of optimal funding levels…is entirely separate from the valuation question.” [2] The required contributions to state and local pension funds should reflect not just on an assessment of liabilities based on a riskless rate of return, but also the expected rates of return on the funds’ investments, as well as other practical considerations. As a result, it is mistaken to portray the current pension fund shortfall as an unfunded liability so massive that it will lead to bankruptcy or other such consequences.
- States and localities devote an average of 3.8 percent of their operating budgets to pension funding. [3] In most states, a modest increase in funding and/or sensible changes to pension eligibility and benefits should be sufficient to remedy underfunding. (The $700 billion figure implies an increase on average from 3.8 percent of budgets to 5 percent of budgets, if no other changes are made to reduce pension costs. [4]) However, in some states that have grossly underfunded their pensions in past years and/or granted retroactive benefits without funding them — Illinois, New Jersey, Pennsylvania, Colorado, Kentucky, Kansas, and California, for example — additional measures are very likely to be necessary.
- States and localities have managed to build up their pension trust funds in the past without outside intervention. They began pre-funding their pension plans in the 1970s, and between 1980 and 2007 accumulated more than $3 trillion in assets. There is reason to assume that they can and will do so again, once revenues and markets fully recover.
- States and localities have the next 30 years in which to remedy any pension shortfalls. As Alicia Munnell, an expert on these matters who directs the Center for Retirement Research at Boston College, has explained, “even after the worst market crash in decades, state and local plans do not face an immediate liquidity crisis; most plans will be able to cover benefit payments for the next 15-20 years.” [5] States and localities do not need to increase contributions immediately, and generally should not do so while the economy is still weak and they are struggling to provide basic services.
Retiree Health Insurance
Observers claiming that states and localities are in dire crisis typically add to unfunded pension liabilities about $500 billion in unfunded promises to provide state and local retirees with continued health coverage. These promises are of a substantially different nature than pensions, however, so it is inappropriate to simply add the two together.
- While pension promises are legally binding, backed by explicit state constitutional guarantees in some states and protected by case law in others, retiree health benefits generally are not. States and localities generally are free to change any provisions of the plans or terminate them entirely.
- States’ retiree health benefit plans differ widely. For example, 14 states pay the entire premium for retirees participating in the health plan, while 14 other states require retirees to pay the entire premium. States clearly have choices in the provision of retiree health benefits.
- With health care costs projected to continue to grow faster than GDP and faster than state and local revenues, it is highly likely that current provisions for retiree health insurance will be scaled back. Many states are likely to decide that their plans are unaffordable.
- This would be a good time for states and localities offering the more generous plans to decide whether they want to maintain and fund these liabilities, or whether they want to substantially reduce their liabilities by changing the provisions of their plans.
Given the different origins, scope, and potential solutions to problems in each of these areas, calls for a “global” solution — such as recent proposals to allow states to declare bankruptcy [6] or to limit their ability to issue tax-exempt bonds unless they estimate pension liabilities using a riskless discount rate — make little sense in the real world of state and local finances.[7] Indeed, some proposed solutions could worsen states’ long-term fiscal picture by undermining their ability to invest in infrastructure and meet their residents’ needs for education, health care, and human services. What are needed are targeted solutions that are appropriate to each state and to the nature of its fiscal problems.
State Structural Deficits
Moreover, the confusion between short-term cyclical deficits and debt, pensions, and retiree health insurance — and the overstatement of the magnitude of the latter set of problems — draw attention away from the need to modernize state and local budget and revenue systems and address structural problems that have built up over time in these systems.
States suffer from “structural deficits,” or the failure of revenues to grow as quickly as the cost of services during healthy economic times; this makes it difficult for states to continue meeting their responsibilities each year. Structural deficits stem largely from out-of-date tax systems, coupled with costs that rise faster than the economy in areas such as health care. Fixing these structural problems would help states and localities balance their operating budgets without resort to one-time measures or gimmicks. It would also help states rebuild their rainy day funds before the next recession and meet critical needs for infrastructure investment and adequate funding of pension obligations. It is far more constructive to focus on fixing these basics of state and local finance than to proclaim a crisis based on exaggerations of imminent threats.
Projected Operating Deficits
Most states and localities have experienced unprecedented projected operating deficits — which their balanced-budget rules require them to close — in this recession and its aftermath. State revenues are 12 percent below pre-recession levels, and localities also are experiencing diminished revenues. There simply are few good choices for meeting state and local balanced-budget requirements during an economic downturn this long and this deep.
The unemployment rate is close to a post-World War II high and remains stubbornly elevated 15 months after the official end of the recession. There were 7.4 million fewer people employed in December 2010 than there were prior to the recession, and many workers who are employed have found only part-time work or work at lower wages. [8] When residents lose jobs and incomes they pay less in state income taxes, and the drop in consumption reduces state and local sales and excise tax revenues. The weak housing market also is placing downward pressure on local property taxes and sales taxes.
Yet the need for public services does not decline during recessions. To the contrary, increases in unemployment and poverty have swollen Medicaid rolls and expanded the need for social services, community college education, and job training, among other public services.
Most states and localities are required to balance their operating budgets, even when the economy is weak. Closing operating deficits requires immediate action: most states have to enact balanced budgets, and gaps that develop during the year usually have to be closed within that year or biennium. In this recession and its aftermath, the gaps between revenues and needed expenditures have been particularly large because of the unprecedented drops in revenue. Although states entered the recession with record levels of “rainy day funds” and reserves, and the federal government has provided fiscal assistance, states out of necessity have made rather massive cuts in services and raised additional revenues. State general fund spending in 2011 will be 6 percent lower than it was in 2008, without adjusting for inflation, according to data from the National Association of State Budget Officers.
In a few well-publicized instances, states or localities have closed portions of their deficits in ways that will harm their future financial health. For example, some states and cities have sold income-producing assets such as toll roads, lotteries, or parking meters, and a few have sold buildings that they then had to lease back at more expensive rates. While in nearly all cases the state or locality would have been better off in the long run simply raising additional revenues, these deals represent a small fraction of all deficit-closing actions.
States have closed the vast majority of deficits by drawing on rainy day funds and reserves, using federal stimulus funds, cutting expenditures, and raising new revenues. Only a few states — particularly Illinois — have failed to close their deficits responsibly in recent years, instead using a combination of payment delays, borrowing, and other gimmicks. (The fault in Illinois has been largely political gridlock rather than a lack of reasonable options, as explained below.)
Should States Be Allowed to Declare Bankruptcy?
Various pundits have suggested enacting federal legislation that would allow states to declare bankruptcy, potentially enabling them to default on their bonds, pay their vendors less than they are owed, and abrogate or modify union contracts. Such a provision could do considerable damage, and the necessity for it has not been proven.
States have a strong track record of repaying their bonds. In most states, bonds are considered to have the first call on revenues; debt service will be paid before any public services are funded. (In California, education has the first call on revenues because of the provisions of a ballot initiative, but bonds are right behind.)
There are no modern instances of a state defaulting on its general obligation debt. One has to reach back to the period before and during the Civil War, when several states defaulted, or the single state that defaulted during the Great Depression (Arkansas), to find examples.
It would be unwise to encourage states to abrogate their responsibilities by enacting a bankruptcy statute. States have adequate tools and means to meet their obligations. The potential for bankruptcy would just increase the political difficulty of using these other tools to balance their budgets, delaying the enactment of appropriate solutions. In addition, it could push up the cost of borrowing for all states, undermining efforts to invest in infrastructure.
The severity and consequences of these operating deficits should not be minimized. Throughout the country, residents are losing services on which they depend — sometimes on which their very life depends, as in the refusal of Arizona’s Medicaid program to fund organ transplants. But these deficits are cyclical and temporary; they will diminish as the economy improves. [9] They should not be confused with the longer-term structural budget problems that a number of states have. [10]
State and Local Debt
Almost all state and local debt is long-term debt incurred to pay for capital expenditures, not to cover operating expenses. (Unlike the federal government, states and localities maintain separate operating and capital budgets.) States issue long-term debt — various types of bonds — primarily for infrastructure projects such as roads and bridges, schools, water systems, and hospitals. States typically prohibit the use of bond proceeds for funding operating expenses,[11] although that has occurred in a few instances, most notably in Louisiana in 1988 and Connecticut in 1991. [12] One recent example occurred in Connecticut, which in 2009 sold a bond to cover its operating budget, with a seven-year repayment schedule.
A small number of states issue short-term debt instruments, known as revenue anticipation notes, which they use to match the timing of their revenue collections to the timing of the expenditures in their operating budget. This type of debt must be repaid during the same fiscal year as the borrowing. California, a major user of this type of debt, made headlines in 2008 by saying it could not find buyers for its debt and asking the federal government for financing. Ultimately, however, California was able to sell the bonds without federal assistance, as was Massachusetts when it faced a similar situation.
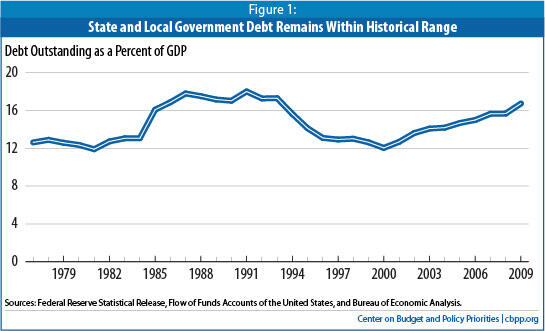
In the vast majority of states, debt levels have risen only modestly during this downturn, largely as states took advantage of the federal Build America Bonds program (which expired at the end of December 2010) to encourage infrastructure development and thereby create jobs. Claims that state and local governments are using the new bonds to finance their operating budgets are incorrect, [13] since the bonds can only be used to finance infrastructure. [14] Claims that Build America Bonds have led to an explosion in outstanding state and local bond debt are incorrect as well, as outstanding debt remains within its historical range. In the second quarter of calendar year 2010, state and local government outstanding debt stood at 16.7 percent of GDP, up from a recent (and relatively brief) low of 12 percent in 2000 but similar to the average levels from the mid-1980s to the mid-1990s. [15] (See Figure 1.)
Some who claim there is a state debt crisis have likened states’ problems to those in Greece or other European countries. [16] There is no way directly to compare the state debt situation with a national government’s debt situation, but Greece’s situation was clearly far worse than the situation in the U.S. today. Greece’s total governmental debt stood at 115 percent of GDP at the end of 2009 and was projected to peak at 150 percent of GDP if countermeasures were not taken. [17]
It also should be noted that states and localities spend a modest 4 or 5 percent of their budgets on debt payments. [18] (See Figure 2.)
Other observers have suggested that the problem in some states isn’t the aggregate state and local debt, but rather debt issued by localities for specific projects. They worry that some states may have to “bail out” or assume their local government debt, which in turn would put pressure on state finances. Alternatively, they worry that many localities will repudiate their debt through bankruptcy or other means, undermining confidence in state and local bonds. (Localities can and occasionally do declare bankruptcy, but states cannot.)
One frequently cited instance is Harrisburg, Pennsylvania, where a trash-to-energy project using experimental technology for which the city had borrowed did not work out, resulting in higher debt service than the city could afford. The state provided extra financial support to the city in the fall of 2010 and is helping the city find options to work its way out of its problems. Another frequently cited example is a sewer project in Jefferson County, Alabama that ran into trouble relating to corruption and fraud, causing the price of the bonds issued for the project to drop precipitously.
Although there were consequences — employees were laid off, sewer rates increased, people responsible for the problem went to prison, and some Wall Street firms are being sued — and the county did technically default in 2008, actions have been taken to protect the bondholders, who will likely be paid.[19] [20]
Studies show that defaults on municipal bonds are rare. As the National League of Cities has pointed out, the annual default rate for municipal (local government) debt is a miniscule one-third of 1 percent across the three bond rating agencies. [21] Moreover, the large majority of defaults (74 percent in a Moody’s study and 80 percent in a Fitch study) were in the health care and housing sectors. Between 1970 and 2009, only four defaults were from bonds guaranteed by cities or counties; the remainder was from bonds based on the revenues from specific projects. Defaults in these non-general obligation bonds are not an indicator of state or local fiscal health.
A Barclays Capital December 2010 report states, “Despite frequent media speculation to the contrary, we do not expect the level of defaults in the U.S. public finance market to spiral higher or even approach those in the private sector. We hold this view in large part because of the steps taken thus far by the preponderance of municipalities and the control that public entities can exert over the expense and revenue portions of their balance sheets.”[22] Other financial advisers and the bond rating agencies [23] have issued similar statements. Finally, states and localities have many options, from raising taxes or fees to reducing spending, to make good on their bonds. As mentioned above, states and localities generally will pay their bondholders before paying nearly any other expenditure.
In sum, there is no bubble in state and local bonds. States and localities in aggregate have not overextended themselves with respect to their debt-financed capital spending. Indeed, many analysts decry the deteriorating state of infrastructure in this country and its negative effect on economic development.[24] For this reason, and to shore up the economy in the short run, the manageable uptick in outstanding state and local capital debt is entirely appropriate.
Pensions
Some who argue that states and localities are in a crisis claim that they have large amounts of “hidden” debt in the form of underfunded pension funds. A figure of $3 trillion in pension underfunding is sometimes cited; other estimates place the underfunding at levels as low as about $700 billion, or less than a quarter of the $3 trillion figure. While some pension funds are indeed underfunded, there are a number of misconceptions about the extent and depth of the problem — and about states’ ability to resolve pension funding issues over time without disrupting their ability to continue public services.
States and localities currently make annual contributions to their pension trust funds equaling an average of 3.8 percent of their general (operating) budgets. They began to make deposits to pre-fund their pension costs in the 1970s. Each year, they are supposed to deposit in a trust fund an amount that equals the present value of the future pensions their employees earned that year. (The present value is the amount that has to be invested today to grow to the desired amount in the year the employees are expected to retire.)
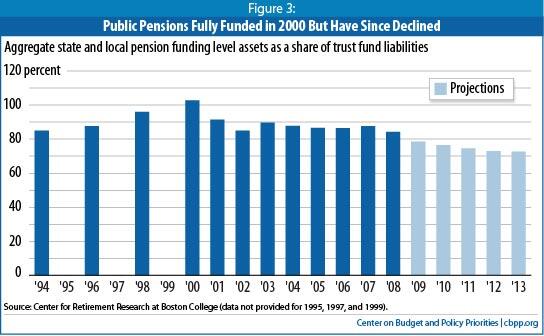
As of 2000, state and local pension obligations were fully funded on average, if obligations are discounted at 8 percent per year, which was the return on pension fund investments over the previous two decades. (See Figures 3 and 4.) Since then, however, the nation has experienced two recessions, during which some states and localities have reduced or skipped pension trust fund deposits to help balance their budgets. In addition, the recessions have caused significant investment losses. By 2008, state and local pensions in aggregate were funded at 85 percent of their future liabilities; the other 15 percent is considered to be the “unfunded liability.” The Center for Retirement Research at Boston College projects that, in the aggregate, state and local pensions were funded in 2010 at 77 percent of their future liabilities, a ratio projected to decline to 73 percent by 2013.[25]
A drop to funding in the 70 percent range is a significant problem, although not an imminent crisis. Many experts argue that 80 percent funding is sufficient for public pensions because states and localities, as ongoing entities, can use tax revenues to make up a shortfall if necessary. [26] A private company, in contrast, can go out of business, at which point the federal Pension Benefit Guarantee Corporation (PBGC) pays the company’s employees their accrued benefits out of a combination of the assets the company accumulated before it went out of business and the insurance premiums the PBGC collects from private-sector employers with pension plans. [27] (Federal law generally requires private companies to be 100 percent funded so the federal government does not have to make up any shortfall. [28])
Some states — such as Illinois, New Jersey, and Pennsylvania (and to a somewhat lesser extent Colorado, Kentucky, Kansas, and California) — have skipped or reduced deposits to trust funds and/or expanded future pension benefits without providing the commensurate funding. Over time, to reach adequate funding, these states may have to institute changes more difficult than the potential solutions discussed below. These states, however, are not representative of states in general.
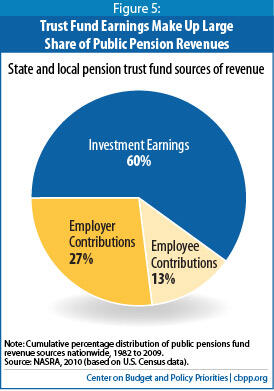
The issue of whether states’ discount-rate assumptions are reasonable is more complicated. The “discount rate” is the interest rate used to translate future benefit obligations into today’s dollars. Discount rates are important, since 60 percent of pension trust fund revenues come from trust fund earnings (see Figure 5), and discount rates help determine how much money a state should put into the fund each year.
The alarming reports that pension funds are about to run dry or that unfunded pension liabilities number in the trillions of dollars generally rely on these more conservative assumptions about the appropriate discount rate. For example, a recent Washington Post editorial said that “Public-employee pension funds are notorious for understating their liabilities through the use of vague projections and rosy investment return assumptions” and took note of a proposal by three members of Congress — Paul Ryan, Darrell Issa, and Devin Nunes — that would force pension funds to calculate their liabilities using a riskless discount rate. [29]
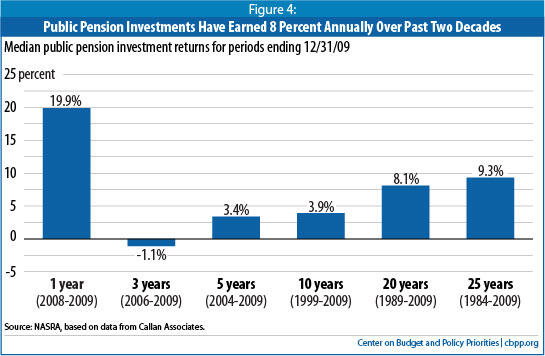
While economists generally support use of a riskless rate in valuing state and local pension liabilities, they do not generally argue that the investment practices of state and local pension funds should change. State and local pension funds historically have invested in a market basket of private securities and have received rates of return much higher than the riskless rate. As Figure 4 shows, the 8 percent discount rate that most funds now use reflects actual returns over the past 20 years.
Even if state and local pension liabilities were valued at the riskless rate, that would not mean that states and localities “owe” $3 trillion to their pension funds. The issue of how states and localities value their pension liabilities and the issue of how much they have to contribute to meet their pension obligations are not the same. The $3 trillion of unfunded liabilities is not equivalent to the amount that states and localities should contribute to their pension funds. It thus is mistaken to portray this as a huge liability that will lead to bankruptcy or other similarly dire consequences.
Indeed, Novy-Marx and Rauh, the leading economists advocating valuation at a riskless rate, have observed, “… the question of optimal funding levels … is entirely separate from the valuation question.” [30] The required contributions to state and local pension funds should take account of expected rates of return on their investments, as well as other practical considerations.
While it may make sense to reconsider whether the typical 8 percent discount rate is the right one going forward, simply basing annual state contribution amounts to pension funds on the return to riskless investments appears to go much farther than is necessary for a number of reasons:
- Pension funds invest for the long term, so a few years of below-average returns can be averaged out with years of higher returns. As noted, the 8 percent discount rate that most states assume reflects the experience of the trust funds over the last 20 years (including the 2008 stock market decline); median returns for the last 25 years were even higher, at 9.3 percent. While the rates of return on investments were much lower in the recent recession, it is generally assumed that they will rise in the future, even if they do not return to the very high rates of the late 1980s.
- A business may be sold or go out of business at any time, so it is important to keep its pension plan 100 percent funded for benefits earned to date.[31] Governments, in contrast, will be in continuing existence, so it makes sense to average or “smooth” expected investment returns over a long period. This also promotes intergenerational equity, enabling the state to contribute approximately the same amount for each cohort (assuming that it makes appropriate contributions each year).
- The stated concern of some that basing required contributions on actual rates of return will lead pension managers to put funds in risky investments is overblown. Pension funds have a long history and have been invested prudently except in rare situations. Most states have other effective barriers to overly risky investing in place (although these could be strengthened), including oversight boards, reporting requirements, and regular actuarial reviews.
- A discount rate that is too low would require a state to put money into the pension funds that it could be using instead to support public services, resupply reserve funds, invest in infrastructure, or return to taxpayers in the form of tax cuts.
- In addition, if the pension fund assumes a 4 or 5 percent discount rate and actually gets higher returns on its investments, funds will build up in the trust fund. When pension trusts have been overfunded in the past this has led to problems such as employee demands for increases in pension benefits that later proved unsustainable. Overfunding also has led jurisdictions to skip payments that they subsequently found difficult to resume because programs were funded or taxes were cut permanently by the amount of the skipped pension contribution. The 2008 GAO report noted experts that said: “… it can be politically unwise for a plan to be overfunded; that is, to have a funded ratio over 100 percent. The contributions made to funds with “excess” assets can become a target for lawmakers with other priorities or for those wishing to increase retiree benefits.” [32]
Nevertheless, improvements in pension plans’ policies clearly are needed. There are a number of ways that most states with unfunded liabilities can improve their pension funding without causing major disruptions in their ability to provide public services.
As noted, current employer contributions for public employee pensions average only 3.8 percent of state and local budgets, an amount that pales beside states’ largest expenses — education and health care. Pension contributions are smaller than the amounts spent on transportation, corrections, and many other services. If all states and localities were to fund their pensions based on the “riskless” rate, Boston College researchers calculate that they would have to contribute approximately 9 percent of their budgets, on average. (This calculation uses 5 percent as the riskless rate. [33]) A contribution amount this high would cut into states’ and localities’ ability to provide other public services; it arguably would not strike the appropriate balance between funding currently needed services and funding past pension liabilities.
If states and localities continue to use an 8 percent discount rate for calculating required contributions, a funding increase to 5 percent of their budgets would be required on average to fully fund their pensions. This level is not likely to be unduly burdensome after the economy recovers, and states could reduce it somewhat by adopting various pension reforms. (States should not begin to increase their contributions while the economy is still weak, because the budget cuts this move would require would further slow the economy.)
States that have significantly underfunded their pensions, such as California, Illinois, and New Jersey, would require higher contributions (7.3 percent, 8.7 percent, and 7.9 percent of their respective budgets), even using the standard 8 percent discount rate. These states will have to consider more significant changes to their pension plans to bring their required contributions down to a more reasonable level. [34]
More than 20 states have enacted changes to reduce pension costs in recent years, including raising the length of service and age requirements for receiving a pension and reducing the factor that determines the percent of salary that an employee receives as a pension payment for each year of service. It is difficult to defend a system where public employees can retire at age 55 with a pension after 25 or 30 years of service, particularly if their work is not physically arduous, while the age for receiving full Social Security benefits is set to increase to 67. While these types of changes generally can be applied only to newly hired employees, they will help with a pension plan’s longer-term funding. Another option that could have a more immediate effect would be to increase the contribution that employees make toward their pensions, as a number of states have done, particularly in places where employee contributions are particularly low.
Public-sector employees generally receive lower wages than their private-sector counterparts, and employee benefits such as pensions make up only part of the difference.[35] If pensions (and/or retiree health benefits, discussed below) are made less generous, current wages may have to increase so that the public sector can continue to attract high-quality employees. Given the difficulty that some jurisdictions have in funding deferred compensation, this may be a reasonable trade-off.
In addition, all states and localities need to ensure that their employee pension provisions do not permit abuses, such as the ability to inflate pay in the year or two before retirement in order to receive an outsized pension benefit. Reforms in this area are needed in a number of states. States also need to review their provisions for disability pensions to ensure that only employees who are appropriately qualified can retire on a disability pension. While these issues are not the major source of financial stress of pension systems, abuses are frequently publicized and undermine confidence in the administration and fairness of public employee pensions.
In short, there are significant issues with public pensions, but they do not amount to a crisis. In part, pensions’ funding status will improve as the economy and investment returns improve. Some states and localities already are taking actions to improve their pension funding; at an appropriate time when the economy is stronger, more states and localities can, if necessary, increase their pension trust fund contributions to put them on a path to funding their unfunded liabilities over the next few decades. A number of states also will need to institute various pension reforms. But for the reasons cited above, the evidence does not support the claim that states and localities are on the verge of bankruptcy because of massive unfunded pension liabilities.
Retiree Health Benefits
The final point typically made by those who claim that states and localities are in dire crisis concerns health insurance for retirees. Some jurisdictions have promised that their employees’ health insurance benefits will continue into retirement — in particular, that those benefits will bridge the gap between retirement and eligibility for Medicare at age 65. But, with few exceptions, states and localities have not set aside any funding to finance those benefits. In 2004, the GASB began requiring states and localities to assess their future liabilities for retiree health insurance, although it did not put forth any requirements for pre-funding those liabilities. [36] Most states continue to fund retiree health insurance benefits on a pay-as-you-go basis, from operating revenue. Estimates suggest that aggregate state and local unfunded liabilities for retiree health insurance are approximately $500 billion. [37]
It makes little sense to add this large number to state operating deficits, state infrastructure debt, or even to pension liabilities. Promises for retiree health insurance are quite different from any of those other liabilities:
- While pension promises are legally binding — backed by explicit state constitutional guarantees in some states and protected by case law in others — retiree health benefit promises generally are not. States and localities in many cases are free to change the provisions of the plans, the years of service or other eligibility rules, and the share of the insurance premium the retirees must pay as these elements pertain to current employees.
- While most state pension plans are roughly similar to one another, state retiree health plans differ much more widely. In 2006, 14 states provided only an implicit subsidy, allowing retirees to be a part of the state health insurance plan but requiring them to pay the full premium. [38] At the other end of the spectrum, 14 states paid retirees’ entire premium. [39] The remainder of the states fell in between these two poles. [40] All three groups include states from different regions, political tendencies, and degrees of unionization. States should have reasonable flexibility to modify retiree health provisions if necessary.
If health care costs continue to rise faster than GDP and faster than state revenues, as they are projected to do for the foreseeable future, it is likely that states that pay all or most of the premiums for their retirees will not be able to continue to do so without making significant cuts in public services or raising substantial additional revenues. For example, the Government Accountability Office projects that the cost of retiree health benefits is expected to increase at an annual rate of 6.7 percent between now and 2050. [41]
Whether states continue to finance retiree health benefits on a pay-as-you-go-basis or move to pre-fund some or all of those costs as they do for pensions, the reality of health care cost growth suggests that the status quo of benefit provisions is unlikely to prevail over time. [42] It is also worth noting that the recently enacted Affordable Care Act may lead to significant changes in health insurance markets and in health care cost growth. Unlike pension costs, which behave in predictable ways based on actuarial tables, the future cost of retiree health insurance is subject to various sources of uncertainty. This would be a propitious time for states and localities to rethink their retiree health benefit promises and decide whether it makes sense to modify these promises rather than pre-fund them. The important point is that states have the flexibility to modify their policies regarding retiree health benefits as needed in order to ensure that these benefits remain affordable.
Structural Deficits
As the previous sections of this report have explained, states and localities are not in imminent danger of financial collapse and there is no need for such changes as a new federal law allowing states to declare bankruptcy. States have many ways to meet their obligations through adjustments in taxes or budgets; they should not be encouraged to abrogate those responsibilities through bankruptcy. [43] Nor is it appropriate to force all states and localities to report pension liabilities using a “riskless” rate as a condition of issuing tax-exempt bonds, which would likely give a distorted view of how much funding states and localities have to save in order to pay future pensions. [44]
Most states, however, do face a set of fundamental problems in their revenue and budget structures that will continue once the economy recovers. These problems, often called “structural deficits,” make it difficult to fund the ongoing cost of public services year after year. Structural deficits occur when annual revenue growth, in the absence of legislated changes, lags behind economic growth and behind the annual growth in the cost of services.
In significant part, this is a problem of health care costs, which as discussed above are projected to grow much more rapidly than revenues over the foreseeable future. In addition, the cost to states and localities of K-12 education has grown faster than the economy over the past 20 years, rising from 3.58 percent of GDP in 1988 to 4.02 percent of GDP in 2008; it remains to be seen whether that trend will continue after the economy recovers. [45] And while efforts at improving efficiency in these and other areas of the budget are always appropriate, there are limited opportunities for states to reduce cost growth in either area.[46] Since education and health care expenditures account for more than half of state budgets and more than a third of local budgets, jurisdictions cannot balance their budgets year after year if these two spending areas are growing faster than the economy and revenues are growing slower than the economy. Yet that is the situation in most states, and it can lead to poor public finance practices even in good economic times, as policymakers often devise temporary solutions rather than fixing the underlying problems.
Most states’ revenue systems are in dire need of modernization; they have remained largely the same for the last 40, 50, or 60 years. But the world is very different than it was 60 years ago. The role of services in the economy has greatly increased, Internet commerce has come on to the scene, telecommunications and exotic forms of commerce have multiplied, and income has become far more concentrated among the wealthy, to mention just a few trends. State revenue systems have not kept up.
For example, few states adequately tax the sales of services on an equal basis with the sales of tangible goods. Similarly, most Internet sales go untaxed. And the majority of states focus their taxes on moderate- and middle-income residents; they fail to maintain progressive income tax systems that adequately tax the rapidly growing incomes of the top 1 percent or 5 percent of earners. In addition, states do large amounts of spending through their tax codes by giving tax breaks that are intended to accomplish policy purposes such as economic development, and provide large tax exemptions for the elderly and for retirement income regardless of the income of the taxpayer. Yet they rarely scrutinize this spending through the tax code on the same basis as on-budget spending. Together, these and other chronic problems cause revenue growth to lag behind economic growth. Fixing these problems for the long term should be high on states’ agenda.
In addition, most states need to overhaul the processes by which they enact budget and revenue changes. For example, there are no more than a handful of states in which budgets include accurate projections of revenues and expenditures, adjusted for expected cost inflation and utilization changes, for as much as four or five years into the future. Without such information, policymakers have no way of understanding the long-term budgetary impact of the changes they are making, especially when such changes are phased in over several years. Moving to accurate multi-year budgeting is one of the most important reforms that states can adopt.
Illinois is an extreme example of the implications of failure to fix these types of problems. It has a flat, low-rate income tax that does not adequately capture income growth, and income tax revenues thus routinely lag behind economic growth. The state relies heavily on a state and local sales tax that is almost exclusively applied to goods and excludes almost all services. It is among the states that exempt from state income tax the largest share of income received by elderly individuals, regardless of their income levels. Illinois also does a relatively poor job of scrutinizing its spending through the tax code. Its budget considers only the single upcoming fiscal year, and policymakers often have taken budget actions without full consideration of the longer-term implications.
Because Illinois is chronically short of the revenues it needs to cover its expenses, it has engaged in a number of poor fiscal practices over the years. It has postponed payments to vendors, failed to make adequate pension contributions or borrowed money to make the contributions, securitized or sold assets, and taken other dubious actions. As a result, it has had a particularly difficult time coping with revenue declines during this recession, with a fiscal year 2012 deficit projected to equal half of its general fund budget, and has developed an large overhang of longer-term debt and unfunded liabilities.
But it is important to remember that the root cause of Illinois’ problem is a revenue system in urgent need of modernization, one that cannot support the level of expenditures that the state has chosen. Proposals have repeatedly been made over the last 25 years to remedy many of these problems, but political gridlock has prevented solutions to Illinois’ well-known budget problems from being enacted. In January 2011 Illinois temporarily increased its personal and corporate income tax rates to close a portion of its budget gap. But it still plans to borrow to cover its pension contributions and has not addressed the fundamental problems in its revenue system that are the principal cause of its large structural deficit.
Most states are not in as dire shape as Illinois. Nevertheless, if states fail to reduce their structural deficits and improve their budget processes, it will be more difficult for them both to maintain needed services and to prepare for the next cyclical downturn by accumulating adequate reserves. Nor will they have the funds to fix the problems that have been identified in the funding of public pensions and other areas.
End Notes
[1] Chris Hoene, “Crying Wolf about Municipal Defaults,” National League of Cities blog, December 22, 2010, http://citiesspeak.org.
[2] Robert Novy-Marx and Joshua Rauh, “Public Pension Promises: How Big Are They and What Are They Worth?” Journal of Finance, forthcoming (posted October 8, 2010 on Social Science Research Network), p. 5.
[3] Data are for 2008, the most recent year available from Census.
[4] Alicia H. Munnell, Jean-Pierre Aubry, and Laura Quinby, The Impact of Public Pensions on State and Local Budgets, Center for Retirement Research at Boston College, October 2010.
[5] Alicia H. Munnell, Jean-Pierre Aubry, and Laura Quinby, “Public Pension Funding in Practice,” NBER Working Paper 16442, October 2010.
[6] See, for example, David Skeel, “Give States a Way to Go Bankrupt,” The Weekly Standard, November 29, 2010, http://www.weeklystandard.com/articles/give-states-way-go-bankrupt_518378.html and Grover G. Norquist and Patrick Gleason, “Let States Go Bankrupt,” Politico, December 24, 2010.
[7] A bill proposed by House of Representative members Paul Ryan, Darrell Issa, and Devin Nunes (H.R. 6484 in the 111th Congress) would require states and localities to report pension liabilities to the federal government using U.S. Treasury Bond rates to discount liabilities as a condition of issuing tax-exempt bonds.
[8] Seasonally adjusted employment of 139.206 million in December, 2010 compared to 146.584 million in November, 2007. Bureau of Labor Statistics, “Labor Force Statistics from the Current Population Survey,” extracted January 7, 2011.
[9] The end of the federal stimulus funding at the end of June 2011 and the pending expiration of some temporary state tax increases enacted during the recession mean that revenue growth would have to be extraordinarily strong over the next year or two to eliminate state deficits; this is unlikely unless the economy grows much more strongly than is currently projected. An unwinding of the housing crisis — an end to elevated levels of foreclosures and resumed growth in the prices of housing and commercial real estate — will likely be necessary to fully eliminate local deficits.
[10] The depth and persistence of the economic slump, and thus the deficits in this recession, raise the issue of whether it makes sense to leave states and localities with the problem of balancing their operating budgets when revenues decline and service needs increase. It is worth considering a permanent federal countercyclical facility that ties additional aid to the states to economic conditions, since it is appropriate for the federal government to deficit-spend to stimulate the economy during recessions. Aid to state and local governments is an important macro-economic tool for the federal government: it can help prevent states and localities from creating a fiscal drag as they cut spending and raise taxes to meet their balanced-budget requirements.
[11] According to the National Conference of State Legislatures, “It is extremely rare for a state government to borrow long-term funds to cover operating expenses.” National Conference of State Legislatures, State Balanced Budget Requirements, updated April 12, 1999 and reviewed December 3, 2003, http://www.ncsl.org/default.aspx?tabid=12660.
[12] National Conference of State Legislatures, “NCSL Fiscal Brief: State Balanced Budget Provisions,” October 2010, http://www.ncsl.org/default.aspx?tabid=12651.
[13] A statement that appeared to originate in a Reuters blog post, “the lack of a BAB program would make it harder for states to borrow to cover a $140 billion budgetary shortfall next year, as estimated by the Center for Budget and Policy Priorities,” conflates capital borrowing and operating deficits but nevertheless was repeated in a number of other places. See James Pethokoukis, “Secret GOP Plan: Push States to Declare Bankruptcy and Smash Unions,” http://blogs.reuters.com/james-pethokoukis/2010/12/07/secret-gop-plan-push-states-to-declare-bankruptcy-and-smash-unions/ .
[14] The Recovery Act created a new kind of taxable state and local bond, called Build America Bonds, because policymakers thought the existing provisions under which states and localities issued bonds for infrastructure were not encouraging a sufficient amount of infrastructure building. It is long-standing policy that interest on state and local bonds is exempt from federal taxation. This has provided a subsidy for state and local infrastructure development because investors are willing to accept a lower interest rate if they don’t have to pay federal tax on the income. Public finance experts have questioned the efficacy of the subsidy, however, because the spread between the interest rate on tax-exempt state and local bonds and comparable taxable corporate bonds has at times not been as great as the tax exemption implies it should be — which suggests that investors, rather than states and localities, have been reaping outsized benefits.
Build America Bonds ensured that states and localities received the full subsidy that theoretically would accrue if a high-income taxpayer purchased the bond by making the bonds taxable to the investor but giving states and localities a direct 35 percent federal subsidy for interest costs. The idea was to make the bonds more attractive to institutional investors and other purchasers or accounts that could not benefit from the tax exemption. The Build America Bonds could be issued only by governments and only for capital expenses, not operating expenses.
[15] The 16.7 percent figure includes all forms of debt, both long-term and short-term, whether or not backed by the full faith and credit of the jurisdiction. The Census definition of debt, used here, is: “All long-term credit obligations of the government and its agencies whether backed by the governments' full faith and credit or nonguaranteed, and all interest-bearing short-term credit obligations. Includes judgments, mortgages, and revenue bonds, as well as general obligations bonds, notes, and interest-bearing warrants. Excludes noninterest-bearing short-term obligations, interfund obligation, amounts owed in a trust or agency capacity, advances and contingent loans from other governments, and rights of individuals to benefits from government-administered employee retirement funds.”
[16] See, for example, Michael Cooper and Mary Williams Walsh, “Mounting Debts by States Stoke Fears of Crisis,” The New York Times, December 4, 2010.
[17] International Monetary Fund, Frequently Asked Questions: Greece, http://www.imf.org/external/np/exr/faq/greecefaqs.htm#q1. For an article cited in many U.S. news-gathering sites likening state and local problems to Europe’s, see Andrew Beatty, “Fears Grow of Euro-style Debt Crisis in U.S.,” Agence France Press, http://news.yahoo.com/s/afp/20101221/ts_alt_afp/useconomydeficitlocal/print . Greece’s is far higher than the total governmental debt in the U.S. — state, local, and federal — which stood at 83 percent of GDP at the end of 2009.
[18] There are two data sets on debt, one from Census and one from the Federal Reserve. Similarly, there are two sets of data on state and local expenditures, one from Census and one from the Bureau of Economic Analysis Income and Product Accounts. In 2008, interest on debt was 4.0 percent of state and local spending using Census data for both interest on debt and total expenditures, and 5.4 percent of current expenditures using the Federal Reserve Bank Flow of Funds Data for interest and total expenditures from the Bureau of Economic Analysis.
[19] A Moody’s analyst said: “The appointment of the receiver is a credit positive for the county, as it provides a mechanism for additional revenue through rate growth on the sewer system, increasing the likelihood for full repayment on the $516 million in unpaid principal to date.” Shelly Sigo, “Moody’s Sees JeffCo Sewer Receiver as Positive Move,” The Bond Buyer, September 28, 2010.
[20] The city of Vallejo, California, did declare bankruptcy in May 2008, citing unsustainable labor contracts and dwindling tax revenue. Caught in the housing crisis, its median real estate prices fell 67 percent between 2006 and 2008, and revenues plummeted. While the city plans to suspend debt service payments for three years, the debt does not appear to be the precipitating cause of the bankruptcy. Randall Jensen, “Vallejo, Calif., Officials to Weigh Chap. 9 Recovery Plan,” The Bond Buyer, November 30, 2010.
[21] Chris Hoene, “Crying Wolf about Municipal Defaults,” National League of Cities blog, December 22, 2010, http://citiesspeak.org.
[22] Barclays Capital, Municipal Research, Taxable Municipal Market Commentary, 2011 Outlook, December 3, 2010.
[23] Some have dismissed the opinions of the rating agencies by noting that they failed to predict the bursting of the housing bubble. But the two cases are very different. The slicing and dicing of mortgages into exotic securities sold through brokers was a relatively new phenomenon, and there was no way to judge the underlying value of those securities. By contrast, rating agencies and other players in the state and local bond market have been following the municipal bond market for many years and have experience in detecting problems. Moreover, while there was a problem in knowing the underlying quality of the mortgages that made up the exotic securities, the basic financial information about states and localities is available.
[24] Estimates suggest that a sustained 1 percent increase in public capital growth translates into a 0.6 percentage-point increase in the growth rate of private-sector GDP. For discussion, see Appendix G of Investing in America’s Economy: A Budget Blueprint for Economic Recovery and Fiscal Responsibility, jointly produced by the Economic Policy Institute, Demos, and The Century Foundation, November 29, 2010, http://epi.3cdn.net/b3c2500a206a5ea13a_n7m6vzdpr.pdf.
[25] Alicia H. Munnell, Jean-Pierre Aubry, and Laura Quinby, The Funding of State and Local Pensions: 2009-2013, Center for Retirement Research at Boston College, April 2010.
[26] U.S. Government Accountability Office, “State and Local Government Retiree Benefits: Current Funded Status of Pension and Health Benefits,” GAO-08-223. The GAO report noted on p. 15, “Many experts and officials to whom we spoke consider a funded ratio of 80 percent to be sufficient for public plans for a couple of reasons. First, it is unlikely that public entities will go bankrupt as can happen with private sector employers, and state and local governments can spread the costs of unfunded liabilities over up to 30 years under current GASB standards. In addition, several commented that it can be politically unwise for a plan to be overfunded; that is, to have a funded ratio over 100 percent. The contributions made to funds with ‘excess’ assets can become a target for lawmakers with other priorities or for those wishing to increase retiree benefits.”
[27] PBGC operations are financed by a combination of insurance premiums set by Congress and paid by sponsors of defined benefit plans, assets from pension plans trusteed by PBGC, investment income earned on the PBGC’s assets, and recoveries from the companies formerly responsible for the plans.
[28] The Pension Protection Act of 2006 requires private defined benefit plans to be 100 percent funded and to make full contributions each year, although there is the possibility of a waiver for economic hardship. It also requires plans that are not fully funded to pay higher premiums to the PBGC. The discount rate that private plans use is tied to corporate bond rates.
[29] Washington Post, “Pension Reality Check,” December 8, 2010.
[30] Robert Novy-Marx and Joshua Rauh, “Public Pension Promises: How Big Are They and What Are They Worth?” Journal of Finance, forthcoming (posted October 8, 2010 on Social Science Research Network), p. 5.
[31] See discussion in National Conference on Public Employee Retirement Systems, The Advantages of Using Conventional Actuarial Approaches for Valuing Public Pension Plans, November 2008, http://www.ncpers.org/News/PageText/documents/ResearchSeriesIII.pdf .
[32] GAO-08-223.
[33] Alicia H. Munnell, Jean-Pierre Aubry, and Laura Quinby, The Impact of Public Pensions on State and Local Budgets, Center for Retirement Research at Boston College, October 2010. Munnell et al. use 5 percent for the riskless rate. They say, “Just what rate represents the riskless rate is a subject of debate…. Currently, the yield on 30-year Treasury bonds, about 4 percent, is likely less than the riskless rate due to the valuable liquidity they offer investors. Therefore, we would suggest increasing the current [Treasury] rate by about one percentage point and using a number of about 5 percent for 2009.” Alicia H. Munnell, Richard W. Kopcke, Jean-Pierre Aubry, and Laura Quinby, Valuing Liabilities in State and Local Plans, Center for Retirement Research at Boston College, June 2010.
[34] A report by Novy-Marx and Rauh suggests that various potential changes in pension policies — even relatively extreme ones — could only reduce unfunded liabilities by half, and changes more likely to be made would reduce liabilities by much less. But the authors are measuring impact on unfunded liabilities funded at the riskless rate. Some changes could have a larger impact at a more conventional discount rate. See Joshua Rauh and Robert Novy-Marx, “Policy Options for State Pension Systems and Their Impact on Plan Liabilities,” National Bureau of Economic Research, Working Paper 16453, October 2010.
[35] Studies find that public workers are paid 4 percent to 11 percent less than private-sector workers with similar education, job tenure, and other characteristics. The wage deficit is highest for higher-wage public workers. Low-wage state and local workers, by contrast, do receive a small wage premium. Benefits are more generous and secure for public employees than for most private-sector workers; factoring in the value of these benefits reduces but does not eliminate the gap between state and local employees and their private-sector counterparts in comparable jobs. See Keith A. Bender and John S. Heywood, Out of Balance? Comparing Public and Private Sector Compensation over 20 Years, Center for State & Local Government Excellence (CSLGE), National Institute on Retirement Security, April 2010; and John Schmitt, The Wage Penalty for State and Local Government Employees, Center for Economic and Policy Research (CEPR), March 2010.
[36] GASB does not have the power to compel state and localities to follow its recommendations, but they usually do follow those recommendations because financial markets prefer that they do so.
[37] Robert L. Clark and Melinda Sandler Morrill, Retiree Health Plans in the Public Sector: Is There a Funding Crisis?, (Cheltenham, UK and Northampton, MA, USA: Edward Elgar, 2010).
[38] They are Idaho, Indiana, Iowa, Kansas, Minnesota, Mississippi, Montana, Nebraska, Oregon, South Dakota, Washington, West Virginia, Wisconsin, and Wyoming. The ability to participate in the state plan is a significant benefit in itself, enabling retirees to join an insurance pool with younger and healthier workers and thus pay lower premiums than if they had to buy insurance in the individual market.
[39] They are Alaska, California, Hawaii, Illinois, Kentucky, Maine, New Mexico, New Hampshire, New Jersey, North Carolina, Ohio, Pennsylvania, Rhode Island, and Texas.
[40] United States Government Accountability Office, State and Local Government Retiree Benefits: Current Status of Benefit Structures, Protections, and Fiscal Outlook for Funding Future Costs, September 2007, GAO-07-1156.
[41] United States Government Accountability Office, State and Local Government Retiree Health Benefits: Liabilities Are Largely Unfunded, but Some Governments Are Taking Action, November 2009, GAO-10-61. GAO projects that the cost of retiree health benefits will rise from 0.9 percent of total operating revenues to 2.1 percent, on average. But this figure includes states that do not provide much in the way of benefits; the costs would be higher in the states that pay all or most of retiree premiums.
[42] An employee who wants to retire at age 55 could either get a different job that offers health benefits or pay the full cost to remain in the state/local plan. Or, this person could decide not to retiree until he or she is eligible for Medicare. Moreover, if states and localities change their pension plans to increase the normal retirement age, those changes would also reduce their retiree health liabilities.
[43] See, for example, David Skeel, “Give States a Way to Go Bankrupt,” The Weekly Standard, November 29, 2010, http://www.weeklystandard.com/articles/give-states-way-go-bankrupt_518378.html and Grover G. Norquist and Patrick Gleason, “Let States Go Bankrupt,” Politico, December 24, 2010.
[44] A bill proposed by House of Representative members Paul Ryan, Darrell Issa and Devin Nunes (H.R. 6484 in the 111th Congress) would require states and localities to report pension liabilities to the federal government using U.S. Treasury bond rates to discount liabilities as a condition of issuing tax-exempt bonds.
[45] U.S. Census Bureau, Annual Survey of State and Local Government Finance, 2008.
[46] Health care cost growth is a national problem that will require national solutions, and states have limited flexibility to influence that growth. And while the Affordable Care Act is intended ultimately to reduce the annual rate of growth of health care costs, that is unlikely to happen within the next several years; experimentation with potential avenues to “bend the cost curve” will take considerable time. Nor is there a lot of flexibility with respect to education costs; to the contrary, the pressure is to improve education and particularly teacher quality. The ratio of adults aged 25-64 (potential teachers) to children aged 6 -17 is projected to decline in future years, so these costs may have to rise more rapidly rather than less. In addition, there is evidence that as half the teachers become eligible for retirement in the next decade, teacher quality will decline unless salaries are increased substantially. A McKinsey report estimates that it would cost $30 billion to increase the percentage of new teachers drawn from the top third of their college classes from the current very low 14 percent up to 68 percent. (The report also projects large gains for the overall economy if this were to be done.) Byron Auguste, Paul Kihn, and Matt Miller, Closing the Talent Gap: Attracting and Retaining Top-third Graduates to Careers in Teaching, McKinsey & Company, September 2010.
More from the Authors

Areas of Expertise