Income Gaps Between Very Rich and Everyone Else More Than Tripled In Last Three Decades, New Data Show
The gaps in after-tax income between the richest 1 percent of Americans and the middle and poorest fifths of the country more than tripled between 1979 and 2007 (the period for which these data are available), according to data the Congressional Budget Office (CBO) issued last week. Taken together with prior research, the new data suggest greater income concentration at the top of the income scale than at any time since 1928.
While the recession that began in December 2007 likely reduced the income of the wealthiest Americans substantially and may thereby shrink the income gap between rich and poor households, a similar development that occurred around the bursting of the dot.com bubble and the 2001 recession turned out to be just a speed bump. Incomes at the top more than made up the lost ground from 2003 to 2005.
The new CBO data — the most comprehensive data available on changes in incomes and taxes for different income groups — also show the following:
- In 2007, the share of after-tax income going to the top 1 percent hit its highest level (17.1 percent) since 1979, while the share going to the middle one-fifth of Americans shrank to its lowest level during this period (14.1 percent).
- Between 1979 and 2007, average after-tax incomes for the top 1 percent rose by 281 percent after adjusting for inflation — an increase in income of $973,100 per household — compared to increases of 25 percent ($11,200 per household) for the middle fifth of households and 16 percent ($2,400 per household) for the bottom fifth (see Figure 1).
- If all groups’ after-tax incomes had grown at the same percentage rate over the 1979-2007 period, middle-income households would have received an additional $13,042 in 2007 and families in the bottom fifth would have received an additional $6,010.
- In 2007, the average household in the top 1 percent had an income of $1.3 million, up $88,800 just from the prior year; this $88,800 gain is well above the total 2007 income of the average middle-income household ($55,300). [1]Image
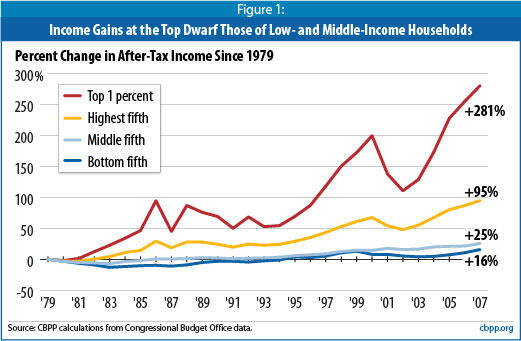
Income Gains at Top Have Outpaced All Other Groups Since 1979
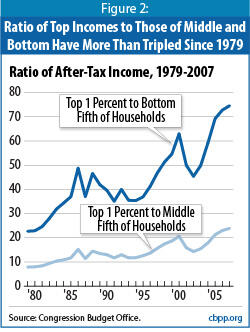
The gap in income between the wealthiest Americans and all others has grown strikingly in recent decades, the CBO data show. In 1979, when the data begin, the average after-tax incomes of the top 1 percent of households were 7.9 times higher than those of the middle fifth of households. By 2007, top incomes were 23.9 times higher than those of the middle fifth — a more than tripling of the income gap.
The gap between the top 1 percent and the poorest fifth of Americans widened even more sharply. In 1979, the incomes of the top 1 percent were 22.7 times higher than those of the bottom fifth. By 2007, top incomes were 74.6 times higher than those at the bottom — more than tripling the rich-poor gap in 28 years (see Figure 2).
The CBO data shown in Table 1 also show that between 1979 and 2007:
- The average after-tax income of the top 1 percent of the population nearly quadrupled, from $347,000 to over $1.3 million. As noted, this represented an increase of $973,100, or 281 percent, per household.
- By contrast, the average after-tax income of the middle fifth of the population rose from $44,100 in 1979 to $55,300 in 2007 — a relatively modest gain of $11,200 or 25 percent.
- The average after-tax income of the poorest fifth of the population rose from $15,300 to $17,700, an increase of $2,400 or 16 percent. [2]
The CBO figures show that the nation’s income has grown substantially since 1979; if this growth had been shared more broadly, most groups would have seen much larger gains. For the nation as a whole, after-tax household income increased 55 percent from 1979 to 2007, adjusted for inflation. If all groups’ incomes had grown by 55 percent, the average income of the bottom fifth of households would have been $23,710 in 2007 (rather than $17,700) and the average income of the middle fifth would have been $68,342 (rather than $55,300).
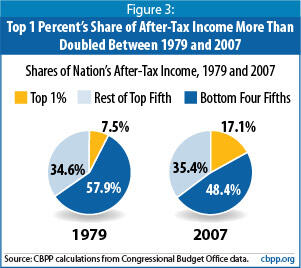
- The top 1 percent’s share of the nation’s total after-tax household income more than doubled, from 7.5 percent to 17.1 percent.
- The share of income going to the middle three-fifths (or 60 percent) of households shrank from 51.1 percent to 43.5 percent.
- The share going to the bottom fifth of households declined from 6.8 percent to 4.9 percent.
- The share going to the bottom four-fifths (80 percent) of the population declined from 58 percent to 48 percent.
In 2007, the top 1 percent received a larger share of the nation’s after-tax income than the middle 20 percent of the population. This represents a significant change from 1979, when the middle fifth received more than twice as much of the nation’s income as the top 1 percent (16.5 percent versus 7.5 percent).
| Table 1: Average After-Tax Income by Income Group 1979 - 2007 (in 2007 dollars) | ||||
| Income Category | 1979 | 2007 | Percent Change 1979-2007 | Dollar Change 1979-2007 |
| Lowest fifth | $15,300 | $17,700 | 16% | $2,400 |
| Second fifth | $31,000 | $38,000 | 23% | $7,000 |
| Middle fifth | $44,100 | $55,300 | 25% | $11,200 |
| Fourth fifth | $57,700 | $77,700 | 35% | $20,000 |
| Top fifth | $101,700 | $198,300 | 95% | $96,600 |
| Top 1 Percent | $346,600 | $1,319,700 | 281% | $973,100 |
| Source: Congressional Budget Office, Effective Federal Tax Rates: 1979-2007, June 2010. | ||||
The CBO data only go back to 1979, but economists Thomas Piketty and Emmanuel Saez have used tax data to calculate the share of income going to wealthy Americans back to 1913. Taken together, the CBO data and the Piketty and Saez findings suggest greater income concentration at the top of the income scale than at any time since 1928.[3]
Trend of Rising Inequality Continued in 2007
The new CBO data also show that income inequality widened significantly between 2006 and 2007. After-tax incomes rose faster among the top 1 percent of households than among any other income group, and more than twice as fast as among households in the middle fifth (see Table 2).
As a result, the share of the nation’s overall after-tax income going to the top 1 percent rose from 16.3 percent in 2006 to 17.1 percent in 2007. This increase amounts to approximately $71 billion in additional income for the top 1 percent.[4]
Recession Likely to Reduce Inequality, But Change May Only Be Temporary
The CBO data do not show the effect of the recession that began in December 2007. The recession is likely to lower incomes for all income groups, but if the previous recession is any guide,
incomes may fall most sharply for the wealthiest households, due in large part to the severe drop in the stock market.
Not all recessions reduce inequality even temporarily, however. Inequality continued rising throughout the back-to-back recessions of the early 1980s, the CBO data show. The short- and long-term effects of the most recent recession will depend on the course of the stock market, trends in the labor market (including decisions about executive compensation packages, bonuses, and wages) and in the economy more broadly, and public policy choices.
Bush-Era Tax Cuts Have Exacerbated Income Gaps
Legislation enacted under the Bush Administration provided taxpayers with about $1.7 trillion in tax cuts through 2008. Because high-income households received by far the largest tax cuts — not only in dollar terms but also as a percentage of income — the tax cuts have increased the concentration of after-tax income at the top of the spectrum.
The CBO data do not provide a direct measure of the impact of these tax policy changes because they also reflect the effects of changes in household incomes and other factors that influence tax payments. However, estimates by the Urban Institute-Brookings Institution Tax Policy Center that consider only the impact of the tax policy changes demonstrate that the tax cuts have widened income inequality. As a direct result of the tax cuts enacted since 2001, the Tax Policy Center found that in 2007: [5]
| Table 2: Change in Real Average After-Tax Income, 2006 to 2007 (in 2007 dollars) | ||
| Income Category | Dollar Change | Percent Change |
| Lowest fifth | $800 | 4.7% |
| Second fifth | $1,700 | 4.7% |
| Middle fifth | $1,800 | 3.4% |
| Fourth fifth | $1,800 | 2.4% |
| Top fifth | $8,400 | 4.4% |
| Top 1 Percent | $88,800 | 7.2% |
| Source: Congressional Budget Office, Effective Federal Tax Rates: 1979-2007, June 2010. | ||
- Households in the bottom fifth of the income spectrum received tax cuts averaging $29, which raised their after-tax incomes by an average of 0.4 percent.
- Those in the middle fifth received tax cuts averaging $760, which raised their after-tax incomes by an average of 2.4 percent.
- The top 1 percent of households received tax cuts averaging $41,077, which raised their after-tax incomes by an average of 5.0 percent.
- Within the top 1 percent, those with incomes exceeding $1 million received tax cuts averaging $114,000, which raised their after-tax incomes by an average of 5.7 percent.
Pre-Tax Income Inequality Also Growing Rapidly
The bulk of the increase in after-tax income inequality since 1979 reflects changes in pre-tax incomes. The incomes of the top 1 percent rose 141 percent from 1979 to 2007 before taxes are considered, the CBO data show. The top 1 percent’s share of before-tax income (like its share of after-tax income) more than doubled from 1979 to 2007, from 9.3 percent to 19.4 percent.
By 2007, the top 1 percent had before-tax incomes that were 24 times higher than those of the middle fifth of Americans — a share that had nearly tripled since 1979.
The rapidly rising pre-tax incomes of the wealthy help to explain the notable rise in the percentage of total tax revenue collected from these households. CBO’s data show that the share of total federal taxes paid by the top 1 percent of households rose from 25.5 percent in 2000 to 28.1 percent in 2007, the second-highest share since 1979 (only 2006 was higher).
The increase in the share of taxes paid by the wealthy is often cited erroneously as evidence that their tax burden is rising. In reality, the effective federal tax rate for the top 1 percent of households — the percentage of their income that they pay in federal taxes — declined from 33.0 percent of income in 2000 to 29.5 percent in 2007.
The top 1 percent paid a growing share of total taxes chiefly because they received a growing share of total before-tax income: 19.4 percent in 2007, compared to 17.8 percent in 2000. Indeed, the effective tax rate of the top 1 percent of households was lower in 2007 than in any year since 1990, demonstrating beyond a doubt that their tax burdens were decreased, not increased.
CBO Data Offer Most Comprehensive Look at Inequality
These CBO data are the most comprehensive data available on changes in incomes and taxes for different income groups, capturing trends at the very top of the income scale that other data sources, such as Census data, do not show.
Census income data do not include significant amounts of income received by high-income households. For instance, they ignore earnings above $1 million in order to help preserve confidentiality. If an individual makes $10 million a year, the Census records those earnings as $1 million. (The Census data also do not include capital gains, which constitute a large share of the income of wealthy households.) Partly for this reason, the Census data do not break out trends among the top 1 percent of households, where income gains have been especially concentrated.
CBO compiles its data from a variety of sources, combining Census survey data with IRS data on the income of the very wealthy. CBO also considers a broader range of income sources than do official Census income figures, including capital gains, non-cash benefits, and employer-provided health benefits.[6]
End Notes
[1] Figures throughout this paper were adjusted by CBO for inflation and are presented in 2007 dollars.
[2] In the CBO data, the income categories do not represent a fixed group of people from year to year but rather represent the people who fall into the various income categories in the year in question. As a result, the people in a given income category shift somewhat over time. This does not alter the findings of this paper. It simply means that the trends shown in the data do not necessarily match the income trajectories of individual households.
[3] Thomas Piketty and Emmanuel Saez, “Income Inequality in the United States, 1913-1998,” Quarterly Journal of Economics, 118, 2003. Piketty and Saez’s tables have been updated through 2007 at http://emlab.berkeley.edu/users/saez/. The Piketty and Saez data are discussed further in Avi Feller and Chad Stone, “Top 1 Percent of Americans Reaped Two-Thirds of Income Gains in Last Economic Expansion,” Center on Budget and Policy Priorities, September 9, 2009, https://www.cbpp.org/9-9-09pov.pdf.
[4] $71 billion represents the change in the top 1 percent’s share of national income between 2006 and 2007 (17.1 percent minus 16.3 percent) multiplied by aggregate after-tax income for all households in the country.
[5] See Tax Policy Center tables T06-0035 and T06-0036 at http://www.taxpolicycenter.org and Aviva Aron-Dine and Robert Greenstein, “Two High Income Tax Cuts Not Yet Fully in Effect Will Cost Billions Over the Next Five Years,” Center on Budget and Policy Priorities, February 1, 2007, https://www.cbpp.org/2-1-07tax.htm.
[6] CBO figures also account for household size. CBO constructs income categories by ranking households based on household income adjusted by the number of household members. In addition, each quintile, or fifth, contains an equal number of people (not households).
More from the Authors

Areas of Expertise
