Poverty Rose, Median Income Declined, and Job-Based Health Insurance Continued to Weaken in 2008
Recession Likely to Expand Ranks of Poor and Uninsured in 2009 and 2010
Poverty increased, median household income fell, and the percentage of Americans with employer-based health coverage continued to decline in 2008, according to Census data for 2008 issued today.
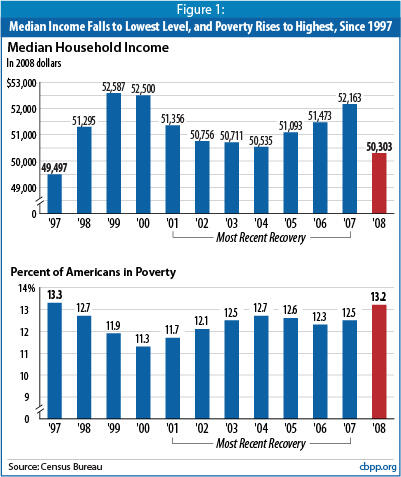
The figures reflect the initial effects of the recession. Median household income declined 3.6 percent in 2008 after adjusting for inflation, the largest single-year decline on record, and reached its lowest point since 1997. The poverty rate rose to 13.2 percent, its highest level since 1997. The number of people in poverty hit 39.8 million, the highest level since 1960.
These data include only the early months of the recession. The figures for 2009, a year in which the economy has weakened further and unemployment has climbed substantially, will look considerably worse, and the figures will likely worsen again in 2010 if, as many economic forecasters expect, unemployment continues to rise in that year. (In the last two recessions, the unemployment rate continued rising for 15 to 19 months after the recession officially ended.)
Health Insurance Data
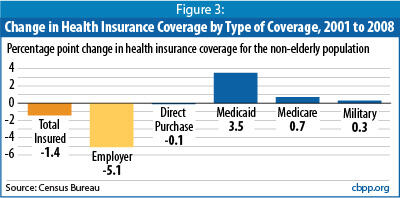
The overall percentage of people without health insurance edged up from 15.3 percent in 2002 to 15.4 percent in 2008, a change that was not statistically significant, while the number of people who are uninsured jumped by 682,000 (a change that was significant) and reached 46.3 million. The continuing decline in job-based health coverage, which has been falling since 2001, did not lead to an increase in the overall percentage of people without insurance because it was offset by an expansion of public insurance programs.
Health reform bills that Congress is considering would cover tens of millions of Americans who lack insurance by strengthening both employer coverage and Medicaid, offering new, affordable health insurance choices, and preventing insurance companies from denying coverage or charging excessive amounts to people with medical conditions. The bills would also seek to slow the growth of health care costs.
This paper provides an overview of the newly released Census data. A separate report examines the health insurance coverage figures in more detail. [1]
Poverty Expected to Rise Much More in 2009 But Would Be Worse Without Recovery Act
The worsening job situation since 2008 portends much higher poverty in 2009 and 2010. The job losses from 2007 to 2008, which numbered 532,000, are dwarfed by the roughly 5 million jobs lost between 2008 and the first eight months of 2009. Monthly job losses peaked in January 2009 at 741,000, the highest monthly total in nearly 60 years. Following the enactment of economic stimulus measures in February, the rate of job losses slowed considerably, although the number of people who are unemployed and the unemployment rate have continued to rise.
While the increases in poverty in 2009 are likely to be large, they would have been much greater without the economic recovery legislation. A Center analysis issued on September 9 that examines the effects of seven recovery act provisions finds those provisions will keep an estimated 6.2 million Americans — including 2.4 million children — from falling into poverty and will reduce the severity of poverty for 33 million others. [2] These figures are conservative because they do not include the poverty-preventing effects of other recovery act provisions, such as increases in housing assistance and child care services, or the effects of the recovery package in preserving or creating jobs.
Household Income at Lowest Level in Years, Poverty at Highest
The rise in poverty in 2008 followed a disappointing performance during the economic expansion that started in late 2001 and ended in December 2007. Poverty, which rose during and after the 2001 recession, never dropped back down to its pre-recession level. This was one of the worst records for poverty reduction of any economic recovery in decades.
As a result, the rise in poverty and decline in median income in 2008 pushed those indicators to their worst levels in years. Median household income dropped to $50,303 in 2008, a decline of $1,860 after adjusting for inflation; this is the lowest level since 1997. Similarly, the percentage of Americans living in poverty rose from 12.5 percent in 2007 to 13.2 percent in 2008, the highest rate since 1997.
The disappointing performance of the last economic expansion reflects, in part, the fact that the fruits of the economic growth during that expansion were heavily skewed to people high on the income scale rather than being broadly shared. Economists Thomas Piketty and Emmanuel Saez have found the top 1 percent of households received two-thirds of the growth in national income that occurred during the recovery, a larger share than in any other economic expansion since the 1920s.[3]
Employer-Provided Health Insurance Expected to Continue Dropping in 2009 and Beyond
Some 46.3 million U.S. residents lacked health insurance in 2008, an increase of 682,000 over the previous year and 6.6 million more than in 2001. The proportion of the population without health insurance stood at 15.4 percent in 2008, not significantly different than the 15.3 percent rate in 2007 but considerably above the 14.1 percent figure in 2001.
The percentage of people with employer-provided health insurance, the principal source of coverage for the non-elderly, has been trending downward since 2001 and is the leading contributor to the increase over time in the number of uninsured. In 2008, some 61.9 percent of people below age 65 had health coverage through their employer, down from 62.9 percent in 2007 and 67.0 percent in 2001.
Employment-based coverage is likely to drop significantly in 2009, due to the loss of jobs. In the short term, some families losing their jobs and health insurance may become eligible for Medicaid or qualify for other assistance such as temporary COBRA subsidies for formerly employed workers, which the recovery act temporarily strengthened. But, the long-term decline in private coverage is likely to continue to drive up the number and percentage of uninsured.
The Congressional Budget Office projects that under current law, the number of uninsured will continue to rise and reach 54 million by 2019. The health reform bill currently moving through the House of Representatives, as well as health reform bills in the Senate, would seek to reverse the sizable increase in the number of uninsured people that has occurred in recent decades. CBO estimates that the House bill, for example, would reduce the number of Americans without health insurance by 37 million by 2019 — from 54 million to 17 million. (A large share of the remaining 17 million would be undocumented immigrants, who are ineligible for public health programs such as Medicaid and CHIP and would be ineligible for subsidies to help them afford coverage under the various House and Senate bills.)
Additional Findings from Today's Data
Several other findings emerge from the new Census data:
1. Declines in employer-provided health insurance among children were more than offset by increases in Medicaid and CHIP coverage. The number of children with insurance through a parent or family member’s job fell from 44.3 million (or 59.5 percent of children) in 2007 to 43.9 million (or 58.9 percent) in 2008. By contrast, the number of children receiving Medicaid or CHIP increased from 20.9 million (or 28.1 percent of children) in 2007 to 22.6 million (or 30.3 percent) in 2008. This more than offset the reductions in employer-based coverage and resulted in the number of uninsured children falling by 801,000 from 2007 to 2008, and the percentage of children who are uninsured declining from 11 percent to 9.9 percent. The number and percentage of children covered through Medicaid and CHIP have grown steadily in the past decade and led to a substantial reduction in the number of children without health coverage.
2. Increases in poverty and declines in income cut across lines of race and ethnicity. Median income declined for all racial and ethnic groups in 2008, including for Hispanics (who experienced a stunning 5.6 percent decline), Asians (a 4.4 percent decline), blacks (a 2.8 percent decline), and non-Hispanic whites (a 2.6 percent decline). In addition, the poverty rate rose from 21.6 percent to 23.2 percent for Hispanics, from 10.1 percent to 11.8 percent for Asians, and from 8.1 percent to 8.6 percent for non-Hispanic whites. The poverty rate for blacks 24.7 percent in 2008 — was statistically unchanged from the year before but remained the highest of the racial/ethnic groups.
3. “Deep poverty” reached its highest point in 14 years, and poor families became poorer. In 2008, the share of Americans who live in “deep poverty” — that is, whose cash incomes fall below half of the poverty line — reached its highest level since 1994. Some 5.7 percent of Americans — or 17.1 million of them — had incomes below half of the poverty line. Half of the poverty line in 2008 was $8,582 for a family of three and $11,013 for a family of four. (Today’s Census report defines poverty as family income less than $22,025 a year for a family of four.) In addition, poor families became poorer — they fell an average of $252further below the poverty line in 2008 than poor families did in 2007.
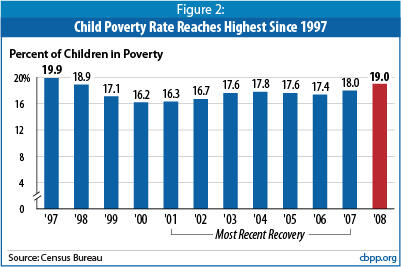
4. Child poverty and deep child poverty rose to highest level since 1997. The child poverty rate rose to 19.0 percent, leaving nearly 14.1 million children under 18 (nearly one in five) below the poverty line. The percentage of all children who live in families below half the poverty line also rose, to 8.1 percent. Both the percentage of children in poverty and the percentage in deep poverty reached the highest point since 1997.
End Notes
[1] Center on Budget and Policy Priorities, Health Insurance Coverage Declined, Became Less Secure in 2008, September 10, 2009.
[2] The seven provisions examined include the expansion of tax credits for working families, expansions of unemployment insurance and nutrition assistance benefits, and a one-time payment to Social Security beneficiaries, veterans, and beneficiaries of the Supplemental Security Income program. The figures cited here regarding the effects of the seven provisions on poverty use an alternative poverty measure that counts non-cash benefits as income. See Arloc Sherman, “Stimulus Keeping 6 Million Americans Out of Poverty in 2009, Estimates Show,” Center on Budget and Policy Priorities, September 9, 2009.
[3] Avi Feller and Chad Stone, “Top 1 Percent of Americans Reaped Two-Thirds of Income Gains in Last Economic Expansion,” Center on Budget and Policy Priorities, September 9, 2009.
More from the Authors


Areas of Expertise

Areas of Expertise