Food and Nutrition Programs: Reducing Hunger, Bolstering Nutrition
Following the creation and expansion of the domestic food assistance programs in the second half of the 20th century, severe hunger, which had been a significant national problem, has become rare. The food assistance programs were developed in several steps. Concerns about the nutritional status of young men drafted for service in World War II led to the enactment of the National School Lunch Act in 1946. [1] The Food Stamp Program was established on a pilot basis in the early 1960s, and extended nationwide in the early 1970s, to help low-income families and individuals purchase a nutritionally adequate diet. The Special Supplemental Nutrition Program for Women, Infant, and Children, popularly known as WIC, was created in the early 1970s to improve the health of low-income pregnant women, new mothers, infants, and young children who are found to be at nutritional risk.
In the 1960s, various studies found hunger to be a significant problem in the United States. Today, it has become relatively rare, although it still exists. In addition to easing one of the major burdens of poverty — being unable to put enough food on the table — the nutrition assistance programs also have been found to improve birth outcomes and increase children’s intake of key nutrients. [2]
Food and nutrition programs have made severe hunger in America rare. Before the federal government provided food stamps and other forms of food and nutrition assistance, hunger and severe malnutrition could be found in many low-income communities in the United States. In the late 1960s, the Field Foundation sponsored a team of doctors that documented serious hunger and malnutrition in the South, Appalachia, and other poor areas. The findings of this study, as well as other studies conducted at that time, formed the basis for the 1968 CBS television documentary “Hunger in America,” which showed children suffering from diseases related to severe malnutrition that usually are thought of as occurring only in third-world countries.
A similar team of physicians returned to very poor areas of the United States in 1977 — after food stamps and other nutrition assistance programs were made available nationwide — and found marked reductions in malnutrition and related problems. The physicians’ report explained:
Our first and overwhelming impression is that there are far fewer grossly malnourished people in this country today than there were ten years ago. Malnutrition has become a subtler problem. In the Mississippi delta, in the coal fields of Appalachia and in coastal South Carolina — where visitors ten years ago could quickly see large numbers of stunted, apathetic children with swollen stomachs and the dull eyes and poorly healing wounds characteristic of malnutrition — such children are not to be seen in such numbers. Even in areas which did not command national attention ten years ago, many poor people now have food.…This change does not appear to be due to an overall improvement in living standards or to a decrease in joblessness in these areas…. The Food Stamp Program, the nutritional components of Head Start, school lunch and breakfast programs, and …. [WIC] have made the difference.[3]
The Food Stamp Program
Summarizing this and other research, Rebecca Blank, a noted economist and dean of the Ford School of Public Policy at the University of Michigan, has observed that “evidence of severe malnutrition-related health problems has almost disappeared in this country. The primary reason is Food Stamps.” [4] The Food Stamp Program serves the following functions:
The Food Stamp Program helps poor families and individuals purchase an adequate diet. The Food Stamp Program is not restricted to specific subgroups of people. It serves a wide range of low-income people, including families with children, elderly people, and people with disabilities. About 80 percent of food stamp recipients live in households with children. Some 31 percent of recipients — nearly one-third — are elderly people or people with disabilities.
The Food Stamp Program increases the amount that low-income households spend on food and is designed to target the most assistance to those who need the most help. Two research studies published in 1980 compared national food sales and consumption data for periods of time before and after the establishment of the Food Stamp Program and its expansion nationwide. These studies found substantial increases in food sales in low-income counties and in nutrient availability among the low-income population. [5] Subsequent studies have consistently found that participation in the Food Stamp Program significantly increases household food expenditures and thus the nutrients that are available to low-income households.[6]
Food stamps are targeted to those with the greatest need for help in purchasing food. Ninety percent of the households that receive food stamps have incomes below the poverty line. More than a third of food stamp recipients have incomes below half of the poverty line — about $7,800 on an annual basis for a family of three in 2004. Very poor households receive more food stamps than households closer to the poverty line, significantly increasing their food purchasing power.
The Food Stamp Program delivers benefits accurately and efficiently. The Food Stamp Program is highly effective at reducing hunger in part because it provides benefits (in the form of a debit card) that can be used only to purchase food. Research has shown that the requirement that food stamp benefits be spent only on food increases food expenditures two to nine times more than would the provision of a similar amount of cash aid. [7]
Moreover, efforts by USDA and the states have greatly reduced the receipt of benefits by households that are not eligible for food stamps. USDA reports that fewer than two percent of food stamp benefits are issued to households that do not meet all of the program’s eligibility requirements. Rates of both erroneous “overpayments” and “underpayments” have fallen for six years, consistently setting new all-time lows.
The national food stamp error rate is now below 6 percent, a level that until recently automatically qualified states for enhanced funding due to exemplary performance. Moreover, this is a combined error rate and represents the sum of the overpayment error rate (4.5 percent) and the underpayment error rate (1.4 percent). The underpayment error rate measures errors in which eligible, participating households received fewer benefits than the program’s rules direct. Some have mistakenly spoken of the combined error rate as if it were a reflection of the level of excess federal expenditures that occurred due to errors. This is incorrect because the combined error rate includes underpayments that save the federal government money.
The net loss to the federal government (i.e., the benefits lost through overpayments minus those saved by underpayments) is three percent. The food stamp error rate compares quite favorably to error rates for most other government programs for which data are available. For example, the Internal Revenue Service estimates that federal taxes were underpaid by at least 15 percent in 2001. [8]
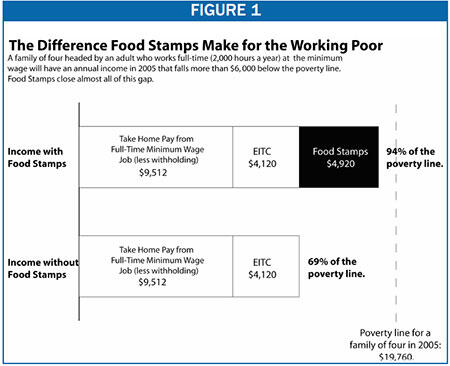
Food stamps help low-paid working families make ends meet. Leaders from across the political spectrum generally agree that a family supported by a full-time, year-round worker should not have to be poor and should not have to raise its children in poverty. For families supported by minimum-wage workers, food stamps are essential to meeting this goal. Even if one counts the Earned Income Tax Credit and does not subtract any work expenses except payroll taxes, a family of four headed by a full-time minimum-wage worker will fall far below the poverty line without food stamps. Food stamps make it possible for this family to approach the poverty line. (See Figure 1.)
The Food Stamp Program reduces poverty. Food stamps help to lessen the extent and severity of poverty. Census Bureau data on family disposable income (which account not only for cash income but also for the value of food stamps and a range of other non-cash benefits and taxes) show that [9]:
- Food stamps lifted the income of 1.8 million Americans above the poverty line in 2003. This includes 888,000 children and 129,000 seniors.
- Food stamps lifted the income of another 1.8 million Americans above half the federal poverty line, thereby protecting them from extreme poverty.
- Food stamps protect more children — 1.1 million — from extreme poverty than any other program.
The Food Stamp Program insures against economic risks. Food stamps offer protection from economic risks both for households and for the economy. If a parent loses her job or has a job that pays low wages, food stamps can help her protect her children from the risk of going without sufficient food, until she is able to improve her circumstances. In this sense, the Food Stamp Program offers a form of insurance.
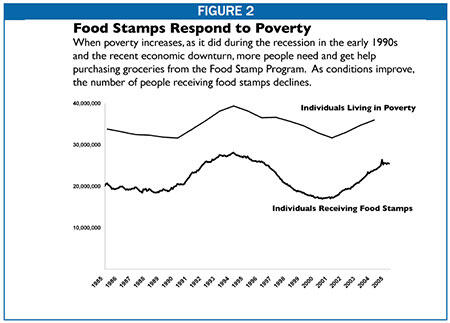
This insurance function can be seen in the program’s quick and effective response to the recent economic downturn, when an increasing number of people lacked the earnings necessary to feed their families adequately. As can be seen in Figure 2, the Food Stamp Program responds to declines in employment and increases in poverty during economic downturns by providing food assistance during those times to a larger number of low-income families. Conversely, when the economy experienced robust growth in the late 1990s and the number of people who were poor fell, the number of people receiving food stamps also declined.
In addition to providing protection against economic risks for individuals and families, food stamps also provide a measure of countercyclical protection for the local and national economy. Because of its quick and automatic response to increased need, food stamps help maintain overall demand for food during slow economic periods.
This is important because when unemployment increases, consumption can decline (since people have less money to spend); that can create a negative cycle of increasing unemployment and declining economic activity. Programs like food stamps slow this negative cycle by partially compensating for people’s loss of income. A USDA study found that every $5 of food stamps generates almost $10 in total economic activity.[10]
The WIC and School Meals Programs
Evidence also is strong for the efficacy of WIC and the child nutrition programs. These programs have been found to produce the following effects.
The WIC program improves birth outcomes and reduces health care costs. Babies with low birth weights are more likely to die in infancy or to become disabled or ill. A large body of research has consistently found that WIC contributes to healthier births, including increases in average birth weight and a reduction in the incidence of low birthweight.[11] A 1992 Government Accountability Office (GAO) analysis of the research on WIC — the only meta-analysis of multiple studies conducted to date — concluded that pregnant women who received WIC benefits were much less likely to have low-birthweight babies. The GAO estimated that prenatal WIC participation reduced the proportion of low-birthweight babies by 25 percent and the incidence of babies born with very low birthweight by 44 percent. [12] While it is possible that the magnitude of these effects has decreased since the time of the GAO analysis, the most recent comprehensive literature review, published by USDA in October 2004, found that more recent studies have continued to find that WIC participation during pregnancy reduces the incidence of low birthweight and has a positive impact on other birth outcomes.[13]
Improved birth outcomes lead to health care savings. The GAO analysis of the research on WIC estimated that each $1 spent on WIC for pregnant women generated $2.89 in health care savings during the first year after birth and $3.50 in savings over 18 years. [14] These savings help to reduce the amount the government spends on Medicaid, since Medicaid covers a large share of medical care costs for low-income infants.
WIC and school meal programs increase children’s intake of key nutrients. There is considerable evidence that WIC and the school meals programs increase children’s intake of key nutrients and have other significant benefits.
- WIC has been found to decrease the prevalence of anemia and insufficient iron intake among children. [15] Recent research on the diets of children who participate in WIC has shown that participation in the program increases intakes of vitamins B6, folate, and iron and may decrease consumption of added sugar. In addition, one recent study found that among children in households with income below 130 percent of the poverty line, WIC participants consumed less fat and more carbohydrates than non-participants.
- The research also indicates that children who participate in the school lunch program consume more protein, vitamin B12, riboflavin, calcium, magnesium, phosphorus, zinc, and fiber at lunch — and less added sugar — than children who do not eat school lunches. Past studies also found that lunches consumed by participants provided more fat and saturated fat than other lunches. In response, USDA has implemented a national initiative to improve the nutritional quality of school meals to address this problem. [16] More schools now offer meals that are lower in fat and sodium while still offering recommended amounts of the key nutrients.
- Recent studies indicate that physicians and caregivers rate the health status of children participating in WIC as better than similar children who do not participate in the program. In addition, WIC participation appears to increase the likelihood that children will complete their immunizations on time. It also improves children’s ability to obtain preventive and curative health services. [17]
- One recent study found that among girls in “food-insecure” households, those who participated in the school lunch program were 71 percent less likely to be at risk of becoming overweight than girls who did not participate in the program. [18]
- Eating breakfast has been shown to have a positive impact on a child’s cognitive development and academic performance. [19] Low-income children are more likely to eat a more substantial breakfast (one that provides more than 10 percent of the Recommended Energy Allowance) if the School Breakfast Program is available.[20]
Millions of Americans Face Food Insecurity
Severe hunger is rare in the United States, thanks in large part to the food and nutrition programs. Census data show, however, that in 2003, between 23 million and 28 million people in the United States with low incomes lived in households that experienced “food insecurity,” a less severe condition that arises when a household has difficulty securing adequate food throughout the year due to a lack of resources. [21]
Some of these low-income families and individuals are unable to get food stamps because of bans imposed by Congress that prohibit the provision of food stamps to certain categories of low-income people. For example, most “new Americans” — legal immigrants who have become permanent residents of the United States — are barred from receiving food stamps during their first five years in the country, no matter how low their incomes are or how hard they work. As a result of this ban, food insecurity and hunger among immigrants increased in the latter half of the 1990s. [22]
In addition, many unemployed people without children face a three-month time limit on receipt of food stamps. [23] A USDA study found that 40 percent of such adults in South Carolina were food insecure, and 23 percent showed signs of experiencing hunger, when they were surveyed 12 months after they left the Food Stamp Program.[24]
In addition, not all individuals and families who are eligible for food and nutrition assistance receive it. USDA estimates that only 54 percent of the people eligible for food stamps receive them; participation rates are relatively low for seniors, working families, and families with members who are legal immigrants who have resided in the United States for more than five years and thus can qualify for food stamps. [25] Although the school meal programs are widely available, one recent study found that in the areas examined, nearly one in four children eligible for free meals (23 percent) was not enrolled in the free and reduced-price lunch program.[26] Nearly one in five children in a school that offers the school lunch program does not have access to the School Breakfast Program because the school does not offer it.
Finally, many households that receive nutrition assistance still struggle to make ends meet. In many cases, the combination of households’ earnings, nutrition assistance, and other income sources do not cover the households’ rent, utility, food, child care, health care, and other bills. Such households must juggle their limited resources and expenses and sometimes have difficulty affording adequate food.
| Appendix A: | ||||
|
| Children | Elderly | Persons with Disabilities | Total |
| U.S. Total | 12,920,000 | 2,200,000 | 3,200,000 | 25,490,000 |
| Alabama | 270,000 | 42,000 | 75,000 | 540,000 |
| Alaska | 28,000 | 2,000 | 4,000 | 54,000 |
| Arizona | 306,000 | 28,000 | 41,000 | 547,000 |
| Arkansas | 183,000 | 25,000 | 41,000 | 370,000 |
| California | 1,340,000 | 32,000 | 12,000 | 1,987,000 |
| Colorado | 130,000 | 19,000 | 38,000 | 252,000 |
| Connecticut | 92,000 | 21,000 | 36,000 | 203,000 |
| Delaware | 32,000 | 4,000 | 7,000 | 61,000 |
| Dist Columbia | 40,000 | 5,000 | 10,000 | 89,000 |
| Florida | 675,000 | 234,000 | 211,000 | 1,465,000 |
| Georgia | 465,000 | 72,000 | 99,000 | 913,000 |
| Hawaii | 39,000 | 15,000 | 10,000 | 94,000 |
| Idaho | 48,000 | 5,000 | 13,000 | 94,000 |
| Illinois | 565,000 | 85,000 | 169,000 | 1,140,000 |
| Indiana | 279,000 | 36,000 | 81,000 | 554,000 |
| Iowa | 96,000 | 12,000 | 28,000 | 203,000 |
| Kansas | 84,000 | 14,000 | 24,000 | 176,000 |
| Kentucky | 247,000 | 47,000 | 104,000 | 566,000 |
| Louisiana | 376,000 | 55,000 | 81,000 | 734,000 |
| Maine | 55,000 | 22,000 | 33,000 | 151,000 |
| Maryland | 142,000 | 24,000 | 40,000 | 285,000 |
| Massachusetts | 181,000 | 28,000 | 62,000 | 357,000 |
| Michigan | 506,000 | 78,000 | 160,000 | 1,030,000 |
| Minnesota | 130,000 | 22,000 | 35,000 | 257,000 |
| Mississippi | 194,000 | 36,000 | 56,000 | 380,000 |
| Missouri | 362,000 | 55,000 | 104,000 | 761,000 |
| Montana | 37,000 | 6,000 | 10,000 | 80,000 |
| Nebraska | 57,000 | 12,000 | 15,000 | 117,000 |
| Nevada | 62,000 | 11,000 | 14,000 | 123,000 |
| New Hampshire | 24,000 | 4,000 | 10,000 | 52,000 |
| New Jersey | 194,000 | 44,000 | 59,000 | 388,000 |
| New Mexico | 128,000 | 15,000 | 24,000 | 240,000 |
| New York | 790,000 | 293,000 | 275,000 | 1,754,000 |
| North Carolina | 391,000 | 70,000 | 105,000 | 791,000 |
| North Dakota | 20,000 | 4,000 | 5,000 | 42,000 |
| Ohio | 489,000 | 81,000 | 202,000 | 997,000 |
| Oklahoma | 211,000 | 29,000 | 48,000 | 423,000 |
| Oregon | 186,000 | 32,000 | 52,000 | 429,000 |
| Pennsylvania | 467,000 | 95,000 | 185,000 | 1,033,000 |
| Rhode Island | 40,000 | 6,000 | 10,000 | 77,000 |
| South Carolina | 264,000 | 35,000 | 59,000 | 517,000 |
| South Dakota | 27,000 | 4,000 | 5,000 | 56,000 |
| Tennessee | 381,000 | 81,000 | 113,000 | 844,000 |
| Texas | 1,407,000 | 205,000 | 179,000 | 2,427,000 |
| Utah | 73,000 | 6,000 | 14,000 | 131,000 |
| Vermont | 18,000 | 7,000 | 7,000 | 45,000 |
| Virginia | 232,000 | 54,000 | 77,000 | 485,000 |
| Washington | 221,000 | 44,000 | 70,000 | 503,000 |
| West Virginia | 109,000 | 21,000 | 50,000 | 261,000 |
| Wisconsin | 189,000 | 22,000 | 39,000 | 342,000 |
| Wyoming | 13,000 | 2,000 | 3,000 | 26,000 |
| Appendix B: | ||||
|
| Pregnant, Postpartum, and Breastfeeding Women | Infants | Children | Total |
| U.S. Total | 1,930,000 | 2,010,000 | 3,960,000 | 7,900,000 |
| Alabama | 29,000 | 34,000 | 58,000 | 120,000 |
| Alaska | 6,000 | 6,000 | 14,000 | 27,000 |
| Arizona | 43,000 | 46,000 | 88,000 | 176,000 |
| Arkansas | 24,000 | 24,000 | 40,000 | 89,000 |
| California | 314,000 | 291,000 | 688,000 | 1,293,000 |
| Colorado | 21,000 | 23,000 | 40,000 | 83,000 |
| Connecticut | 11,000 | 14,000 | 27,000 | 52,000 |
| Delaware | 4,000 | 5,000 | 9,000 | 18,000 |
| Dist Columbia | 4,000 | 4,000 | 8,000 | 16,000 |
| Florida | 94,000 | 99,000 | 180,000 | 373,000 |
| Georgia | 69,000 | 70,000 | 121,000 | 260,000 |
| Hawaii | 8,000 | 8,000 | 17,000 | 33,000 |
| Idaho | 9,000 | 9,000 | 19,000 | 36,000 |
| Illinois | 68,000 | 81,000 | 127,000 | 276,000 |
| Indiana | 35,000 | 39,000 | 58,000 | 131,000 |
| Iowa | 16,000 | 15,000 | 35,000 | 66,000 |
| Kansas | 15,000 | 16,000 | 33,000 | 64,000 |
| Kentucky | 28,000 | 30,000 | 60,000 | 117,000 |
| Louisiana | 36,000 | 42,000 | 64,000 | 142,000 |
| Maine | 5,000 | 6,000 | 12,000 | 23,000 |
| Maryland | 27,000 | 30,000 | 50,000 | 108,000 |
| Massachusetts | 28,000 | 27,000 | 60,000 | 116,000 |
| Michigan | 52,000 | 54,000 | 116,000 | 222,000 |
| Minnesota | 28,000 | 28,000 | 61,000 | 117,000 |
| Mississippi | 24,000 | 31,000 | 47,000 | 103,000 |
| Missouri | 35,000 | 36,000 | 61,000 | 133,000 |
| Montana | 5,000 | 4,000 | 12,000 | 21,000 |
| Nebraska | 10,000 | 10,000 | 20,000 | 40,000 |
| Nevada | 12,000 | 13,000 | 21,000 | 46,000 |
| New Hampshire | 4,000 | 4,000 | 9,000 | 17,000 |
| New Jersey | 36,000 | 37,000 | 70,000 | 143,000 |
| New Mexico | 15,000 | 16,000 | 33,000 | 64,000 |
| New York | 119,000 | 122,000 | 232,000 | 473,000 |
| North Carolina | 55,000 | 57,000 | 107,000 | 219,000 |
| North Dakota | 3,000 | 3,000 | 8,000 | 14,000 |
| Ohio | 63,000 | 81,000 | 123,000 | 267,000 |
| Oklahoma | 29,000 | 30,000 | 57,000 | 116,000 |
| Oregon | 25,000 | 20,000 | 55,000 | 100,000 |
| Pennsylvania | 55,000 | 63,000 | 123,000 | 241,000 |
| Rhode Island | 5,000 | 6,000 | 12,000 | 23,000 |
| South Carolina | 28,000 | 30,000 | 48,000 | 107,000 |
| South Dakota | 5,000 | 5,000 | 11,000 | 22,000 |
| Tennessee | 40,000 | 43,000 | 72,000 | 155,000 |
| Texas | 212,000 | 217,000 | 439,000 | 868,000 |
| Utah | 17,000 | 18,000 | 32,000 | 67,000 |
| Vermont | 3,000 | 3,000 | 10,000 | 16,000 |
| Virginia | 34,000 | 34,000 | 64,000 | 132,000 |
| Washington | 37,000 | 37,000 | 85,000 | 159,000 |
| West Virginia | 12,000 | 12,000 | 26,000 | 50,000 |
| Wisconsin | 26,000 | 27,000 | 57,000 | 110,000 |
| Wyoming | 3,000 | 3,000 | 6,000 | 12,000 |
| Appendix C: | |||
|
| Children Enrolled for Free Meals | Children Enrolled for Reduced-Price Meals | Total |
| U.S. Total | 18,500,000 | 4,010,000 | 22,510,000 |
| Alabama | 333,000 | 62,000 | 395,000 |
| Alaska | 30,000 | 9,000 | 40,000 |
| Arizona | 388,000 | 76,000 | 464,000 |
| Arkansas | 208,000 | 43,000 | 251,000 |
| California | 2,419,000 | 598,000 | 3,017,000 |
| Colorado | 213,000 | 54,000 | 267,000 |
| Connecticut | 128,000 | 31,000 | 159,000 |
| Delaware | 60,000 | 10,000 | 70,000 |
| Dist Columbia | 46,000 | 6,000 | 52,000 |
| Florida | 1,619,000 | 241,000 | 1,860,000 |
| Georgia | 642,000 | 135,000 | 777,000 |
| Hawaii | 46,000 | 18,000 | 64,000 |
| Idaho | 79,000 | 27,000 | 106,000 |
| Illinois | 771,000 | 128,000 | 899,000 |
| Indiana | 303,000 | 83,000 | 386,000 |
| Iowa | 118,000 | 40,000 | 158,000 |
| Kansas | 143,000 | 48,000 | 191,000 |
| Kentucky | 288,000 | 63,000 | 350,000 |
| Louisiana | 425,000 | 67,000 | 491,000 |
| Maine | 52,000 | 15,000 | 67,000 |
| Maryland | 214,000 | 64,000 | 278,000 |
| Massachusetts | 229,000 | 53,000 | 282,000 |
| Michigan | 515,000 | 114,000 | 629,000 |
| Minnesota | 205,000 | 68,000 | 273,000 |
| Mississippi | 304,000 | 42,000 | 346,000 |
| Missouri | 317,000 | 72,000 | 389,000 |
| Montana | 40,000 | 13,000 | 52,000 |
| Nebraska | 81,000 | 27,000 | 108,000 |
| Nevada | 129,000 | 32,000 | 160,000 |
| New Hampshire | 32,000 | 13,000 | 45,000 |
| New Jersey | 324,000 | 92,000 | 416,000 |
| New Mexico | 171,000 | 34,000 | 205,000 |
| New York | 1,104,000 | 229,000 | 1,333,000 |
| North Carolina | 542,000 | 117,000 | 659,000 |
| North Dakota | 19,000 | 8,000 | 27,000 |
| Ohio | 502,000 | 114,000 | 615,000 |
| Oklahoma | 269,000 | 66,000 | 335,000 |
| Oregon | 193,000 | 48,000 | 241,000 |
| Pennsylvania | 499,000 | 123,000 | 621,000 |
| Rhode Island | 70,000 | 11,000 | 81,000 |
| South Carolina | 318,000 | 55,000 | 373,000 |
| South Dakota | 36,000 | 12,000 | 48,000 |
| Tennessee | 369,000 | 69,000 | 439,000 |
| Texas | 2,002,000 | 386,000 | 2,388,000 |
| Utah | 119,000 | 47,000 | 166,000 |
| Vermont | 21,000 | 7,000 | 29,000 |
| Virginia | 307,000 | 84,000 | 390,000 |
| Washington | 293,000 | 90,000 | 383,000 |
| West Virginia | 121,000 | 31,000 | 152,000 |
| Wisconsin | 215,000 | 66,000 | 280,000 |
| Wyoming | 20,000 | 9,000 | 28,000 |
End Notes
End Notes:s:
[1] The School Breakfast Program, Child and Adult Care Food Program, and Summer Food Service Program were established in the late 1960s. The Commodity Supplemental Food Program was established in the early 1970s. This paper focuses on the federal nutrition programs that serve the most participants: the Food Stamp Program, the school meals programs, and the Special Supplemental Nutrition Program for Women, Infants, and Children (WIC).
[2] For a review of research on the effects of nutrition programs, see Volume 3, Literature Review of Mary Kay Fox, William Hamilton, and Biing-Hwan Lin, Effects of Food Assistance and Nutrition Programs on Nutrition and Health, Economic Research Service, U.S. Department of Agriculture, 2004 available at www.ers.usda.gov/publications/FANRR19-3 (hereinafter USDA Literature Review).
[3] Nick Kotz, Hunger in America: The Federal Response, (New York: Field Foundation, 1979).
[4] Rebecca Blank, It Takes a Nation (New York: Russell Sage Foundation, 1997).
[5] See Francis J. Cronin, Nutrient Levels and Food Used by Households, 1977 and 1965, (Family Economics Review, spring 1980), and William T. Boehm, Paul E. Nelson, And Kathryn A. Longen, Progress toward Eliminating Hunger in America, Economics, Statistics, and Cooperatives Service, U.S. Department of Agriculture, 1980.
[6] See USDA Literature Review, p. 42. Food stamp receipt can be sporadic, and diet and health quality are influenced by many different factors, including environmental factors that occur over long time periods. As a result, it is more difficult to establish a direct causal relationship between food stamp participation and health outcomes. Studies have convincingly shown that the Food Stamp Program results in low-income households’ securing food with more nutrients. Studies that have tried to assess the impact on nutrient intake on an individual level have not been conclusive, but it is widely agreed that this latter body of research suffers from a number of limitations related to research design, selection bias, and other factors. It also may be noted that there is little evidence of any connection between the Food Stamp Program and obesity.
[7] See National Food Stamp Conversation 2000, Food, and Nutrition Service, U.S. Department of Agriculture, 2000.
[8] Internal Revenue Service, New IRS Study Provides Preliminary Tax Gap Estimate (IR-2005-38, March 29, 2005), available at:http://www.irs.gov/newsroom/article/0,,id=137247,00.html.
[9] These poverty calculations are based on disposable income. Disposable income, as used here, is the amount of income that a family has available after taking into account taxes, including tax credits such as the EITC, and public benefits in the form of cash assistance, food assistance, rental assistance, and energy assistance. Data are from a Center analysis of the Census Bureau’s March 2004 Current Population Survey.
[10] Kenneth Hanson and Elise Golan, Effects of Changes in Food Stamp Expenditures Across the U.S. Economy, Food Assistance and Nutrition Research Report Number 26-6, Economic Research Service, U.S. Department of Agriculture, August 2002.
[11] See USDA Literature Review, pp. 108-115.
[12] General Accounting Office, Early Intervention — Federal Investments Like WIC Can Produce Savings, April 1992, pp. 23-24, available at http://www.gao.gov/docsearch/abstract.php?rptno=HRD-92-18 (hereinafter Early Intervention).
[13] USDA Literature Review, pp. 108-115. One reason why the magnitude of the average effects of WIC may have decreased over time is that WIC seems to have the strongest impact on the most disadvantaged participants, and as a result of the program’s expansion, the WIC caseload may, on average, be somewhat better off now than in the 1980s and early 1990s.
[14] Early Intervention, pp. 28-29.
[15] See USDA Literature Review, pp. 142-151 and 157-158.
[16] See Ibid., pp. 190-196.
[17] See Ibid., pp. 158-162.
[18] See Ibid., pp. 197-205. A family is considered “food insecure” if, at some time during the year, it was uncertain of having, or unable to acquire, enough food because of a lack of resources. This study also found that the likelihood of being at risk of becoming overweight was the same for boys in food insecure households, as well as for children in households that did not report food insecurity, regardless of participation in the school lunch program. Additional research is needed to confirm the results of this study.
[19] See Evaluation of the School Breakfast Program Pilot Project: Findings from the First Year of Implementation, Food and Nutrition Service, U.S. Department of Agriculture, October 2002, available at http://www.fns.usda.gov/oane/MENU/Published/CNP/FILES/BreakfastPilotYr1.pdf .
[20] See USDA Literature Review, p. 218.
[21] According to the official government measure of food insecurity, a household is “food insecure” in a particular year if it experienced at least three conditions in that year that indicate the household had difficulty meeting basic food needs because of a lack of resources. A food-insecure household is further categorized as suffering from hunger, the most severe form of food insecurity, if it experienced two or more specific severe conditions that may indicate hunger, such as cutting the size of meals or skipping meals in three or more months of the past year. According to the Census Bureau, about 8 million people lived in low-income households where someone experienced hunger in 2003.
[22] See George J. Borjas, “Food Insecurity and Public Assistance.”
[23] Unemployed childless adults can receive food stamps for only three months out of a three-year period.
[24] Phillip Richardson and others, Food Stamp Leavers Research Study—Study of ABAWDs Leaving the Food Stamp Program in South Carolina: Final Report, Economic Research Service, U.S. Department of Agriculture, March 2003.
[25] Karen Cunnyngham, Trends in Food Stamp Program Participation Rates: 1999 to 2002, Food and Nutrition Service, U.S. Department of Agriculture: September 2004.
[26] Burghardt, J., Gleason, P., Sinclair, M., Cohen, R., Hulsey, L., and Milliner-Waddell, J, Evaluation of the National School Lunch Program Application/Verification Pilot Projects: Volume I: Impacts on Deterrence, Barriers, and Accuracy, Food and Nutrition Service, U.S. Department of Agriculture, February 2004, available at http://www.fns.usda.gov/oane/MENU/Published/CNP/FILES/NSLPPilotVol1.pdf.
More from the Authors

Areas of Expertise