Deep Poverty Among Children Worsened in Welfare Law’s First Decade
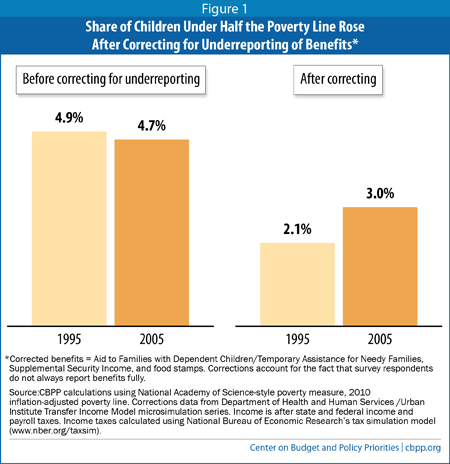
Since the mid-1990s, when policymakers made major changes in the public assistance system, the proportion of children living in poverty has declined, but the harshest extremes of child poverty have increased. After correcting for the well-known underreporting of safety net benefits in the Census data, we estimate that the share of children in deep poverty — with family income below half of the poverty line — rose from 2.1 percent to 3.0 percent between 1995 and 2005. The number of children in deep poverty climbed from 1.5 million to 2.2 million.
The Rise in Deep Poverty
In the mid-1990s, policymakers dramatically shifted income assistance policies for low-income families with children toward helping workingfamilies. They replaced Aid to Families with Dependent Children (AFDC), which had chiefly served families with little or no earnings, with Temporary Assistance for Needy Families (TANF), which offers less assistance and includes stricter work requirements and time limits. At the same time, policymakers expanded assistance for moderate-income working families, such as by strengthening the Earned Income Tax Credit (EITC) and medical and child care programs and creating and later expanding the Child Tax Credit through a partially refundable component of the credit for lower-income families with earnings.
The results over the ensuing decade were mixed. The bulk of the evidence suggests that while many parents moved from welfare to work and child poverty declined overall, the number and percentage of children in deep or severe poverty, with family income below half the poverty line or even lower, increased. The evidence of this increase includes the following:
- Early welfare-to-work programs increased deep poverty even as they reduced overall poverty. In one federal evaluation of 11 early 1990s programs that included work requirements and other key elements of the 1996 welfare law, deep poverty rates rose significantly for families in six of the programs (and declined in none) in comparison with “control group” families randomly assigned to a more traditional welfare program. By contrast, overall poverty rates (that is, the share of participants below the poverty line) fell significantly in five programs (and rose in none).[1] Although all 11 programs raised employment rates, most also raised the share of families at any given time who had neither employment nor welfare.[2]
Similarly, in one of the few rigorous, random-assignment studies of a time-limited welfare-to-work program — Connecticut’s Jobs First pilot study — economists Marianne Bitler, Jonah Gelbach, and Hilary Hoynes found that “there are definitely negative [income] effects on some women, and positive effects on others” and that losses “are concentrated at the lower end, with the positive ones concentrated in the upper half” of the participants’ income distribution. - Measured carefully, deep poverty rose nationwide. Between 1984 and 2004, even as the overall poverty rate fell, the percentage of Americans living in deep poverty rose markedly, according to a study published in the 2012 Oxford Handbook of the Economics of Poverty.[4] Deep poverty also rose between 1993 and 2004. The study counts as income the value of non-cash benefits such as SNAP (formerly food stamps) and tax credits such as the EITC, as most analysts favor.
- More families are living on less than $2 per person per day. The number of households with children with monthly cash incomes equivalent to less than $2 per person per day — a standard of poverty more associated with third-world countries — has more than doubled since 1996, rising 159 percent to 1.6 million households in 2011, according to the University of Michigan’s Luke Shaefer and Harvard’s Kathryn Edin.[5] Counting the value of tax credits and non-cash benefits — housing assistance, tax credits, and SNAP — lowers these numbers considerably, but the growth in extremely poor households with children remains troubling: a 50 percent increase, to 613,000 families in 2011. Extreme poverty rose “particularly among those most impacted by the 1996 welfare reform,” Shaefer and Edin found.
Criticisms of Severe Poverty Data Do Not Stand Up
A recent Forbes critique by the Manhattan Institute’s Scott Winship tries to poke holes in the Shaefer-Edin findings cited in this report on the rise in the number of families living on less than $2 per person per day.a But the critique itself doesn’t hold up well.
Winship questions whether the rise in extreme poverty that Shaefer and Eden report is large enough to be statistically reliable or “significant.” But the increase — from 1.1 percent to 1.6 percent between 1996 and 2011 — is amply significant, with about a 99 percent chance of being reliably different from no change, based on Census Bureau formulas.
Winship also seems to suggest that the study is invalid because “any reasonable definition of ‘income’” would include the value of assistance from soup kitchens and spare change from strangers. No nationally representative monthly survey counts this sort of assistance as income. Census income surveys focus, appropriately, on money received “on a regular basis,” distinguishing between what families obtain in relatively reliable and socially acceptable ways and what they beg (or borrow or steal) as a last resort.b
Winship also argues that extreme poverty would shrink further if Shaefer and Edin somehow managed to attach a cash value to government health insurance. This point is a weak one, however. You can’t pay rent with Medicaid, and poverty measurement experts and federal statistical agencies have largely rejected treating medical assistance like cash for the purpose of determining poverty status.c
Finally, Winship cites the work by Columbia University’s Christopher Wimer and his colleagues that did not show a rise in children’s deep poverty after 1996. But, as discussed below, when we use the same survey, we find that deep poverty did rise when underreporting of benefit income is corrected.
a Scott Winship, “Work-Promoting Safety Net Reforms Have Helped the Poor,” Forbes, June 19, 2014, http://www.forbes.com/sites/scottwinship/2014/06/19/work-promoting-safety-net-reforms-have-helped-the-poor/.
b See the Census Bureau’s “About Income” discussion at https://www.census.gov/hhes/www/income/about/.
c See, for example, “Observations from the Interagency Technical Working Group on Developing a Supplemental Poverty Measure,” Census Bureau, March 2010, https://www.census.gov/hhes/www/poverty/SPM_TWGObservations.pdf.
Underreporting of Income Can Mask Rise in Deep Poverty
Some data sources do not show a rise in deep poverty for children, but this appears to be the result of a serious technical flaw: the omission from these data of a large share of the income from key public benefit programs. Correcting for this flaw reduces the deep poverty rate in any given year but reveals the increase in deep poverty over the decade that occurred as income from these programs — particularly public assistance — shrank due to policymakers’ actions.
For example, a groundbreaking and generally thorough analysis of poverty and deep poverty back to 1967 by Columbia University’s Christopher Wimer and his colleagues shows little change in the children’s deep poverty rate since 1996. But the study uses the Census Bureau’s Current Population Survey (CPS), which tends to miss public assistance income to a greater degree than does the separate Census survey (called the Survey of Income and Program Participation or SIPP) used by the Oxford and $2-per-day studies. Such underreporting is common in household surveys and can affect estimates of poverty and, in particular, deep poverty.
The CPS missed more than one-third of public assistance and food stamp benefits in 1995, or nearly $15 billion worth in 2004 dollars, according to data compiled by University of Chicago economist Bruce Meyer and his colleagues.[6] SIPP missed a smaller amount: $8 billion in 1995. Over the decade, moreover, the total amount of missing income from public assistance (AFDC, later TANF) and food stamps declined, by $1.7 billion between 1995 and 2004 in the CPS and by $0.9 billion in SIPP. This made it look like benefits were shrinking less than they really were. (2004 is the last year for which Meyer and colleagues provide the data needed for this comparison.)[7]
Is this decline in missed income large enough to obscure a rise in deep poverty rates in the CPS? The answer is yes. In a forthcoming analysis, my colleague Danilo Trisi and I look at trends in children’s deep poverty in the CPS before and after correcting for underreporting of three major benefits: TANF, SNAP, and Supplemental Security Income (SSI). Our corrections come from the Transfer Income Model (TRIM) microsimulation series, which the Urban Institute developed and has maintained over a period of decades for the Department of Health and Human Services.
Before correcting, our trend is roughly flat, similar to the trend line shown by Wimer et al. (in their Figure 9). But when we correct for the underreporting of TANF, SSI, and SNAP benefits, we see less deep poverty in any given year but a clear increase over time, from 2.1 percent in 1995 to 3.0 percent in 2005. (See Figure 1.) Although the story continued to evolve after 2005 — most notably, with the Great Recession and public responses to it — 2005 is an appropriate end point because labor-market conditions in that year (as measured by the unemployment rate) were comparable to those in 1995.
So what’s going on here? The key point is that in 1995, public assistance (then AFDC) mattered a lot — it kept 2.4 million children above 50 percent of the poverty line in the corrected CPS data. By 2005, TANF was a much smaller program, keeping only about 600,000 children out of deep poverty (using the corrected data).
In short, correcting the CPS trend for missing welfare payments reveals the extent to which the old AFDC program lessened deep poverty in 1995, as well as the subsequent increase in deep poverty when the program shrank. The SIPP data used by the Oxford and $2-per-day studies suffer from underreporting, too, but to a significantly smaller degree. They show an increase in deep and severe poverty even before correcting for underreporting.
Conclusion
By a number of careful measures, children’s deep and severe poverty rose significantly in the decade after the 1996 welfare law. This is troubling because, among low-income young children, modest changes in income can affect school achievement and other outcomes, and growing evidence indicates that deep poverty is a threat to children’s future success. This lesson is worth considering as policymakers consider proposals to alter the nation’s system of income assistance and support for poor families, including the poorest families with children.
End Notes
[1] Stephen Freedman et al., National Evaluation of Welfare-to-Work Strategies Evaluating Alternative Welfare-to-Work Approaches: Two-Year Impacts for Eleven Programs, U.S. Department of Health and Human Services, June 2000, page ES-35, Exhibit ES-10, www.mdrc.org/publication/evaluating-alternative-welfare-work-approaches/file-full. Ten of the 11 programs showed some increase in the share of participants below half the poverty line (six of them statistically significant), while nine showed declines in the overall poverty rate (five of them significant). Taking a simple average across all 11 sites, deep poverty rose by 2.7 percentage points while regular poverty declined by 2.1 percentage points. The study measured poverty using participant earnings, welfare, and food stamp income from administrative sources.
[2] Freedman et al., Exhibit ES-9, page ES-34.
[3] Marianne Bitler, Jonah Gelbach, and Hilary Hoynes, “What Mean Impacts Miss: Distributional Effects of Welfare Reform Experiments,” American Economic Review, vol. 96, no. 4 (September 2006), www.ssc.wisc.edu/~scholz/Teaching_742/Bitler_Gelbach_Hoynes.pdf.
[4] Yonatan Ben-Shalom, Robert A. Moffitt, and John Karl Scholz, “An Assessment of the Effectiveness of Anti-Poverty Programs in the United States,” prepared for the 2012 Oxford Handbook of the Economics of Poverty, chapter 22. A version of this study is available at: http://www.irp.wisc.edu/publications/dps/pdfs/dp139211.pdf.
[5] H. Luke Shaefer and Kathryn Edin, “Rising Extreme Poverty in the United States and the Response of Federal Means-Tested Transfer Programs,” National Poverty Center Working Paper 13-06, May 2013, http://www.npc.umich.edu/publications/working_papers/?publication_id=255&.
[6] Bruce D. Meyer, Wallace K.C. Mok, and James X. Sullivan, “The Under-Reporting of Transfers in Household Surveys: Its Nature and Consequences,” National Bureau of Economic Research working paper 15181, July 2009, http://www.nber.org/papers/w15181.
[7] Meyer and colleagues emphasize that the percentage of benefits underreported rose during this period. But their figures show that the number of assistance dollars missed by the CPS and SIPP fell, as policy changes enacted in 1996 dramatically reduced total benefit payments. In essence, the number of underreported AFDC/TANF dollars shrank in later years because the size of the program dwindled so rapidly.
More from the Authors

Areas of Expertise