Testimony of Jared Bernstein, Senior Fellow, Center on Budget and Policy Priorities, Before the Joint Economic Committee
Chairman Brady and Vice-Chair Klobuchar, I thank you for the opportunity to assess the current recovery and applaud the committee for taking up this important topic.
Introduction/Summary
The official dates of the last recession are from December 2007 — the peak of the previous recovery — to June 2009 — the trough of the downturn. Given that we now have at least some economic data through the first half of this year, it is important to assess the progress that’s been made over the first five years of recovery.
In a review of trends of key variables including real GDP, jobs, unemployment and other measures of labor market slack, my testimony shows the following:
- Thanks in part to countercyclical policies legislated by Congress in 2009, along with aggressive monetary policy by the Federal Reserve, significant progress has been made in repairing the damage done by the uniquely deep recession that began in late 2007.
- These gains, while incomplete, are evident in the job market, particularly in the recent acceleration in job growth and decline in unemployment. After 52 consecutive months of net private sector job growth, non-government employment is up 9.7 million jobs since early 2010.
- Moreover, employment growth has accelerated in recent months. Payrolls added 1.4 million jobs in the first half of this year, their strongest six-month growth period since late 1999.
- Un- and underemployment are both down significantly over the recovery, as are other slack metrics that rose sharply in the downturn, including long-term unemployment and involuntary part-time work. While part of the decline in unemployment was due to labor force exits, this negative trend has also stabilized in recent months.
- Private payrolls grew about 3% faster over the first five years of this recovery compared to the prior recovery, despite the fact that the recession that preceded this expansion was much deeper in terms of lost output and much longer lasting than the downturn that preceded the 2000s expansion. The private sector added 3.4 million more jobs in the first five years of this recovery than were added in the last one.
- Yet, slack remains in the job market and wage growth has generally not yet accelerated; real median household income, after falling sharply by around 10% in the downturn, is up about 3% over the past few years, largely due to more work at flat real earnings. Corporate profitability and financial market returns, on the other hand, have more than recovered their losses.
In other words, while there are many positive attributes to the current recovery, especially in relation to the depth of the recession that proceeded it, it is clearly not yet reaching everyone.
Looking back at the “Great Recession,” policy actions taken by the Obama administration (as well as the George W. Bush administration) and Congress (fiscal and financial stability policies) and the Federal Reserve (monetary policies) helped to stabilize key markets. Trends that were sharply negative, like real GDP, employment, or the increase in involuntary part-timers, either stabilized (employment rates) or started to grow (GDP, jobs). Though these actions have often been cast as ineffective or worse, the evidence points the other way. In this regard, the quick and forceful actions taken by some members of this committee and your colleagues back in the depth of the Great Recession were essential.
However, since then, factions within this Congress have far too often blocked measures that could have built on this stabilization, like the American Jobs Act or more recently, emergency unemployment compensation. Worse, Congress has at times imposed self-inflicted wounds on the economy, including the government shutdown, sequestration, and the threat to default on our national debt. The imposition of these headwinds has blocked progress on growth, jobs, and wages at a time when the opposite was needed. In fact, many of the same policy makers who today criticize the economic progress I’ll document have at the same time blocked legislative initiatives targeted at improving that progress. It’s one thing to critically point to the fire yet quite another to do so while blocking the hydrant.
I would thus summarize the message from this testimony as follows: when markets fail as massively as they did in the late 2000s, quick and forceful action clearly helps offset the damage. But to stop at stabilization, instead of rebuilding jobs and incomes that were lost over the downturn is a serious policy mistake, one that has proven to be extremely costly to working families. Still, as I conclude below, there is time to build on the recent momentum we’ve seen, particularly in the job market.
The testimony proceeds by briefly reviewing some salient facts about the sharp downturn that proceeded the recovery and the countercyclical policies, most notably the Recovery Act, that targeted this large market failure. I then look at indicators over the last five years of recovery with an emphasis on the labor market, including jobs, unemployment, the labor force, and wages. Next, I review policy actions and inactions that have hurt the recovery, largely by creating fiscal headwinds that taken as a whole pushed hard against growth and jobs. I conclude with some diagnoses and prescriptions to build on the recent progress, measures that I urge the committee to consider in the interest of generating full employment and more broadly shared prosperity.
The Damage Done By the Great Recession
Evaluating this recovery first requires examining the uniquely deep recession that proceeded it. Real GDP fell 4.3% from peak to trough, more than any other recession on record going back to the Great Depression. The average percent loss in real GDP in the prior seven downturns going back to the early 1960s was 1.3%. As officially dated, the Great Recession lasted 18 months, compared to the 10.2 months average length of every other post-war recession.
In the quarter before President Obama took office — 2008Q4 — real GDP declined at a nightmarish annual rate of 8.3%. Real investment, including businesses and housing, fell by over 30%. Employment fell by almost two million jobs in the last quarter of 2008 and by more than that — 2.3 million — in the first quarter of 2009. Home prices — and it was a housing bubble that was at the root of the market failure — were in the midst of what would ultimately be a 34% price decline (Case-Shiller 20-city index). The S&P 500 fell by half between October 2007 and March 2009.
As noted, the roots of the recession were a massive housing bubble inflated by reckless and under-regulated finance. Once the bubble burst, the loss of trillions in housing wealth generated a negative wealth effect that sharply reduced consumer spending and ushered in a protracted period of deleveraging of household balance sheets. In a 70% consumption economy like ours, the negative wealth effect from the loss of something like $8 trillion in housing wealth by itself ensured a deep demand contraction. In addition, research associated with economists Reinhardt, Rogoff, Koo, and Minsky all point to the particular tenacity of downturns born of underpriced risk in financial markets and the collapse in asset prices that inevitably follows.
In that regard, the extent to which countercyclical policy took effect, pulling the recovery forward and preventing the recession from becoming a depression was impressive. As I stress below, these efforts needed to continue longer than they did, but their effectiveness, reviewed next, is a matter of historical record.
The Countercyclical Policy Response
Less than four weeks into his first term, President Obama and Congressional Democrats passed the American Recovery and Reinvestment Act. A thorough review of the Act goes beyond my subject, which is the recovery that followed. But since the effectiveness of such policies is key to the later discussion and conclusion, I will note some salient facts regarding the Recovery Act and related policy actions.
The two figures below provide simple but compelling evidence regarding the impact of the Recovery Act and other countercyclical policies in play at the time. The first figure shows annualized quarterly changes in real GDP and the second shows monthly changes in total and private payrolls. A vertical line is drawn in February 2009 to show when the Recovery Act was passed.
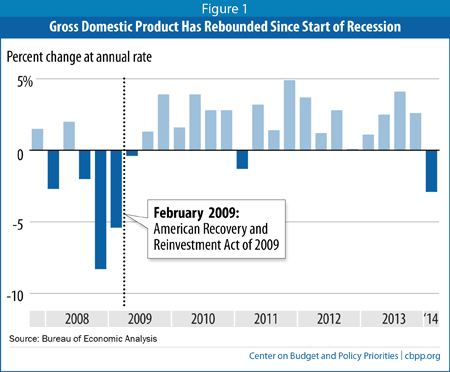
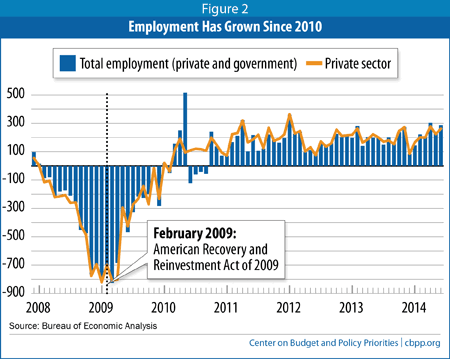
Even given the massive headwinds noted above — hundreds of billions lost to consumer spending due to the negative wealth effect from the housing bust, the crash of credit markets, deleveraging of balance sheets — real GDP growth quickly turned from large negatives to positives shortly after the Act went into effect. The magnitude of job losses almost immediately began to diminish, and private employment gains appeared in early 2010.
Much more thorough and systematic research has been done on the question of the impact of both the Recovery Act and other measures, including financial stability initiatives and the Fed’s monetary policy. In one of the most comprehensive studies of the impact of these measures, economists Alan Blinder and Mark Zandi concluded that the effects “…on real GDP, jobs, and inflation are huge, and probably averted what could have been called Great Depression 2.0. For example, we estimate that, without the government’s response, GDP in 2010 would be about 11.5% lower, payroll employment would be less by some 8½ million jobs, and the nation would now be experiencing deflation.”[1]
The table below shows a broad set of research findings on the impact of the Recovery Act on real GDP from many non-partisan sources, including CBO and various market analysts. Though the magnitude of the findings vary, the results are uniformly positive, showing in 2010, for example, that the Act raised the level of real GDP by between 0.7% percent and 4.1%, with an average value of 2.5%.
| Table 1 Estimates of the Effects of the Recovery Act on the Level of GDP | |||||
| Percent | |||||
| 2009 | 2010 | 2011 | 2012 | 2013 | |
| CEA: Model Approach | 1.1 | 2.4 | 1.8 | 0.8 | 0.3 |
| CBO: Low | 0.4 | 0.7 | 0.4 | 0.1 | 0.1 |
| CBO: High | 1.7 | 4.1 | 2.3 | 0.8 | 0.3 |
| Goldman Sachs | 0.9 | 2.3 | 1.3 | - | - |
| HIS Global Insight | 0.8 | 2.2 | 1.6 | 0.6 | - |
| James Glassman, JP Morgan Chase | 1.4 | 3.4 | 1.7 | 0.0 | - |
| Macroeconomic Advisers | 0.7 | 2.0 | 2.1 | 1.1 | - |
| Mark Zandi, Moody’s Economy.com | 1.1 | 2.6 | 1.7 | 0.4 | - |
| Note: Firm estimates were obtained from and confirmed by each firm or forecaster, and collected in CEA's Ninth Quarterly Report. Sources: Congressional Budget Office, Estimated Impact of the American Recovery and Reinvestment Act on Employment and Economic Output from October 2012 Through December 2012; CEA Ninth Quarterly Report; CEA calculations | |||||
The Recovery
As with the last few business cycle expansions, real GDP growth proceeded job growth. As can be seen in the first figure above, real GDP began to grow in the second half of 2009. Since the job market is the source of economic returns for the majority of working-age households and thus a key conduit by which macroeconomic growth reaches most households, I focus heavily on its progress in the recovery.
Employment began to grow in early 2010 and has since accelerated, particularly recently:
- Last month payrolls grew by 288,000 on net, the fifth consecutive month of payroll growth surpassing 200,000. For the first half of the 2014, payrolls were up 1.4 million jobs, the most first-half-year job growth in over a decade.
- Moreover, job growth has solidly accelerated in recent months. For example, over the past three months payrolls expanded by about 270,000 per month, compared to about 200,000 per month a year earlier (i.e., taking the same three month average from 2013Q2).
- The table below compares the growth in payrolls, both total and excluding government, over the first five years of the past three expansions, each of which were initially labeled “jobless recoveries,” because GDP growth proceeded job growth.
In popular discussion, the current jobs recovery is sometimes described as uniquely weak, but in fact, the pace of employment growth was considerably faster in this recovery compared to that of the 2000s. For example, private-sector payrolls grew by 4.7% over the first five years of the 2000s expansion, and 7.8% in this one. As the last column shows, that amounts to 3.4 million more private-sector jobs in this expansion versus the last expansion, five years out. This improved employment performance is particularly notable given how much deeper the last recession was relative to the brief and very shallow downturn in the early 2000s.
On the other hand, the 1990s recovery at age five was adding jobs at a faster clip than both of the next two recoveries.
| Table 2 Payroll Job Growth, Total and Private, First Five Years of Last Three Expansions | ||||
| Percent change | Millions of jobs | |||
| Total | Private | Total | Private | |
| This recovery | 6.0% | 7.8% | 7.8 | 8.5 |
| 2000s | 4.5% | 4.7% | 5.9 | 5.1 |
| 1990s | 9.6% | 10.4% | 10.4 | 9.4 |
| Source: Bureau of Labor Statistics, National Bureau of Economic Research (for recovery dating) | ||||
- Unemployment is now down to 6.1%, the lowest it has been since late 2008 and 3.9 percentage points down from its peak of 10% in late 2009. Importantly, the recent decline in the jobless rate occurred while the labor force participation rate was relatively constant. That implies that the fall in unemployment was due to job seekers finding work, not leaving the labor market, a problem I say more about below.
- Long-term unemployment (jobless for at least six months) also grew much more in this recession and the first few years of recovery far more than in the past. By late 2011, the long-term share of the unemployed peaked at 45% but it has been falling since and is now down to 33%. While that is welcome progress, it still represents an elevated share of long-termers among the unemployed.
- Underemployment, 12.1% last month, is down sharply from its peak of 17.1% in late 2009. This broader measure of labor market slack includes part-timers who would prefer full-time jobs but can’t find them. Last month, there were 7.5 million such underemployed workers, down 650,000 over the past year and 1.5 million over the five-years of the recovery.
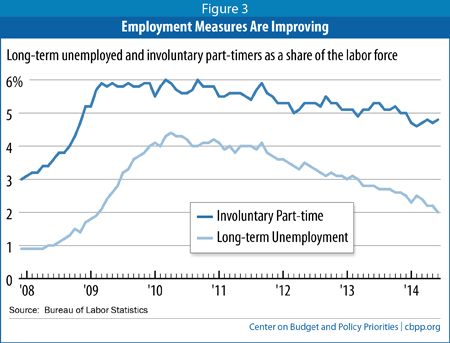
- Figure 3 shows both long-term unemployment and involuntary part-timers as a share of the labor force — two metrics that speak to the depth of labor market slack that grew sharply in the downturn and have slowly come down in the recovery. Long-term unemployment went from 1% of the labor force right before the recession began to slightly above 4% through 2010. Involuntary part-time work doubled as a share of the labor force, from 3% to 6%.
- As the job market began to improve, both these measures of slack have come down. Long-term unemployment has come down about two-thirds from its peak and involuntary PT, about 40%. Thus, both measures remain elevated but both are clearly improving as the recovery proceeds apace.
In sum, the labor market has improved considerably over the recovery and that the pace of recovery has accelerated in recent months. However, slack remains and while each of these indicators show improvement, they all remain elevated. In this regard, achieving the critical goal of full employment requires that both monetary and fiscal policy should be working to complement and accelerate these favorable trends. Unfortunately, as I stress in the next section, regarding the latter — fiscal policy — this has not always been the case.
Less favorable trends include the decline in the labor force participation rate, the flat employment rate, and wage trends.
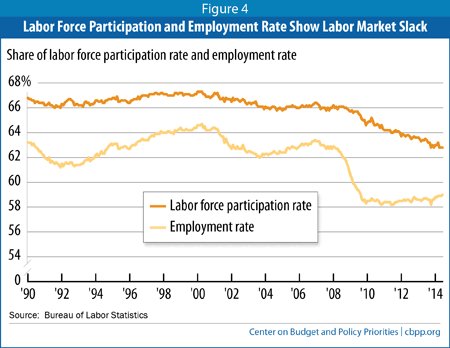
Figure 4 shows the share of the adult population in the labor force (i.e., either working or looking for work), otherwise known as the labor force participation rate, or LFPR, and employment as a share of the population. The employment rate fell sharply in the downturn, and stabilized in the recovery. Since its low point of 58.2% in mid-2011, it has slowly climbed a bit to 59%. Still, this trend reveals that employment growth has largely kept pace with population growth, a sign of insufficient labor demand.
The LFPR fell both in the Great Recession and through the recovery, shedding roughly three percentage points, from about 66% to about 63%. Since this is a steep decline of a critical growth input, much research has examined this trend.
There are three factors to consider in explaining the decline in the LFPR since the recession. First, aging demographics are in play, as the leading edge of the baby boom are hitting their retirement years. Second, weak labor demand has been a factor, clearly for the non-elderly, but likely for older workers as well, as their LFPRs were increasing before the recession. Third, as Jason Furman points out in a recent analysis, longer term secular trends in the participation rates of prime-age workers (25 to 54 year olds), especially men, have been flat or falling for decades.[2]
In other words, there are two secular trends — retirement and long-term stagnation of LFPRs for prime-age males — and one cyclical trend — weak labor demand — behind the decline in the LFPR. Though there is disagreement on the precise role played by each factor, my summary of that work is that about half of the three point decline is related to weak demand.
Importantly, that implies that stronger job growth and increased opportunities could thus stabilize and possibly — I’d say “probably” — reverse some of the decline. In this regard, it is highly notable that the LFPR appears to have stabilized in recent months. Since last August it has stayed within a 0.4 percentage point band, between 62.8% and 63.2%. The fact of this stabilization amidst accelerating job growth is a potentially favorable trend worth watching closely.
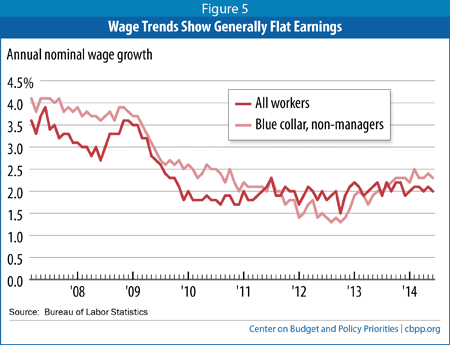
One of the most important reasons to squeeze slack out of the labor market is to generate faster wage growth. The figure below shows annual growth rates of nominal hourly wages for the overall average and for non-managers (i.e., blue collar workers in goods production and non-managers in services). As the deep slack in the job market operated with a lag, the pace of wage growth decelerated in 2009 and stabilized at around 2%. There does appear to some acceleration in the wage growth for the non-managers’ series, which bottomed out at around 1.5% in mid-2012 and is now growing about a point faster.
Given consumer inflation at about 2%, these nominal wage trends imply generally flat earnings in real terms. According to Sentier Research, a group that estimates the monthly growth in real median household income, this key measure of middle-class household living standards is up 3.3% over the past three years, likely representing the interaction between relatively flat real wages and more work, after falling about 10% between 2009 and 2011.[3] These modest gains should serve as an important motivator for policy makers to correct past policy mistakes that have slowed the recovery, as discussed in the next section.
Other favorable trends in the recovery include:
- As noted, the S&P 500 stock market index fell 50% over the downturn; since bottoming out in March of 2009, it has increased by 150%. Corporate profitability is up about 40% in real terms over the recovery.
- Housing prices are up 25% since their trough in early 2012.
Fiscal Headwinds and Self-Inflicted Wounds
As I stressed above, enough policy makers moved quickly in response to the sharp economic contraction that the recovery was “pulled forward” in time and many negative trends were stabilized or better. But starting in around 2010 and intensifying in later years, fiscal policy shifted from supporting the recovery to suppressing growth.
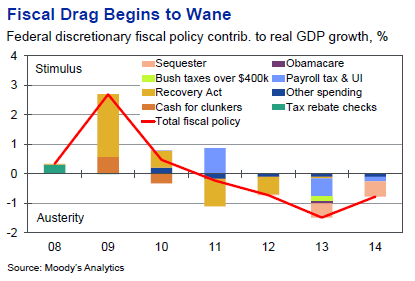
The two figures below, from Moody’s Analytics, show the impact of various fiscal policies on GDP growth. In the first figure, the parts of the bars above the zero line show periods of fiscal tailwinds, or “positive fiscal impulse” and vice versa regarding the bars below the zero line. The Recovery Act hit back hard in 2009 but as it wound down — too soon, given the depth of continued weakness — fiscal headwinds began to blow in. By 2012, fiscal policy turned negative in terms of growth and in 2013, the negative fiscal impulse took 1.5 percentage points off of GDP growth.
Using standard rules of thumb, that extent of fiscal drag meant the unemployment rate was 75 basis points (hundredths of a percent) above where it would have been in 2013 absent those headwinds. Given a 2013 labor force of 155 million that amounts to a loss of about 1.2 million jobs.
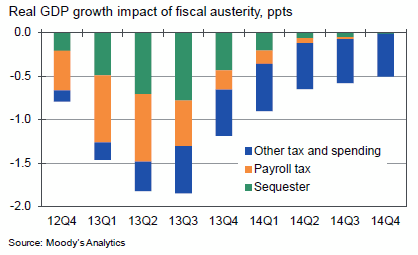
Moody’s second figure shows these same type of data but by quarter and isolating the impact of sequestration, along with the expiration of the payroll tax “holiday.” Note, for example, how the sequestration cuts were a significant contributor to fiscal drag in 2013 (though this effect was slightly offset by the bipartisan budget deal that reduced a portion of these spending cuts).
While fiscal drag represents actions taken that slowed GDP, job, and wage growth, Congress also failed to take actions throughout the recovery intended to promote growth and jobs. A salient example is the American Jobs Act, proposed by President Obama in September of 2011. The proposal included infrastructure investment, fiscal relief to strapped states, tax cuts targeted at workers and small businesses, and safety net measures targeted at the long-term unemployed. Independent analyses estimated that the act would boost real GDP growth by about 1.5%, generate about 2 million jobs, and lower the unemployment rate by about one point.[4]
In fact, some of these measures, like the payroll tax holiday and UI extension, saw the legislative light of day and they helped to generate some of the positive trends noted in earlier sections. But by failing to embrace the entirety of the act, Congress contributed to the fiscal drag shown in the above two figures.
The failure to further extend emergency unemployment compensation, despite the fact that long-term unemployment remains highly elevated, stands as the most recent example of recovery-enhancing actions not taken. According to analysis from the Center on Budget and Policy Priorities, almost 5 million unemployed persons will lose out of extended benefits this year.[5] This is harmful “micro-policy” in the sense that while labor market slack is clearly diminishing, it is still substantial, and many of these unemployed people still need benefits to meet their consumption needs. But it is also bad macro-policy in terms of contributing to fiscal drag, creating additional headwinds against the underlying improvements documented throughout.
Finally, the threat to default on our national debt, the government shutdown, and the disruption of normal budget processes giving rise to fiscal cliffs have also been negatives for the economy. Not only do such events cause uncertainty in markets, but in the case of the shutdown, activities are disrupted in large swaths of the real economy, from tourism to private sector firms that contract with the federal government. A recent CRS report cites three estimates of the negative impact of the 16 day shutdown in October 2013, ranging from one-quarter to one-half a percentage point of real GDP and over 100,000 jobs.[6]
Conclusion
At five years old, the US economic recovery is finally showing signs of strength, particularly in the job market, where employment growth has accelerated in recent months. In fact, compared to the last recovery, payrolls have grown considerably faster at this stage, a fact that is more remarkable when one considers how much deeper the “Great Recession” was compared to the very short and mild recession that proceeded the 2000s expansion.
Unemployment has come down as well, along with other measures of slack, including involuntary part-time work and long-term joblessness. Through much of the recovery, however, the decline in unemployment was partly a function of the decline in the labor force, some of which reflected (and continues to reflect) weak demand. However, in recent quarters, as employment growth has accelerated, the LFPR appears to have stabilized, a very important improvement if it sticks.
The history I briefly review shows that the policy response to the deep recession was effective and stabilized key variables that were deteriorating at an alarming rate. But stabilization is of course but the first responsibility of countercyclical policy. These measures ended too soon to build on that stabilization and move the job market more quickly back towards full employment wherein many more Americans could benefit from the growth we’ve seen over the past five years.
While the administration and some members of Congress have tried to build on the progress so far, they have been blocked by others who through both negative actions (e.g., shutdown, sequestration) and inaction (e.g., failure to extend emergency UI) have slowed the recovery and reduced both GDP and job growth.
Though gridlock too often blocks such progress these days, Congress could still take action to build on the recent momentum, improving both the quantity and quality of jobs. Investment in infrastructure would be particularly smart policy right now, as borrowing costs remain low and there is great need to improve the nations’ stock of public goods. While fiscal measures must always be weighed in terms of their impact on deficits, recent analysis by Laurence Ball et al shows that under current conditions, both the near and longer term economic payback to such investments would partially offset their costs.[7]
I should note that while the recent agreement to replenish the Highway Trust Fund is welcome in terms of maintaining our stock of public goods, such spending is already “in the baseline,” and thus such spending represents no new “fiscal impulse” that would be expected to add to jobs or growth (in other words, patching the fund “does no harm”).
Increasing the federal minimum wage to $10.10 and then indexing, as proposed by Sen. Harkin and Congressman Miller, would help ensure that low-wage workers get a boost from the recovery that their low-bargaining power has heretofore blocked. Considerable research shows that moderate increases such as the one proposed in the Fair Minimum Wage Act have their intended effect of raising the pay of low-wage workers without leading to large job displacements.[8]
Members of this committee have suggested other good ideas to help the recovery reach more people in the areas of job training, women’s financial security and equal pay, manufacturing policy, and extending emergency unemployment compensation.
The strong policy lesson of this recovery is that countercyclical policies work, but we must stick with them until the private sector demand contraction is solidly underway. Conversely, we’ve also learned that austerity and self-inflicted economic wounds do what most economists would expect: slow growth and dampen the pace of job gains.
While it would be naïve to ignore the sharp partisanship that prevails today, I still importune the members of this important and prestigious committee to apply these simple lessons in the interest of prolonging and strengthening our five year old recovery. Such actions would give the recovery a much better chance of reaching families that have thus far seen too little of it. Surely, we can all agree of the desirability of that outcome.
End Notes
[1] https://www.economy.com/mark-zandi/documents/End-of-Great-Recession.pdf
[2] http://www.washingtonpost.com/opinions/unemployment-is-down-and-we-still-have-work-to-do/2014/07/04/7172bee6-0383-11e4-b8ff-89afd3fad6bd_story.html
[3] http://sentierresearch.com/reports/Sentier_Household_Income_Trends_Report_May2014_07_02_14.pdf
[4] http://www.americanprogress.org/issues/labor/report/2011/09/14/10246/the-american-jobs-act/
[5] https://www.cbpp.org/cms/index.cfm?fa=view&id=4060
[6] http://fas.org/sgp/crs/misc/R43292.pdf
[7] http://www.pathtofullemployment.org/wp-content/uploads/2014/04/delong_summers_ball.pdf