SNAP Error Rates at All-Time Lows
Steady Improvement in Payment Accuracy Reflects Program’s Extensive Quality Control System
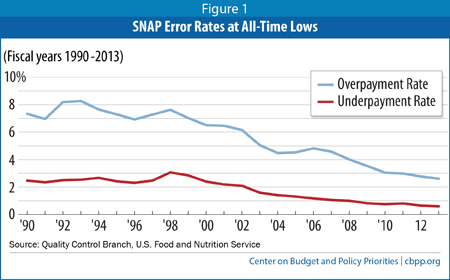
The percentage of SNAP (formerly food stamp) benefit dollars issued to ineligible households or to eligible households in excessive amounts fell for the seventh consecutive year in 2013 to 2.61 percent, newly released U.S. Department of Agriculture (USDA) data show. That’s the lowest national overpayment rate since USDA began the current system of measuring error rates in 1981. The underpayment error rate fell to 0.6 percent, also the lowest on record. (See Figure 1.) The combined payment error rate — that is, the sum of the overpayment and underpayment error rates — fell to an all-time low of 3.2 percent.[1] Less than 1 percent of SNAP benefits go to households that are ineligible. In other words, more than 99 percent of SNAP benefits are issued to eligible households.
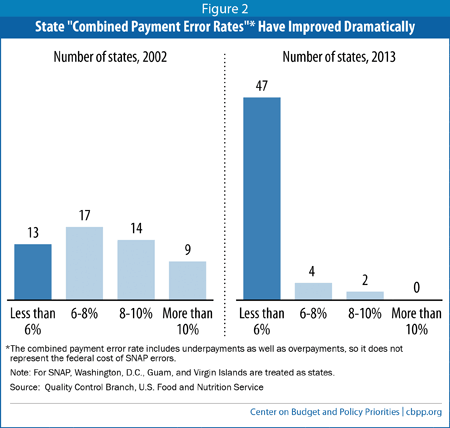
SNAP error rates declined nearly every year from 1998 to 2008 and have continued to improve since then, despite the large growth in SNAP caseloads during 2008-2013, which primarily resulted from the recession and weak economic recovery. Between 2002 (when new rules for penalizing states with high error rates took effect) and 2013, the number of states with combined error rates over 10 percent fell from nine to zero and the number of states from 6 to 10 percent fell from 31 to six; meanwhile, the number of states with combined error rates under 6 percent, which prior to 2003 was the standard for enhanced funding for outstanding performance, jumped from 13 to 47.
These improvements reflect federal and state actions to simplify program administration and improve efficiency while also making SNAP more accessible to eligible households. Even as SNAP achieved record-low error rates, SNAP participation among eligible people rose from 54 percent in 2002 to 79 percent in 2011.
SNAP Has Extensive Quality Control System
SNAP, the Supplemental Nutrition Assistance Program, has long had one of the most rigorous systems of any public benefit program to ensure payment accuracy. When policymakers enacted the Improper Payments Act in the early 2000s to establish a framework for federal agencies to reduce improper payments, SNAP was among the few programs to meet its high standards. Emphasis on achieving and maintaining low error rates pervades the culture of the SNAP program. USDA and the states, which administer SNAP under federal guidelines, monitor SNAP error rates throughout the year and share best practices, and a significant number of federal and state personnel are assigned to program integrity. [3] The error rate is the major performance measure for accountability at local and county SNAP offices and even for individual state workers.
States determine SNAP eligibility and benefits based on a household’s income, certain deductible expenses, and household characteristics. Households applying for SNAP report their income and other relevant information; a state eligibility worker interviews a household member and verifies the accuracy of the information using data matches, paper documentation from the household, or by contacting a knowledgeable party, such as an employer or landlord. Households must reapply for benefits periodically, usually every six or 12 months, and between reapplications must report income changes that would affect their eligibility.
In addition, the SNAP quality control system requires states each month to select a representative sample of SNAP cases (totaling about 50,000 cases nationally over the year) and have independent state reviewers check the accuracy of the state’s eligibility and benefit decisions within federal guidelines. Federal officials then re-review a subsample of the cases to ensure accuracy in the error rates. USDA annually releases state and national error rates based on these reviews. States are subject to fiscal penalties if their error rates are persistently above the national average. The quality control process also is used for awarding certain performance bonuses, as discussed below.
Federal Penalties Target States With Persistently High Error Rates
The current system for measuring payment errors has been in place, without significant revision, since the early 1980s. The 2002 Farm Bill, however, significantly revised how USDA assesses fiscal sanctions against states based on their error rates.[4] The new rules focus monetary penalties on a smaller number of states with persistently higher-than-average error rates, instead of a large number of states with minor problems. Previously a state was subject to penalty if its combined error rate exceeded the national average for the year, so roughly half the states were identified as poor performers each year even when error rates were improving nationally. Under the revised rules, states are penalized if, with a high statistical likelihood, their combined payment error rates exceed 105 percent of the national average for two straight years; states that exceed the 105 percent threshold for one year are warned of likely sanctions in the following year unless they improve.[5]
The 2002 changes eased the pressure on states to adopt policies that reduce errors but at the expense of impeding access to the program among eligible households. SNAP participation rates among those eligible rose substantially over the next decade (from 54 percent in 2002 to 79 percent in 2011), even as SNAP achieved record-low error rates.
2014 Farm Bill Modestly Tightened SNAP Quality Control Rules
The Agricultural Reform Act of 2014 made three modest changes to SNAP rules on error rates, as well as the bonuses and penalties based on the error rates.
First, it lowered SNAP’s “tolerance level” for small errors. To encourage states to focus on the costliest types of errors, SNAP’s quality control rules have long had a “tolerance” level below which errors in a household’s benefits don’t count toward the state’s error rate. The 2014 Farm Bill set this tolerance level at $37 (in monthly benefits in error) for fiscal year 2014, adjusted annually thereafter for inflation. From 2000 to 2009, the tolerance level was set at $25, with no inflation adjustment. Congress temporarily raised the tolerance level to $50 in the 2009 Recovery Act to respond to states’ concern that the Recovery Act’s temporary SNAP benefit increase would raise states’ error rates without indicating any deterioration in program administration.
USDA sought to maintain the $50 tolerance level through regulation, but the Farm Bill overrode that proposal by setting the tolerance level at $37 (which is what the $25 from 2000 would be if it had kept pace with inflation) and indexing it thereafter. This change will raise state error rates slightly in 2014, all other things being equal.
Second, the Farm Bill eliminated the Agriculture Secretary’s authority to waive certain penalties imposed under the quality control system. States with payment error rates above the national average over several years must implement a correction plan and are assessed monetary penalties. Since state error rates can spike due to changes in policies, technology, the types of households served, or economic conditions, prior SNAP law gave the Secretary the option of waiving a penalty the year it was assessed. The Farm Bill eliminated this authority. The Secretary has not used this authority in recent years, so the change should not have a significant effect on states.
Finally, the Farm Bill requires states receiving SNAP performance bonuses to reinvest them in SNAP to improve technology, administration, and program integrity. Some states had deposited the bonuses into the state general fund, absent clear direction from the federal government. This change ensures that the incentive payments stay in SNAP.
SNAP error rates reached all-time lows at the same time that SNAP caseloads grew because of the economic downturn. The number of SNAP households rose by almost 90 percent between 2007 (before the recession) and 2012. Over this same period, state and federal administrative costs to certify SNAP eligibility rose by about 30 percent, after accounting for inflation.[6] These increased investments in SNAP administration likely contributed to improved payment accuracy. The fact that states continued to reduce SNAP errors even as their caseloads grew much faster than their administrative funding shows that they have improved their efficiency and operations.
Combined Error Rate Does Not Measure Excessive Federal Spending
USDA issues three SNAP payment error rates. The overpayment error rate counts benefits issued to ineligible households or to eligible households in excess of what program rules direct. The underpayment error rate measures errors in which eligible, participating households received smaller benefits than program rules direct. The combined payment error rate is the sum — not the net — of the overpayment and underpayment error rates.
Thus, for example, a state with a 3 percent overpayment error rate and a 1 percent underpayment error rate would have a combined error rate of 4 percent, even though the net loss to the federal government from errors in that state’s program (that is, the benefits lost through overpayments minus those saved by underpayments) would be only 2 percent.[7] And even the 2 percent net figure overstates the federal cost of SNAP errors, since it doesn’t account for the benefits that eligible households didn’t collect due to improper denials and terminations. Thus, while media reports (and some policymakers) sometimes treat the combined error rate as a measure of excessive federal spending, it isn’t.
Relatively few SNAP errors represent dishonesty or fraud on the part of recipients, such as lying to eligibility workers to get benefits. By its very nature, fraud is difficult to measure accurately, but the overwhelming majority of SNAP errors appear to result from honest mistakes by recipients, eligibility workers, data entry clerks, or computer programmers. States report that almost two-thirds of all overpayments and 90 percent of underpayments in recent years were their fault; most others resulted from innocent errors by households.[8] SNAP has numerous anti-fraud measures in place, including sophisticated computer matches to detect unreported earnings, extensive requirements that households applying for or seeking to continue receiving SNAP prove their eligibility, and administrative and criminal enforcement mechanisms.
It should be noted that an overpayment is counted in a state’s error rate whether or not the overpaid benefits are collected back from households. In fiscal year 2012, states collected over $300 million in overissued benefits.
Drop in Errors Has Been Widespread
For 2013, USDA is imposing fiscal sanctions on four states and identifying 13 others as poor performers at risk of fiscal sanctions next year, the new report shows. Because the sanctions are tied to the national average error rate, which has dropped significantly in recent years, most of these states would not have been considered poor performers in the past. In fact, 11 of them (Arizona, Colorado, Georgia, Hawaii, Kentucky, Nevada, New Mexico, New York, North Carolina, West Virginia, and Wyoming) have combined error rates below 6 percent, which prior to the 2002 Farm Bill would have qualified them for enhanced funding for exceptional performance.[9]
The large drop in state error rates has dramatically raised the bar for enhanced funding. In 2002, the 13 states that received enhanced funding had an average combined payment error rate of 4.6 percent; in 2013, the 11 states that received bonuses based on low or most improved payment error rates had an average combined payment error rate of just 1.6 percent.
High Improper Benefit Denials Raise Concerns
USDA also informed states of their “case and procedural error rates” (CAPERs), which measure whether the state properly denied, suspended, or terminated SNAP benefits to certain households and properly notified those households of its decision.[11] USDA and states in 2012 implemented new procedures for these error rates, which now hold states more accountable for the timeliness, accuracy, and clarity of the notices states send to households regarding their decision.
Nationally, in 2013 about one-quarter of states’ actions to deny or terminate SNAP benefits were found to be improper. Eight states’ CAPERs approached or exceeded 50 percent.[12] The CAPER is not directly comparable to the overpayment and underpayment error rates. It is based on a separate state sample of denials, suspensions, and terminations, and the review of the state’s decision is not as rigorous as for the payment errors. USDA does not assess or report whether the household was ineligible for a reason other than the reason given by the state or the amount of benefits that improperly denied households would have received. Also, states are not penalized for persistently high CAPERs (though they can receive a performance bonus for low or improving CAPERs, as discussed below). Nonetheless, the high CAPERs in many states raise concern.
Decline in Error Rates Reflects Both State and Federal Actions
The significant drop in SNAP error rates over the past decade likely reflects a combination of state and federal actions. In the early 2000s states began taking advantage of various options, created by federal legislation and regulation, to simplify administration and lower their exposure to quality control errors. Options such as simplifying reporting rules, providing transitional benefits to households leaving cash assistance, aligning income and asset rules with other programs, and raising the asset test have helped states streamline program administration, thereby reducing errors in eligibility and benefit calculations, while improving access to SNAP at the same time.
In addition, states have improved coordination between their quality control and certification staff to properly identify the root causes of errors and modify policies and procedures to address problems as they arise. In particular, states have placed greater emphasis on reviewing each error, clarifying or changing policies that may lead to inadvertent errors, and enhancing training of eligibility workers to ensure consistent application of policy and procedures.
States also have made use of improved technology to upgrade their eligibility systems and introduce electronic document management systems, both of which can limit human error. And they have made greater and more efficient use of electronic data matching to verify information that households provide.
“Trafficking” of SNAP Also Down Substantially
Another area of program integrity in which SNAP has made considerable improvements is trafficking, or the sale of SNAP benefits for cash, which violates federal law. USDA has cut trafficking by three-quarters over the past 15 years. Only 1 percent of SNAP benefits are trafficked.
A key tool in reducing trafficking has been the replacement of food stamp coupons with electronic debit cards like the ATM cards that most Americans carry in their wallets, which recipients can use in the supermarket checkout line only to purchase food.
Sophisticated computer programs monitor SNAP transactions for patterns that may suggest abuse; federal and state law enforcement agencies are then alerted and investigate. Retailers or SNAP recipients who defraud SNAP by trading their benefit cards for money or misrepresenting their circumstances face criminal penalties.
Over the years, USDA has sanctioned thousands of retail stores for not following federal requirements. In fiscal year 2013, USDA permanently disqualified over 1,200 SNAP retailers for program violations and imposed sanctions, through fines or temporary disqualifications, on another 785 stores. While individual cases of SNAP fraud sometimes receive widespread news coverage, it is important to remember that they have come to light because the offenders have been caught, evidence that states and USDA are combating fraud.
Finally, states and USDA have focused on improved “business processes” to more efficiently manage the certification process. For decades human services agencies used a caseworker-based approach where each household had a dedicated social worker who interviewed a household member in person, collected documentation, and processed eligibility. Many states are now moving to “tasked-based” systems with more standardized processes in which individual staff focus on completing specific steps in the certification process. The goal is to increase efficiency by removing bottlenecks and having staff “touch” each case fewer times.
As part of these efforts, states have improved their ability to assess cases so that they spend less time on simpler cases (such as households with more stable income sources, like Social Security, or those temporarily without income because of unemployment) and more time on harder cases (such as households with fluctuating wages, self-employment income, or complex out-of-pocket medical expenses.[13]) Under the old model, every household had an hour (or longer) in-person interview, which was not necessary in every instance. These changes have helped states identify more error-prone cases and address the issues most likely to result in errors.
Two less tangible factors may also contribute to states’ improving performance. The first is USDA’s consistent emphasis on payment accuracy and program integrity; state error rates are still the primary measure of state performance in administering SNAP and the only one to which fiscal penalties apply. The second is a likely snowball effect across the states: when many states, especially large states, lower their error rates, they share their best practices with other states and their success motivates other states to follow suit.
Encouraging States to Reduce Errors and Improve Access
Leading up to the 2002 Farm Bill, a consensus emerged among states, advocacy groups, USDA, and other policymakers that SNAP’s error rate system encouraged states to lower error rates in ways that often made it harder for eligible families to obtain SNAP benefits.
The system measured only how well states performed with respect to payment accuracy. This had a perverse effect: states that made it harder for eligible working-poor families to participate in SNAP often were rewarded with bonuses because their error rates were relatively low. (Working-poor families’ incomes often fluctuate depending on their hours of work, amount of overtime, loss of work due to sick days, and so on. As a result, it is harder for states to determine SNAP benefit levels for working-poor families with precise accuracy, making such families more “error prone.”) In contrast, states that tried to reach all eligible households, including those with more complex circumstances like the working poor, were more likely to have high error rates and thus face fiscal sanctions.
The 2002 Farm Bill established a more balanced program accountability system. While maintaining the strong focus on program integrity and low error rates, it also measures how well states serve eligible households and act promptly when eligible households apply for assistance. Specifically, USDA awards $48 million in state performance bonuses each year to the top and the most improved state performers across four measures:[14]
- Payment accuracy ($24 million): as measured through the combined payment error rates, discussed above.
- Case and procedural error rate ($6 million): also discussed above, the CAPER measures the appropriateness of state actions in denying, suspending, or terminating SNAP benefits.
- Application processing timeliness ($6 million): measures states’ performance in processing SNAP applications and providing SNAP benefits within federal timelines (seven days for destitute households eligible for expedited service, 30 days for other households).
- Program access index ($12 million): separate from the quality control system, USDA measures states’ success in reaching eligible low-income individuals, based on an estimate of the number of SNAP participants as a share of all individuals in the state with incomes below 125 percent of the poverty line.[15]
This system has produced very beneficial results. Error rates have dropped dramatically and SNAP participation by eligible households has improved (the program access index rose from 62 percent in 2003 to 74 percent in 2012).
States have used these incentive funds to make further program improvements — online application systems, eligibility worker training and related steps to increase efficiency and further lower error rates, improved data matching to verify household earnings, and job training for unemployed SNAP recipients. A number of states have also provided some of their incentive funding to food banks to help them meet the needs placed upon them.
Conclusion
A careful look at the facts disproves critics’ claim that SNAP is riddled with waste, showing instead that USDA and states have achieved impressive results in recent years, racking up the lowest error rates on record.
This success is no accident; USDA and states devote significant resources and attention to measuring accuracy, carefully monitoring performance, and developing and sharing ways to enhance their efforts. The success is even more remarkable given their increased workload in recent years due to the most serious recession in SNAP’s history and the slow recovery.
End Notes
[1] See http://www.fns.usda.gov/snap/quality-control.
[2] See gross tax gap figure from: Internal Revenue Service, “Tax Gap for Tax Year 2006, Overview,” January 6, 2012, http://www.irs.gov/pub/newsroom/overview_tax_gap_2006.pdf.
[3] SNAP benefits are federally funded. States and the federal government share SNAP’s administrative costs, including certifying eligibility, issuing benefits, and ensuring program integrity.
[4] For details on the quality control changes in the 2002 Farm Bill, see, “Food Stamp Overpayment Rate Hits Record Low,” Center on Budget and Policy Priorities, July 8, 2003, at https://www.cbpp.org/sites/default/files/atoms/files/4-30-01fs.pdf.
[5] A state’s financial penalty is based on the amount by which its combined payment error rate exceeds 6 percent, so states with error rates over 105 percent of the national average (with a high degree of statistical likelihood), but below 6 percent are not subject to a penalty. Such states, however, are notified that they are at risk of sanction the following year.
[6] Administrative costs are from U.S. Department of Agriculture, Food and Nutrition Service, “SNAP State Activity Reports,” http://www.fns.usda.gov/pd/snap-reports#qc-annual. We include “Certification Costs,” “ADP Development Costs,” and “ADP Operations Costs.” The latter two categories are the costs states incur for the computer systems they use to determine eligibility.
[7] To be sure, these savings are not sought or desired by either federal or state agencies. But in calculating the net cost to the federal government of errors, or the difference between the actual cost of the program and what it would cost in the absence of errors, the value of benefits not provided due to underpayments must be subtracted.
[8] USDA, SNAP Quality Control Annual Reports, available at http://www.fns.usda.gov/pd/snap-reports#qc-annual and http://www.fns.usda.gov/snap/qc/pdfs/SNAP_QC_2012.pdf. In fiscal year 2012, over 90 percent of all overpayments states established were classified as non-fraud. Some of these were innocent errors by households; others were mistakes the states themselves made. See, USDA, SNAP State Activity Report, Fiscal Year 2012, http://www.fns.usda.gov/sites/default/files/2012_state_activity.pdf.
[9] The other six states USDA identified as poor performers in 2013 (with error rates at or above 6 percent) are Connecticut, District of Columbia, Guam, Montana, Rhode Island, and Vermont.
[10] Several other states have error rates in 2013 that are slightly higher than in 2002, but by less than one percentage point.
[11] The CAPER, which replaced what was known as the “negative error rate,” is separate from the underpayment error rate, which covers cases where states gave some benefits but not as much as the household should have received under SNAP rules.
[12] The eight states are Colorado, Connecticut, Guam, Minnesota, New Jersey, New Mexico, Nevada, and North Carolina.
[13] Households containing wage earners historically have had higher error rates than those that rely solely on public assistance, Supplemental Security Income, or Social Security. This is because many low-wage workers experience fluctuations in their earnings because of changing jobs or being asked to work a different number of hours week-to-week or month-to-month. If eligibility workers fail to adjust their benefit levels correctly each time, an over- or underpayment is likely to result. By contrast, welfare payments typically come in the same amount each month. (Moreover, since the government initiates any changes, states can plan for them in calculating recipients’ SNAP allotments.)
[14] Recent performance bonus awards are available at http://www.fns.usda.gov/snap/snap-program-improvement.
[15] See, “Calculating the Supplemental Nutrition Assistance Program (SNAP) Program Access Index: A Step-by-Step Guide for 2012,” USDA, Food and Nutrition Service, February 2014, at http://www.fns.usda.gov/sites/default/files/PAI2012.pdf. USDA also publishes another, more rigorous measure of SNAP participation rates at the national and state levels. See http://www.fns.usda.gov/supplemental-nutrition-assistance-program-participation-rates-fiscal-years-2010-and-2011 and http://www.fns.usda.gov/reaching-those-need-state-supplemental-nutrition-assistance-program-participation-rates-2011.
More from the Authors