Various Supports for Low-Income Families Reduce Poverty and Have Long-Term Positive Effects On Families and Children
Since the Great Depression, the United States has developed a set of supports to help low-income families, seniors, children, and people with disabilities make ends meet and obtain health care. Extensive research indicates that these supports lift millions of Americans out of poverty, help “make work pay” by supplementing low wages, and enable millions of Americans to receive health care who otherwise could not afford it.
To be sure, the United States still has a higher poverty rate than many other advanced countries, and many Americans reach adulthood without the tools they need to succeed in the workforce. Various programs and policies, especially in areas such as job training and education, could be reformed and strengthened. But the claim that advocates of shrinking government sometimes make that public efforts to reduce poverty and hardship have failed is belied by the evidence.
-
Federal assistance lifts millions of people, including children, out of poverty and provides access to affordable health care. Public programs lifted 40 million people out of poverty in 2011, including almost 9 million children, according to the Census Bureau’s Supplemental Poverty Measure, which counts non-cash benefits and taxes.[2] While Social Security lifted the largest number of people overall out of poverty, the Earned Income Tax Credit (EITC) lifted the largest number of children. Together, the EITC and Child Tax Credit (CTC) lifted 9.4 million people — including nearly 5 million children — out of poverty in 2011.
Similarly, Medicaid provided access to affordable health care to 66 million Americans in 2010. Because of Medicaid and the Children’s Health Insurance Program (CHIP), children are far less likely to be uninsured than adults. (For more on this issue, see “Assistance Programs Reduce Poverty and Number of Uninsured,” below.)
-
Programs like SNAP (food stamps), the EITC and CTC, and Medicaid support millions of low-income workingfamilies and help promote work. Thirty years ago, Medicaid and SNAP largely served families that received public assistance and were not working. In addition, the EITC was tiny: for a full-time, minimum-wage worker, the EITC only offset the employee share of his or her payroll taxes, and millions of low-wage families were taxed into, or deeper into, poverty.
The situation is very different today. The EITC and CTC both offset payroll taxes and lift a family of four with a full-time, minimum-wage worker from 61 percent of the federal poverty line to 87 percent. In addition, most of the children receiving Medicaid or CHIP are in low-wage working families. And, among families with children that receive SNAP in a given month and include an adult who isn’t elderly or disabled, 87 percent worked in the prior year or will work the following year. (For more on this issue, see “Safety Net Supports Working Families and Promotes Work,” below.)
-
Researchers have identified long-term payoffs to programs like SNAP, EITC, early childhood education, and Pell Grants. Research shows that income supports like the EITC and CTC both boost employment rates among parents and have long-term positive impacts on children — including better school performance — that can translate into higher earnings when the children become adults. Similarly, a recent study that examined what happened in the 1960s and 1970s — when government first introduced food stamps county by county — found that children born to poor women who had access to food stamps had better health outcomes.
In addition, housing assistance eliminates several factors that can impair children’s academic achievement, such as frequent moves and school transitions as well as homelessness. Pell Grants reduce the likelihood that low-income students will drop out of college. Long-term studies that followed children who participated in Head Start have found that it raises school completion rates and improves other outcomes years later. (For more on this issue, see “Programs Improve Long-Term Outcomes, Particularly for Children,” below.)
These longer-term gains may relate to recent research showing that children who live in poverty can face increased intense stress, the physiological effects of which can impede their ability to learn and do well in school. This may help to explain why emerging research finds that significantly increasing the incomes of poor families, through measures like the EITC, produces gains in educational attainment and test scores — outcomes that, in turn, are associated with increased earnings and employment when the children reach adulthood. (For more on this issue, see the box, “Emerging Research on Connections Among Poverty, High Levels of Stress, and Child Outcomes,” below.)
Assistance Programs Reduce Poverty and Number of Uninsured
Census data show that, as a group, programs that help families struggling to afford the basics are effective at substantially reducing the number of poor and uninsured Americans.
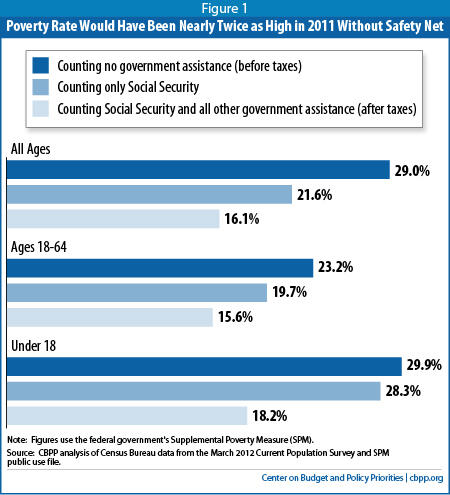
Taken together, federal benefits kept 40 million people who otherwise would be poor out of poverty in 2011, including 8.7 million children, according to the Census Bureau’s Supplemental Poverty Measure (SPM). See Appendix Table 1 for state-by-state figures. (Among its differences from the official poverty measure, the SPM counts non-cash benefits such as SNAP and housing assistance as income, and considers the net effect of taxes — including both taxes paid and refundable credits received — on income when determining whether a family or individual’s income is below the poverty line. These are improvements that analysts across the political spectrum broadly favor. The “official” poverty measures, by contrast, considers only cash income and ignores the role of taxes.)
Social Security had the largest effect on poverty — keeping 26 million people above the poverty line, including 16 million seniors. But other key programs keep millions of Americans out of poverty as well.
- The EITC lifts more children out of poverty than any other program (and is the most effective program other than Social Security at lifting people out of poverty overall). The EITC kept 6.1 million Americans, including 3.1 million children, out of poverty in 2011. As noted above, the EITC and CTC together kept 9.4 million people — including nearly 5 million children — out of poverty.[3]Image
- SNAP kept 4.7 million Americans, including 2.1 million children, out of poverty in 2011,[4] and is particularly effective at keeping children out of severe poverty — that is, out of living below half of the poverty line. In 2011, SNAP lifted more children — 1.5 million — above half of the poverty line than any other program.
- Unemployment insurance (UI) payments have been especially important in the current weak economy. UI kept 3.5 million Americans above the poverty line in 2011, including nearly 1 million children.
Medicaid and CHIP provided health insurance to 66 million Americans during 2010 — roughly 32 million children, 18 million parents, 10 million people with disabilities, and 6 million seniors. Medicaid and CHIP have greatly reduced the numbers of uninsured children and now provide coverage to most low-income children. Due to Medicaid and CHIP, children are much less likely than non-elderly adults to be uninsured. Some 9.4 percent of children were uninsured in 2011, compared to 21.2 percent of non-elderly adults.[6]
To be sure, some critics question the effects of safety net programs on individual behavior, such as work effort, and how that affects poverty. Several of the leading researchers in the field have conducted a comprehensive review of the available research and data on how safety net programs affect poverty, and the National Bureau of Economic Research (NBER) has published their results. They found that, after accounting for what the research finds to be modest overall behavioral effects, the safety net lowers the poverty rate by about 14 percentage points. In other words, one of every seven Americans would be poor without the safety net but is above the poverty line because of it. That translates into more than 40 million people.[7]
Safety Net Supports Working Families and Promotes Work
Over the past three decades, policymakers changed the safety net substantially so that it now does much more to promote work and support low-income working families whose earnings aren’t high enough to make ends meet — and much less to support low-income families that lack earnings.
Thirty years ago, the main assistance programs for families with children were the Aid to Families with Dependent Children (AFDC) program, Medicaid, food stamps, and a very small EITC. AFDC provided assistance largely to single mothers during periods of joblessness; if a mother earned too much to qualify, she would lose not only income assistance but also Medicaid. Medicaid generally covered only parents and their children as well as elderly and disabled people who received cash welfare benefits; the working poor did not qualify. Far fewer households with children that received food stamps were working. The EITC did little more than offset some of the payroll taxes that working poor families owed. Child care assistance mainly supported those families receiving AFDC who were in education or training programs; it did little to assist the working poor.
The situation is very different today.
Refundable Tax Credits
Tax credits do much more today to “make work pay” than 30 years ago. In 1983, the EITC was not large enough to offset the total payroll taxes of a family of four with a full-time, minimum wage worker, leaving this family well below the poverty line. Today, the EITC and CTC lift such a family much closer to the poverty line, even after accounting for the payroll taxes they pay.
- In 1983, a full-time, minimum wage worker earned about $6,700 per year and was eligible for a maximum EITC of $500, about equal to the employee’s share of payroll taxes.[8] The worker’s earnings equaled about 66 percent of the poverty line for a family of four[9] and, once the worker’s payroll taxes and EITC were figured in, the worker’s income was virtually unchanged at 67 percent.[10]
- Today, a full-time, minimum wage worker earns only 61 percent of the poverty line for a family of four. But, after accounting for the family’s earnings, payroll taxes, and both the EITC and CTC, the family’s income rises to 87 percent of the poverty line, a significant improvement in that family’s economic well-being.
For families that have very low earnings and are just gaining a toehold in the labor market, the size of their EITC and CTC increases as the families’ earnings rise, countering the phase-down of some other benefits that fall as earnings rise.[11] These tax credits boost the families’ overall income and strengthen incentives to work.
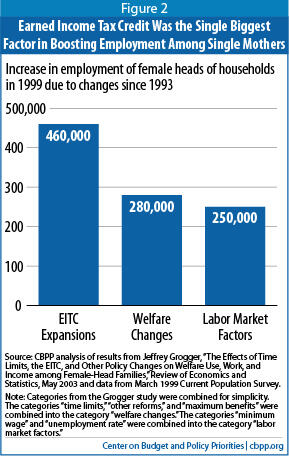
The EITC promotes work, as numerous studies have found. “The overwhelming finding of the empirical literature is that the EITC has been especially successful at encouraging the employment of single parents, especially mothers,” write economists Nada Eissa of Georgetown University and Hilary Hoynes of the University of California at Davis.[12] While policymakers often point to the 1996 welfare law’s creation of TANF as the main reason for increased work among single mothers, the research indicates that the EITC expansion of the 1990s had an even larger effect in producing those gains.[13] (The EITC expansions and the changes in welfare reinforced each other in inducing more single mothers to work.)
Research also shows that, by boosting employment among single mothers, the EITC has produced large declines in the receipt of cash welfare assistance:
- The EITC expansions of the 1990s moved more than half a million families from cash welfare assistance to work, according to research by economists Stacy Dickert of Michigan State University, Scott Houser of the Colorado School of Mines, and John Karl Scholz of the University of Wisconsin-Madison.[14]
- The EITC likely contributed about as much to the decline in the receipt of cash welfare assistance among female-headed families in the 1990s as did time limits and other welfare reforms, according to the University of Chicago economist Jeffrey Grogger’s study of the effects of welfare time limits, the EITC, and other policy changes implemented from 1993 to 1999.[15]
Most EITC recipients claim the credit for short periods (a year or two) and mostly to offset the temporary costs of a child’s birth or a spouse’s loss of income. Most EITC recipients pay more in federal taxes over the long run than they receive in EITC benefits. [16]
Finally, as discussed below, research suggests that income supports like the EITC have a positive impact on children’s educational outcomes and later employment success, indicating that the EITC promotes work for multiple generations.
Medicaid
Before the Medicaid expansion of the early 1980s, children and parents who received AFDC qualified for Medicaid but children in working-poor families did not. Today, virtually all low-income children are eligible for Medicaid or CHIP, and only a small fraction of the children receiving coverage through these programs also receive cash welfare assistance. Most children covered by Medicaid or CHIP are in low-income working families.
Among parents, the story is different. Although substantial numbers of working-poor parents are eligible for Medicaid, many are not because most states have set eligibility limits for parents far below the poverty line. Working-poor parents lose eligibility for Medicaid in the typical state when their earnings reach just 61 percent of the poverty line.
Low-Income Programs Have Modest Administrative Costs
Public programs bear administrative costs to assure program integrity (i.e., that the people served are truly eligible and that the programs provide the appropriate level of benefits and services to eligible recipients). But the administrative costs in the major means-tested programs are modest.
A recent examination of six major means-tested programs — Medicaid, SNAP, Supplemental Security Income, Section 8 housing vouchers, school meals programs, and the EITC — found that in each of them, 90 to 99 percent of spending goes for benefits or services that reach beneficiaries. Thus, federal and state administrative costs combined account for only 1 to 10 percent of program costs, with most of those costs coming at the state level.
This situation will change under health reform. Under the Affordable Care Act (ACA), states can expand Medicaid to cover all poor and near-poor non-elderly adults under favorable financing terms. In addition, uninsured children and adults with incomes between 100 percent and 400 percent of the poverty line will be able to receive subsidized coverage through the new health insurance exchanges. For states that adopt the ACA’s Medicaid expansion, health reform will complete the transition from a Medicaid structure that linked eligibility for subsidized health insurance to receipt of welfare benefits — leaving many low-income working individuals and families uninsured — to one that provides access to affordable coverage for virtually all low-income children and adults, including nearly all of the working poor.
SNAP
In February 1983, only 23 percent of households with children receiving food stamps were working.[17] Today, this share has more than doubled; about half of SNAP households with children work. Moreover, among households with children that include an adult who isn’t elderly or disabled, 87 percent of the households receiving SNAP in a given month include an individual who worked in the prior year or will work in the following year.[18]
The number of SNAP households that have earnings while participating in SNAP has been rising for more than a decade. It has more than tripled over this period, from about 2 million in 2000 to about 6.4 million in 2011. The growth is due in part to an increase in the percentage of eligible working households that participate in SNAP, as the result of bipartisan efforts at the federal, state, and local levels to make the program more accessible to working families. In addition, during the recent recession and ensuing slow recovery, the number of working households whose earnings are too low to keep them out of poverty has risen.
Under the Clinton and George W. Bush administrations, the Agriculture Department took steps to improve access to SNAP for eligible low-income working families and families moving from welfare to work, such as reducing unnecessary paperwork requirements and ensuring that leaving welfare for work did not cause a family to lose SNAP benefits. Eric M. Bost, who served as Bush’s Undersecretary of Agriculture for Food, Nutrition, and Consumer Services, described the program’s role in supporting work and advancing welfare reform goals at a June 2001 congressional hearing:
The Food Stamp Program has also contributed to the success of welfare reform by supporting the transition from welfare to work. The reasons are easy to understand — if you are worried about your family’s next meal, it is hard to focus on your future. For many households, food stamps can mean the difference between living in poverty and moving beyond it. And for many, it has.[19]
Child Care Assistance
The federal government provides funds to states for child care assistance programs. States use them — along with their own funds — to help some low-income working parents and parents in education and training programs pay for child care.
Before 1990, nearly all federal child care assistance went to families who were receiving case welfare assistance through AFDC and had a parent participating in AFDC-related education or training programs, and only a small amount of it went to families leaving welfare for work. In 1990, President George H.W. Bush and Congress established the Child Care and Development Block Grant and the At-Risk Child Care program, and funding for child care assistance for low-income working families has risen modestly since then. Still, due to insufficient funding, only about one in six low-income children eligible for child care assistance under federal rules receives it.[20]
Safe, reliable child care is expensive. Full-time, center-based care for a 4-year-old child costs an average of almost $7,600 in the median state in 2012, according to Child Care Aware, an organization of child care resource and referral agencies across the country. Full-time care for an infant costs about $9,400 in the median state.[21] These costs far exceed what a mother working full-time at the minimum wage typically can afford on her own.
For low-income parents, access to reliable child care is important for long-term job retention. Families that, due to cost concerns, use informal child care arrangements (e.g., where family members serve as child care providers) or string together multiple care arrangements will more likely experience child care-related work disruptions, recent research shows. Low-wage workers who miss work or arrive late because of child care mishaps are more likely to be fired from their jobs. Child care subsidies can provide consistent access to stable child care so that parents can work dependably.[22]
Safety Net Has Weakened for the Very Poorest Families with Children
Although means-tested programs protect millions of Americans from poverty, the safety net has become less effective over the past two decades at shielding them from deep poverty — that is, from having household income below half of the poverty line. This decline largely reflects a substantial weakening of the cash assistance safety net following the enactment of the 1996 federal welfare law as well as state policy changes that shrank general assistance programs for childless adults.
Between 1984 and 2004, even as the overall poverty rate declined, the percentage of Americans living in deep poverty increased markedly, according to a study published in the 2012 Oxford Handbook of the Economics of Poverty.a The study goes beyond the official poverty measure, by counting as income the value of non-cash benefits such as SNAP and tax credits such as the EITC.
The researchers link the rise in deep poverty to a weakening of the safety net for the most vulnerable. Between 1984 and 2004, the average value of government assistance, including non-cash benefits, to people with virtually no other income plummeted, falling by 38 percent (after adjusting for inflation) for single parents and by 41 percent for families experiencing joblessness.
In addition, a recent study by University of Michigan and Harvard researchers finds that the number of U.S. households with children who live on cash income of less than $2 per person per day — a standard the World Bank uses to measure poverty in developing countries — has more than doubled since 1996, rising 159 percent to 1.6 million households in 2011.b Counting the value of tax credits and non-cash benefits — housing assistance and especially SNAP — lowers these numbers considerably, but the growth in extremely poor households with children remains troubling: a 50 percent increase from 1996, to 613,000 such families in 2011.
The study’s authors computed the change in extreme poverty both including and excluding TANF income. It is “obvious,” they write, “that cash assistance was having a substantial impact in reducing extreme poverty in early 1996, and having a much smaller effect in reducing extreme poverty by mid-2011.”
CBPP analyses of Census data support these findings. Using a more complete measure of poverty than the official poverty statistics, we find that the number of children and parents living below half of the poverty line rose by 900,000 between 1995 and 2007, even before the economy turned down.c The percentage of children and parents in deep poverty increased from 1.8 percent to 2.4 percent.
We also find that this increase in deep poverty was driven largely by the weakening anti-poverty effectiveness of cash assistance. In 1995, cash assistance through Aid to Families with Dependent Children lifted 2.4 million children above half the poverty line. By 2007, cash assistance through TANF lifted only 500,000 children out of deep poverty. If the safety net had been as effective at keeping children out of deep poverty in 2007 as it was in 1995, there would have been 1.2 million deeply poor children in 2007; instead, there were 2.0 million.
a Yonatan Ben-Shalom, Robert A. Moffitt, and John Karl Scholz, “An Assessment of the Effectiveness of Anti-Poverty Programs in the United States,” Prepared for the 2012 Oxford Handbook of the Economics of Poverty. Chapter 22. A version of this study is available at: http://www.irp.wisc.edu/publications/dps/pdfs/dp139211.pdf.
b H. Luke Shaefer and Kathryn Edin, “Rising Extreme Poverty in the United States and the Response of Federal Means-Tested Transfer Programs,” National Poverty Center Working Paper 13-06, May 2013, http://www.npc.umich.edu/publications/working_papers/?publication_id=255&.
c The poverty measure that we use counts non-cash benefits as income, as most analysts favor; subtracts taxes, work expenses, and medical expenses, as the National Academy of Sciences (NAS) has recommended; and corrects for the underreporting of certain government benefits in the Census data. We use the poverty line recommended by the NAS, calculated by the Census Bureau for 2010 and adjusted backward for inflation. Estimates of TANF, SSI, and food stamp income are corrected for underreporting using the TRIM model developed by the Urban Institute.
Programs Improve Long-Term Outcomes, Particularly for Children
As research increasingly finds, certain investments in assistance, health care, and education for children in low-income families can have positive long-term effects, such as improving children’s health status, educational success, and future work outcomes. These positive effects, in turn, can benefit the country by improving the skills of our workforce so that we are more fully using the talents of our people.
Research shows that:
Programs that supplement the earnings of low-income working families, like the EITC and CTC, boost children’s school achievement and future economic success, and participating children are healthier as infants and have more economic success as adults. Harvard University economists Raj Chetty and John N. Friedman and Columbia University economist Jonah Rockoff analyzed school data for grades 3-8 from a large urban school district, as well as the corresponding U.S. tax records for families in the district. They found that even under conservative assumptions, additional income from the EITC and CTC leads to significant increases in students’ test scores.[23] After studying nearly two decades’ worth of data on mothers and their children, University of California at San Diego economist Gordon B. Dahl and University of Western Ontario economist Lance Lochner concluded that additional income from the EITC significantly raises the combined math and reading test scores of students.[24]
This research on the EITC and CTC is consistent with research on other income supplements for working families. After reviewing the research, Northwestern University’s Greg J. Duncan and the University of Wisconsin’s Katherine Magnuson found “convincing evidence” of improved educational outcomes from studies of the EITC and other programs that supplement low-income families’ earnings.[25] Providing an income supplement of about $3,000 (in 2005 dollars) to a working parent during a child’s early years, they concluded, may boost that child’s achievement by the equivalent of about two extra months of schooling.[26]
The EITC and CTC’s beneficial effects appear to follow children into adulthood. Harvard’s Chetty and his coauthors note evidence that test score gains can lead to significant improvements in students’ later earnings and employment rates when they become adults.[27] Their finding parallels other research that followed low-income children from early childhood into their adult years and found a lasting beneficial effect when the children’s families received additional income (regardless of the income source). The researchers found that each additional $3,000 in annual income in early childhood is associated with an added 135 hours of annual work as a young adult and an additional 17 percent in annual earnings.[28]
Finally, University of California at Davis researchers Hilary W. Hoynes, Douglas L. Miller, and David Simon examined the effect of EITC expansions that policymakers enacted in the 1990s, by comparing changes in birth outcomes for families eligible for the largest increases in their EITC to changes in outcomes for families eligible for little or no increase. They found that infants born to mothers who were eligible for the largest EITC increases experienced the greatest improvements on a number of birth indicators associated with more favorable long-term outcomes for children, such as a reduced incidence of low birth weight and premature births. [29]
SNAP improves long-term health and self-sufficiency. While reducing hunger and food insecurity and lifting millions out of poverty in the short run, SNAP brings important long-run benefits. A new NBER study examined what happened when government introduced food stamps in the 1960s and early 1970s and concluded that children who had access to food stamps in early childhood and whose mothers had access during their pregnancy had better health outcomes as adults years later, compared to children born at the same time in counties that had not yet implemented the program. Along with lower rates of “metabolic syndrome” (obesity, high blood pressure, heart disease, and diabetes), adults who had access to food stamps as young children reported better health, and women who had access to food stamps as young children reported improved economic self-sufficiency (as measured by employment, income, poverty status, high school graduation, and program participation).[30]
Medicaid has important health benefits for both children and adults. Children covered by Medicaid or CHIP are more likely than uninsured children to receive important preventive services, such as well-child check-ups, that are important for spotting health problems early.[31]
For adults, Medicaid participation is associated with better health, lower mortality, and less household debt and out-of-pocket costs. A study widely regarded as the most important and rigorous examination of Medicaid’s effects on beneficiaries — under which researchers were able to compare outcomes in Oregon between low-income people who received Medicaid and similar people who remained uninsured — found the adults with Medicaid coverage were 40 percent less likely than the uninsured adults to suffer a decline in their health over a six-month period.[32] Those with Medicaid coverage also were more likely than the uninsured to access preventive care, such as mammograms for women. In addition, there were significant improvements in diagnosing and treating depression and diabetes among the Medicaid recipients.[33] On a related front, separate research published in the New England Journal of Medicine reported that expansions of Medicaid coverage for low-income adults in Arizona, Maine, and New York reduced mortality by 6.1 percent.[34]
Moreover, people with Medicaid in Oregon were 40 percent less likely than those without insurance to go into medical debt or to leave other bills unpaid in order to cover medical expenses.[35] The latest research from Oregon finds that Medicaid coverage “almost completely eliminated catastrophic out-of-pocket medical expenditures.” [36]
Head Start children fare better years later. Researching the long-term impacts of Head Start, Harvard’s David Deming found that children who participated in the program between 1984 and 1990 later were more likely to complete high school, less likely to be out of school and out of work, and less likely to be in poor health. Head Start, he concluded, “closes one-third of the gap” on a combined measure of adult outcomes “between children with median and bottom-quartile family income.” Some questions remain about whether the advantage that Head Start children enjoy when they enter kindergarten endures in later school years, and there is broad agreement that policymakers should pursue further reforms to strengthen the program’s impacts in these areas. But Deming tracked children for a longer period, beyond just their school years, and he found that the program’s positive influence is evident in later years in various important areas of children’s lives such as high school completion, college enrollment, health status, and being either employed or in school. [37]
Similarly, the University of Chicago’s Jens Ludwig and the University of California at Davis’ Douglas Miller find evidence that Head Start has a positive effect on children’s health — specifically, that mortality rates among children aged 5 to 9 fell due to screenings conducted as part of Head Start’s health services.[38]
Pell Grants help low-income students overcome significant barriers to earning a college education. Pell Grants provide assistance to more than 9 million low- and moderate-income students to pay for college. Students qualify for the grants based on their income, assets, and family size; three-quarters of recipients had family incomes below $30,000 in the 2010-2011 academic year.[39] Need-based grant aid improves college access, studies show, especially among minority students.[40]
Pell Grants, in particular, appear to promote college completion.[41] A 2009 Education Department study found that, after controlling for barriers to college success such as financial independence, college graduates who received these grants earned their degrees faster than non-recipients.[42] And a 2008 study found that low-income students who receive a Pell Grant were 63 percent less likely to drop out than low-income students without such a grant.[43] College graduates have higher employment rates and earnings and lower poverty rates than those who lack a college degree.[44] By helping students graduate, Pell Grants improve students’ chances of success in the labor market.
Housing assistance programs reduce risk factors for poor school outcomes. Four housing-related problems — homelessness, frequent moves that result in school changes, overcrowding, and poor housing quality — can impair children’s academic achievement, research shows. Children in homeless families are more likely than other low-income children to drop out of school, repeat a grade, or perform poorly on tests.[45] Frequent moves, particularly those that cause children to change schools during kindergarten or high school, tend to worsen educational performance (both for the children andfor their classmates in schools in which large numbers of students move in or out during the year).[46]
Research shows, moving often imposes stress on students, which can cause students to have difficulty concentrating.[47] Moreover, when students change schools, they can suffer gaps in their learning because they miss school days and because different schools cover material in a different order. In addition, changing schools can impair the development of the bond with teachers that disadvantaged children often need to perform well.[48] Children also may miss school due to homelessness or frequent moves or because they live in housing that may exacerbate a child’s asthma or result in lead poisoning.[49] And, children living in overcrowded housing may lack the space or quiet to do their homework, and they may also suffer from stress-related behavior problems that interfere with academic performance.[50]
Housing assistance reduces these housing-related problems. In a multi-site, rigorous evaluation, low-income families that received housing vouchers were 74 percent less likely to become homeless, 48 percent less likely to live in overcrowded housing, and moved fewer times over a five-year period than similar low-income families that didn’t receive housing assistance.[51] By lowering families’ housing costs to 30 percent of their income and requiring that housing meet minimum quality standards, federal housing assistance eliminates or substantially reduces several of the primary causes of homelessness and involuntary moves.[52] Federal rules also bar overcrowding in the units that families rent with the help of vouchers.
Emerging Research on Connections Among Poverty, High Levels of Stress, and Child Outcomes
Dr. Jack Shonkoff, who directs Harvard’s Center on the Developing Child, and other researchers have shown that when children live in very stressful situations — in dangerous neighborhoods, in families that have real difficulty putting food on the table, or with parents who cannot cope with their daily lives — they may experience what he calls “toxic stress.” This stress creates damaging neurological impacts that negatively affect the way a child’s brain works and that impede children’s ability to succeed in school and develop the social and emotional skills to function well as adults.
For example, one study documented that a young adult’s working memory (measured at age 17) “deteriorated in direct relation to the number of years the children lived in poverty (from birth through age 13).” The study found that “such deterioration occurred only among poverty-stricken children with chronically elevated physiological stress (as measured between ages 9 and 13).” That is, the mechanism by which early childhood poverty affected memory appears to be related to the stress that “usually accompanies poverty.”a
Recent research published by the National Bureau of Economic Research also has found connections between swings in income around the time of a pregnancy and dangerous levels of stress that affects both the mother and baby. Temporary spells of low income during pregnancy appear to come with an increase in the maternal stress hormone cortisol; a high cortisol level during pregnancy was associated with negative child outcomes — specifically, “a year less schooling, a verbal IQ score that is five points lower and a 48 percent increase in the number of chronic [health] conditions” for the exposed children, compared to their own siblings who were born at times when the family had lower stress (and, usually, higher income).b
Programs that help poor families with children afford the basics may help improve longer-term outcomes for children by reducing the added stress that parents or children may experience if they cannot pay their bills or don’t know how they will put food on the table. While researchers are only starting to explore the relationship between safety net programs and toxic stress and its long-term consequences, early findings are striking.
University of California at Davis economist Hilary Hoynes and her colleagues find that “access to food stamps in utero and in early childhood leads to significant reductions in metabolic syndrome conditions (obesity, high blood pressure, heart disease, and diabetes) in adulthood and, for women, increases in economic self-sufficiency (increases in educational attainment, earnings, and income, and decreases in welfare participation).”c Other researchers also found signs of reduced stress (such as less inflammation and lower diastolic blood pressure) among mothers targeted by the 1993 expansion of the Earned Income Tax Credit; this expansion was also followed by a significant improvements in self-reported health status for the affected mothers.d
a Gary W. Evans, Jeanne Brooks-Gunn, and Pamela K. Klebanov, “Stressing Out the Poor: Chronic Physiological Stress and the Income-Achievement Gap,” Pathways, winter 2011, http://www.stanford.edu/group/scspi/_media/pdf/pathways/winter_2011/PathwaysWinter11.pdf.
b Anna Aizer, Laura Stroud, Stephen Buka (2012), “Maternal Stress and Child Outcomes: Evidence from Siblings,” National Bureau of Economic Research Working Paper 18422, www.nber.org/papers/w18422.pdf.
c Hilary W. Hoynes, Diane Whitmore Schanzenbach, and Douglas Almond (2012), “Long Run Impacts of Childhood Access to the Safety Net,” National Bureau of Economic Research Working Paper 18535, www.nber.org/papers/w18535.
d William N. Evans and Craig L. Garthwaite (2010), “Giving Mom a Break: The Impact of Higher EITC Payments on Maternal Health,” National Bureau of Economic Research Working Paper 16296, www.nber.org/papers/w16296.
Conclusion
Various safety net programs provide important assistance to struggling families, help ensure that low-income individuals have access to affordable health care, and provide increased educational opportunities to low-income students. These efforts reduce poverty and hardship and promote work in the short run. They also contribute to more positive educational, health, and employment outcomes in the longer run.
| Appendix Table 1: Number of People Kept Above the Poverty Line by All Public Benefits Supplemental Poverty Measure, 2009-2011 |
||
| Total | Children Under Age 18 | |
| Alabama | 786,000 | 166,000 |
| Alaska | 61,000 | 16,000 |
| Arizona | 828,000 | 201,000 |
| Arkansas | 539,000 | 108,000 |
| California | 3,888,000 | 987,000 |
| Colorado | 473,000 | 117,000 |
| Connecticut | 389,000 | 68,000 |
| Delaware | 116,000 | 23,000 |
| District of Columbia | 55,000 | 16,000 |
| Florida | 2,560,000 | 413,000 |
| Georgia | 1,130,000 | 289,000 |
| Hawaii | 163,000 | 48,000 |
| Idaho | 253,000 | 71,000 |
| Illinois | 1,568,000 | 370,000 |
| Indiana | 932,000 | 190,000 |
| Iowa | 390,000 | 77,000 |
| Kansas | 390,000 | 84,000 |
| Kentucky | 709,000 | 155,000 |
| Louisiana | 647,000 | 147,000 |
| Maine | 216,000 | 36,000 |
| Maryland | 474,000 | 105,000 |
| Massachusetts | 842,000 | 158,000 |
| Michigan | 1,572,000 | 301,000 |
| Minnesota | 603,000 | 121,000 |
| Mississippi | 531,000 | 135,000 |
| Missouri | 958,000 | 194,000 |
| Montana | 167,000 | 34,000 |
| Nebraska | 209,000 | 49,000 |
| Nevada | 299,000 | 61,000 |
| New Hampshire | 127,000 | 15,000 |
| New Jersey | 958,000 | 191,000 |
| New Mexico | 333,000 | 87,000 |
| New York | 2,376,000 | 544,000 |
| North Carolina | 1,561,000 | 374,000 |
| North Dakota | 68,000 | 11,000 |
| Ohio | 1,728,000 | 353,000 |
| Oklahoma | 536,000 | 138,000 |
| Oregon | 554,000 | 114,000 |
| Pennsylvania | 1,889,000 | 300,000 |
| Rhode Island | 167,000 | 35,000 |
| South Carolina | 771,000 | 162,000 |
| South Dakota | 113,000 | 27,000 |
| Tennessee | 1,055,000 | 236,000 |
| Texas | 3,155,000 | 990,000 |
| Utah | 284,000 | 77,000 |
| Vermont | 89,000 | 16,000 |
| Virginia | 681,000 | 128,000 |
| Washington | 935,000 | 231,000 |
| West Virginia | 355,000 | 57,000 |
| Wisconsin | 768,000 | 145,000 |
| Wyoming | 54,000 | 9,000 |
| US Total | 40,307,000 | 8,980,000 |
| Source: CBPP analysis of Census Bureau data from the March Current Population Survey and SPM public use files. We use three-year averages in order to improve the reliability of the data. | ||
| Appendix Table 2: Number of People Kept Above the Poverty Line by Means-Tested Programs Supplemental Poverty Measure, 2009-2011 |
||
| Total | Children Under Age 18 | |
| Alabama | 323,000 | 149,000 |
| Alaska | 37,000 | 16,000 |
| Arizona | 389,000 | 191,000 |
| Arkansas | 205,000 | 94,000 |
| California | 2,328,000 | 946,000 |
| Colorado | 242,000 | 121,000 |
| Connecticut | 177,000 | 63,000 |
| Delaware | 49,000 | 23,000 |
| District of Columbia | 43,000 | 17,000 |
| Florida | 1,060,000 | 449,000 |
| Georgia | 664,000 | 313,000 |
| Hawaii | 105,000 | 49,000 |
| Idaho | 132,000 | 66,000 |
| Illinois | 753,000 | 336,000 |
| Indiana | 432,000 | 200,000 |
| Iowa | 170,000 | 72,000 |
| Kansas | 160,000 | 74,000 |
| Kentucky | 331,000 | 150,000 |
| Louisiana | 314,000 | 142,000 |
| Maine | 82,000 | 32,000 |
| Maryland | 245,000 | 104,000 |
| Massachusetts | 456,000 | 160,000 |
| Michigan | 615,000 | 262,000 |
| Minnesota | 231,000 | 100,000 |
| Mississippi | 261,000 | 122,000 |
| Missouri | 401,000 | 183,000 |
| Montana | 76,000 | 35,000 |
| Nebraska | 97,000 | 49,000 |
| Nevada | 142,000 | 60,000 |
| New Hampshire | 43,000 | 16,000 |
| New Jersey | 389,000 | 162,000 |
| New Mexico | 144,000 | 67,000 |
| New York | 1,365,000 | 523,000 |
| North Carolina | 729,000 | 331,000 |
| North Dakota | 27,000 | 11,000 |
| Ohio | 746,000 | 318,000 |
| Oklahoma | 240,000 | 122,000 |
| Oregon | 238,000 | 100,000 |
| Pennsylvania | 674,000 | 257,000 |
| Rhode Island | 81,000 | 30,000 |
| South Carolina | 278,000 | 130,000 |
| South Dakota | 56,000 | 26,000 |
| Tennessee | 471,000 | 211,000 |
| Texas | 2,034,000 | 1,016,000 |
| Utah | 148,000 | 77,000 |
| Vermont | 38,000 | 14,000 |
| Virginia | 306,000 | 137,000 |
| Washington | 441,000 | 200,000 |
| West Virginia | 128,000 | 46,000 |
| Wisconsin | 281,000 | 117,000 |
| Wyoming | 19,000 | 8,000 |
| US Total | 19,398,000 | 8,496,000 |
| Source: CBPP analysis of Census Bureau data from the March Current Population Survey and SPM public use files. We use three-year averages in order to improve the reliability of the data. These calculations count the following means-tested programs: TANF, SSI, SNAP, housing assistance, energy assistance, WIC, EITC, refundable portion of the Child Tax Credit, free and reduced school lunch, Pell Grants, and means-tested veterans’ benefits. | ||
End Notes
[1] Indivar Dutta-Gupta and Jimmy Charite co-authored an earlier version of this report.
[2] Arloc Sherman, "The Power of the Safety Net: What the Supplemental Poverty Measure Shows," Spotlight on Poverty and Opportunity Commentary, 11-14-12, www.spotlightonpoverty.org.
[3] State-by-state estimates of the anti-poverty effects of the EITC and CTC can be found at: http://www.taxcreditsforworkingfamilies.org/working-families-poverty-eitc-ctc-state/.
[4] Because surveyed households do not always recall or report all of their income, Census data may provide an incomplete picture of family poverty status. Some types of income, including SNAP, tend to be particularly underreported in Census data. A database developed by the Urban Institute for the U.S. Department of Health and Human Services, known as the Transfer Income Model Version 3 (TRIM III), corrects for this underreporting. Consistent with the actual SNAP administrative data, TRIM 3 finds more people receiving SNAP than does the uncorrected Census data, and consequently finds SNAP has a larger anti-poverty effect. TRIM data for 2011 are not available, but figures for 2010 suggest that, when TRIM is used to correct for underreporting, the number of people (and of children) kept above the SPM poverty line by SNAP doubles relative to the uncorrected estimates. Thus, the figures cited in the text above understate SNAP’s anti-poverty impact.
[5] These figures use the Supplemental Poverty Measure (SPM) and count the following means-tested programs: TANF, SSI, SNAP, housing assistance, energy assistance, WIC, the EITC, the refundable portion of the Child Tax Credit, free and reduced school lunch, Pell Grants, and means-tested veterans’ benefits.
[6] CBPP analysis of the Census Bureau’s 2012 Current Population Survey.
[7] Yonatan Ben-Shalom, Robert A. Moffitt, and John Karl Scholz, “An Assessment of the Effectiveness of Anti-Poverty Programs in the United States,” Prepared for the 2012 Oxford Handbook of the Economics of Poverty. Chapter 22. A version of this study is available at: http://www.irp.wisc.edu/publications/dps/pdfs/dp139211.pdf.
[8] All of these figures are expressed in 1983 dollars.
[9] The comparison uses the official poverty threshold of $10,098 used by the Census Bureau for a two-parent, two-child family in 1983.
[10] Looked at another way, in 1983, federal payroll taxes as a whole (including both employer and employee payroll taxes) actually pushed this family deeper into poverty. The family’s EITC — $500 — would have been less than the combination of the employer and employee payroll taxes of nearly $900. Economists typically consider the payroll taxes paid by employers to be taxes borne by the worker. From this perspective, the tax system as a whole in 1983 pushed this family deeper into poverty.
[11] Above certain income levels, EITC benefits phase down as a family’s income rises, but there is little evidence that workers in this range substantially reduce their work hours as a result of the EITC. Once EITC recipients reach the phase-out range, recipients with no children have their EITC reduced by 8 cents for each additional dollar earned, recipients with one child have their EITC reduced by 16 cents, and recipients with two or more children have their EITC reduced by 21 cents. In theory, the phase-out could discourage additional hours of work among those with incomes in the phase-out range. The only studies to find a reduction in work hours, however, have found such effects to be small. Moreover, those studies generally found such effects only among married EITC recipients, and many analysts believe this effect is likely due largely to the fact that the additional income the EITC provides allows the second earner in some married families to choose to spend more time raising children and less time working out of the home. Analysts across the political spectrum have observed that the fact that the EITC may lead some married parents to make such a choice should not be regarded as an adverse policy outcome. See David T. Ellwood, “The Impact of the Earned Income Tax Credit and Social Policy Reforms on Work, Marriage, and Living Arrangements,” June 2010, http://www.hks.harvard.edu/inequality/Summer/Summer00/papers/Ellwood.PDF.
[12] Nada Eissa and Hilary Hoynes, “Behavioral Responses to Taxes: Lessons from the EITC and Labor Supply,” NBER Working Paper No. 11729, November 2005, http://www.nber.org/papers/w11729.
[13] Jeffrey Grogger, “The Effects of Time Limits, the EITC, and Other Policy Changes on Welfare Use, Work, and Income among Female-Head Families,” Review of Economics and Statistics, May 2003.
[14] Stacy Dickert, Scott Houser, and John Karl Scholz, “The Earned Income Tax Credit and Transfer Programs: A Study of Labor Market and Program Participation,” Tax Policy and the Economy, Vol. 9, MIT Press, 1995.
[15] Jeffrey Grogger, “The Effects of Time Limits, the EITC, and Other Policy Changes on Welfare Use, Work, and Income among Female-Head Families,” Review of Economics and Statistics, May 2003. Using different data, in another study, Grogger reaches similar conclusions. Jeffrey Grogger, “Welfare Transitions in the 1990s: the Economy, Welfare Policy, and the EITC,” NBER Working Paper No. 9472, January 2003, http://www.nber.org/papers/w9472.pdf.
[16] Tim Dowd and John Horowitz, “Income Mobility and the Earned Income Tax Credit: Short-Term Safety Net or Long-Term Income Support,” Public Finance Review, September 2011.
[17] Characteristics of Food Stamp Households, February 1983. U.S. Department of Agriculture, Food and Nutrition Service, Office of Analysis and Evaluation. CBPP Analysis of FY 2011 USDA Quality Control SNAP data.
[18] Dottie Rosenbaum, “The Relationship Between SNAP and Work Among Low-Income Households,” Center on Budget and Policy Priorities, January 2013, https://www.cbpp.org/cms/index.cfm?fa=view&id=3894.
[19] Testimony of Eric M. Bost, Under Secretary, Food, Nutrition and Consumer Services Before the House Committee on Agriculture Subcommittee on Department Operations, Oversight, Nutrition and Forestry, June 27, 2001, http://www.fns.usda.gov/cga/speeches/ct062701.html.
[20] Estimates of Child Care Eligibility and Receipt for Fiscal Year 2006, Office of the Assistant Secretary for Planning and Evaluation, U.S. Department of Health and Human Services, April 2010, http://aspe.hhs.gov/hsp/10/cc-eligibility/ib.shtml.
[21] “Parents and the High Cost of Child Care,” Child Care Aware, http://www.naccrra.org/about-child-care/cost-of-child-care. See, in particular, Appendix 1.
[22] Nicole D. Forry & Sandra L. Hofferth (2011), “Maintaining work: The influence of child care subsidies on child care-related work disruptions,” Journal of Family Issues, 32, 436-368.
[23] Raj Chetty, John N. Friedman, and Jonah Rockoff, “New Evidence on the Long-Term Impacts of Tax Credits,” Statistics of Income Paper Series, November 2011, http://www.irs.gov/pub/irs-soi/11rpchettyfriedmanrockoff.pdf.
[24] Gordon Dahl and Lance Lochner, “The Impact Of Family Income On Child Achievement: Evidence From The Earned Income Tax Credit,” American Economic Review (2012), 1927-1956, http://www.aeaweb.org/articles.php?doi=10.1257/aer.102.5.1927. Building on Dahl and Lochner’s research methods, economists Alexander M. Gelber of the Wharton School of Business and Matthew C. Weinzierl of the Harvard Business School conclude that the income boost that low-income families with children receive from the EITC helps the tax system raise revenue more effectively. In essence, they conclude, when low-income families with young children receive additional income, their children perform better in school, which increases the opportunities their children have to succeed. Alexander M. Gelber and Matthew C. Weinzierl, “Equalizing Outcomes vs. Equalizing Opportunities: Optimal Taxation When Children’s Abilities Depend On Parents' Resources,” NBER Working Paper No. 18332, August 2012, http://www.nber.org/papers/w18332.
[25] Greg J. Duncan and Katherine Magnuson, “The Long Reach of Early Childhood Poverty,” Pathways (Winter 2011), http://www.stanford.edu/group/scspi/_media/pdf/pathways/winter_2011/PathwaysWinter11_Duncan.pdf.
[26] Duncan and Magnuson.
[27] Raj Chetty, John N. Friedman, Nathaniel Hilger, Emmanuel Saez, Diane Whitmore Schanzenbach, and Danny Yagan, “How Does Your Kindergarten Classroom Affect Your Earnings? Evidence from Project Star,” The Quarterly Journal of Economics (2011), http://qje.oxfordjournals.org/content/126/4/1593.abstract.
[28] Greg J. Duncan, Kathleen M. Ziol-Guest, and Ariel Kalil, “Early-Childhood Poverty and Adult Attainment, Behavior, and Health,” Child Development (January/February 2010), pp. 306-325.) The $3,000 figure is in 2005 dollars, equivalent to approximately $3,530 in 2012. The 17 percent figure appears as 19 percent but is a typo; a revised figure of 17 percent appears in Duncan and Magnuson (2011).
[29] Hilary W. Hoynes, Douglas L. Miller, and David Simon, “Income, The Earned Income Tax Credit, and Infant Health,” NBER Working Paper No. 18206, July 2012, http://www.nber.org/papers/w18206.
[30] Hilary W. Hoynes, Diane Whitmore Schanzenbach, Douglas Almond, “Long Run Impacts of Childhood Access to the Safety Net,” National Bureau of Economic Research Working Paper No. 18535, November 2012. http://www.nber.org/papers/w18535.
[31] CBPP analysis of the 2005 National Health Interview Survey.
[32] Amy Finkelstein, Sarah Taubman et al., “The Oregon Health Insurance Experiment: Evidence from the First Year,” National Bureau of Economic Research Working Paper No. 17190, July 2011, http://www.nber.org/papers/w17190. See also http://www.offthechartsblog.org/does-medicaid-matter-new-study-shows-how-much/.
[33] Katherine Baicker, Sarah Taubman et al., “The Oregon Experiment — Effects of Medicaid on Clinical Outcomes,” New England Journal of Medicine; 368:1713-1722, May 2, 2013.
[34] Benjamin Sommers, Katherine Baicker, and Arnold Epstein, “Mortality and Access to Care among Adults after State Medicaid Expansions,” New England Journal of Medicine; 367:1025-1034, September 13, 2012.
[35] Finkelstein, et al.
[36] Baicker, et al. Some critics of Medicaid have cited some of this study’s results, such as the lack of statistically significant changes in diagnosis or treatment of high blood pressure or high cholesterol. As the authors of the study have indicated, those results could be due in substantial part to limited sample sizes (as there were improvements in high blood pressure and high cholesterol but not statistically significant ones) and to an abbreviated time period (the study examined the effects of only 17 months of coverage). http://www.offthechartsblog.org/oregon-medicaid-study-strengthens-not-weakens-case-to-expand-medicaid/.
[37] David Deming, “Early Childhood Intervention and Life-Cycle Skill Development: Evidence from Head Start,” American Economic Journal: Applied Economics, 2009, http://www.people.fas.harvard.edu/~deming/papers/Deming_HeadStart.pdf.
[38] Jens Ludwig and Douglas L. Miller. “Does Head Start Improve Children’s Life Chances? Evidence From a Regression Discontinuity Design.” NBER Working Paper No. 11702, October 2005, http://www.nber.org/papers/w11702.
[39] CBPP based on U.S. Department of Education, 2010-2011 Federal Pell Grant End-of-Year Report, http://www2.ed.gov/finaid/prof/resources/data/pell-2010-11/pell-eoy-2010-11.html.
[40] See for example, David M. Linsenmeier and Harvey S. Rosen and Cecilia Elena Rouse, “Financial Aid Packages and College Enrollment Decisions: An Econometric Case Study,” The Review of Economics and Statistics, February 2006, Vol. 88, No. 1, pp. 126-145, which found that replacing loans with grants had the largest impacts on college enrollment for low-income minority students. In addition, the literature shows that a roughly $1,300 increase in financial aid (and therefore $1,300 decrease in tuition costs) increases college enrollment by four percentage points. See Susan Dynarski, “The Behavioral and Distributional Implications of Aid for College,” American Economic Review, 2002, vol. 92, issue 2, pp. 279-285; and Larry Leslie and Paul Brinkman, “Student Price Response in Higher Education,” Journal of Higher Education, 1987.
[41] Eric Bettinger, “How Financial Aid Affects Persistence,” in Caroline M. Hoxby, editor, College Choices: The Economics of Where to Go, When to Go, and How to Pay For It, University of Chicago Press, 2004.
[42] Christina Chang Wei, Laura Horn, and Thomas Weko, A Profile of Successful Pell Grant Recipients: Time to Bachelor’s Degree and Early Graduate School Enrollment, U.S. Department of Education, National Center for Education Statistics, July 2009.
[43] Rong Chen and Stephen L. DesJardins, “Exploring the Effects of Financial Aid on the Gap in Student Dropout Risks by Income Level,” Research in Higher Education, v. 49, pp. 1-18, February 2008.
[44] Sandy Baum, Jennifer Ma, and Kathleen Payea, “Education Pays 2010: The Benefits of Higher Education for Individuals and Society,” College Board.
[45] E.g., Rubin and colleagues found, after controlling for differences in socioeconomic status, demographic characteristics, and schools, that homeless children scored lower on tests of reading, spelling, and math proficiency. David H. Rubin et al., “Cognitive and Academic Functioning of Homeless Children Compared with Housed Children,” Pediatrics 97:3: 289 – 94, 1996. Similar results have been found in more recent studies.
[46] Maya Brennan, “The Impacts of Affordable Housing on Education: A Research Summary,” Center for Housing Policy, May 2011. High-mobility schools have been found to have high teacher turnover and an influx of inexperienced teachers, slower curricular pace resulting in a math curriculum typically one year below grade level, and poor performance on standardized tests. Studies gathered in Mary Cunningham and Graham MacDonald, “Housing as a Platform for Improving Education Outcomes among Low-Income Children,” Urban Institute, May 2012.
[47] Cunningham and MacDonald.
[48] Cunningham and MacDonald.
[49] Sheniz Moonie et al., “The Relationship Between School Absence, Academic Performance, and Asthma Status,” Journal of School Health 78(3): 140-148, 2008.
[50] A New York study found that overcrowded housing reduces young males’ probability of completing high school by almost 11 percentage points; for girls, the negative impact is about half as much. Frank Braconi, “Housing and Schooling,” The Urban Prospect, Citizens Housing and Planning Council, 2001. An analysis of national data from the Panel Study of Income Dynamics found that after controlling for family characteristics, children living in overcrowded conditions completed less schooling than their counterparts. Dalton Conley, “A Room with a View or a room of One’s Own? Housing and Social Stratification,” Sociological Forum 16(2): 263-280, 2001.
[51] Michele Wood, Jennifer Turnham, and Gregory Mills. 2008. "Housing Affordability and Family Well-Being: Results from the Housing Voucher Evaluation." Housing Policy Debate, 19:2, pp. 367-412. The study did not collect data on school outcomes.
[52] Rebecca Cohen and Keith Wardrip, “Should I Stay or Should I Go? Exploring the Effects of Housing Instability and Mobility on Children,” Center for Housing Policy, February 2011. http://www.nhc.org/media/files/HsgInstablityandMobility.pdf.
More from the Authors

Areas of Expertise

Areas of Expertise