

SNAP Helps Millions of Low-Wage Workers
Crucial Financial Support Assists Workers in Jobs with Low Wages, Volatile Income, and Few Benefits
The nation’s largest anti-hunger program, the Supplemental Nutrition Assistance Program (SNAP, formerly food stamps) provides millions of workers with income to help feed their families. Some of the most common occupations in the country have low wages, unpredictable scheduling, and few benefits. Workers turn to SNAP to supplement low and fluctuating pay and to help them get by during spells of unemployment. Most workers who participate in SNAP are in service occupations (e.g., home health aides or cooks), administrative support occupations (e.g., customer service representatives), and sales occupations (e.g., cashiers).
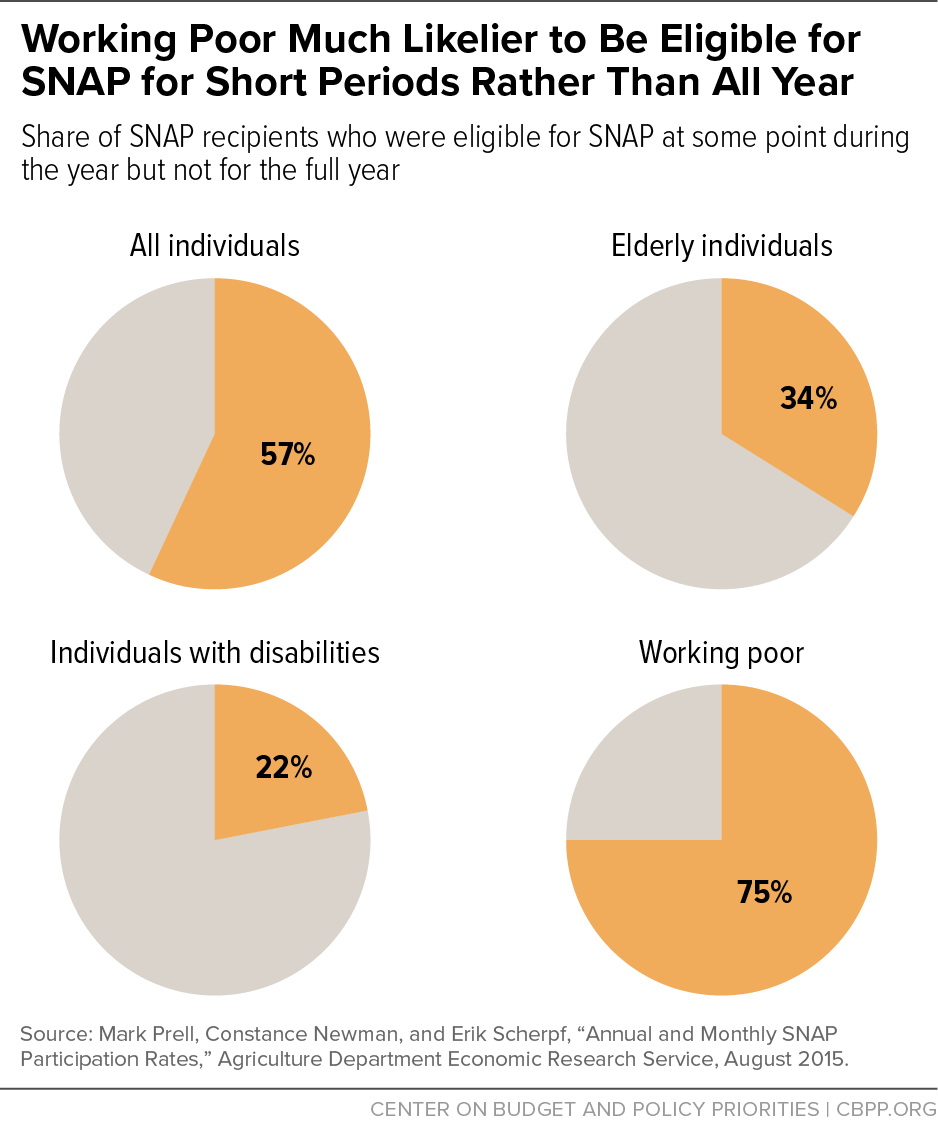
- Many workers and their families participate in SNAP while they are working or are looking for work. SNAP’s program and benefit structure supports work. While many participants work while participating in SNAP, many also apply for benefits to support them while they are between jobs. Thus, many workers participate in SNAP for part of the year and stop participating when they are earning more. Three-quarters of the working poor who were eligible for SNAP at some time during the year were eligible for only part of the year, an Agriculture Department study found.
- Millions of Americans work in jobs with low pay. For example, a recent analysis found that up to 30 percent of Americans work in jobs with pay that would barely lift a family above the poverty line, even if they were working full-time, year-round.
- Occupations that pay low wages are numerous and many are growing. Six of the 20 largest occupations in the country which together employed about 1 in 8 American workers, had median wages close to or below the poverty threshold for a family of three in 2016: retail salespersons, cashiers, food preparation and serving workers, waiters and waitresses, stock clerks, and personal care aides). [1] And eight of the ten jobs that are expected to add the most new jobs over the next decade have median wages below the national median, and many much lower.[2]
- Low-paying jobs often have scheduling practices that contribute to workers’ low and volatile incomes. A growing number of workers, particularly in low-wage occupations such as service, sales, and office support, are working part time but would prefer a full-time job. Many workers also have irregular or unpredictable schedules, which can change from week to week with little if any advance notice and little opportunity for input. This not only causes workers’ incomes to fluctuate but also creates barriers to retaining employment and advancing in their careers by making it harder to arrange child care, search for a new job, or attend school or training.
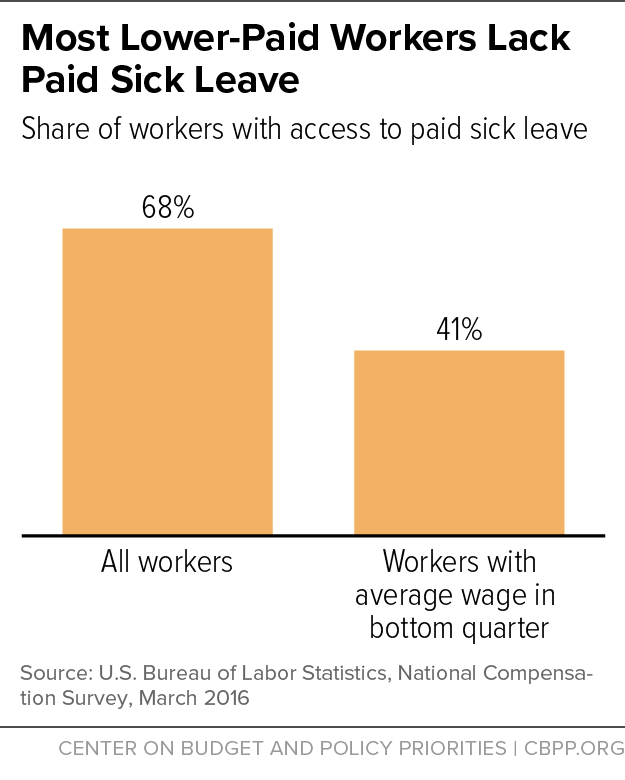
- Most low-wage jobs lack benefits such as paid sick leave and health insurance. For example, only about 41 percent of workers in the lowest wage quartile had paid sick leave in 2016 (compared to 68 percent of all workers), and fewer of these workers had access to paid vacation, a national survey found.[3] Lack of these benefits can increase job turnover because workers, particularly those earning low pay or with volatile schedules, are likelier to stay at jobs for only short periods of time. Also, low-wage workers are less likely to have access to unemployment insurance. One study found that though low-wage workers are over twice as likely as other workers to be unemployed, they are less than half as likely to be covered by unemployment insurance.
- SNAP helps millions of workers, who may struggle with low wages, insufficient or changing hours, and overall job insecurity, feed their families. Not surprisingly, compared to all workers, a greater share of workers who participate in SNAP work in service occupations and in industries such as retail and hospitality, jobs that are likely to have low wages and other features of low quality. In some service occupations — personal care aides, maids and housekeeping cleaners, dishwashers, food preparation workers, and nursing, psychiatric, and home health aides — at least one-quarter of all workers participate in SNAP.
SNAP Provides Low-Wage Workers with Needed Food Benefits
The nation’s largest anti-hunger program, SNAP provides over 40 million low-income people with the means to purchase food in a typical month. SNAP is broadly available to people who meet the program’s eligibility requirements and serves a large cross-section of the nation’s poor and near-poor.
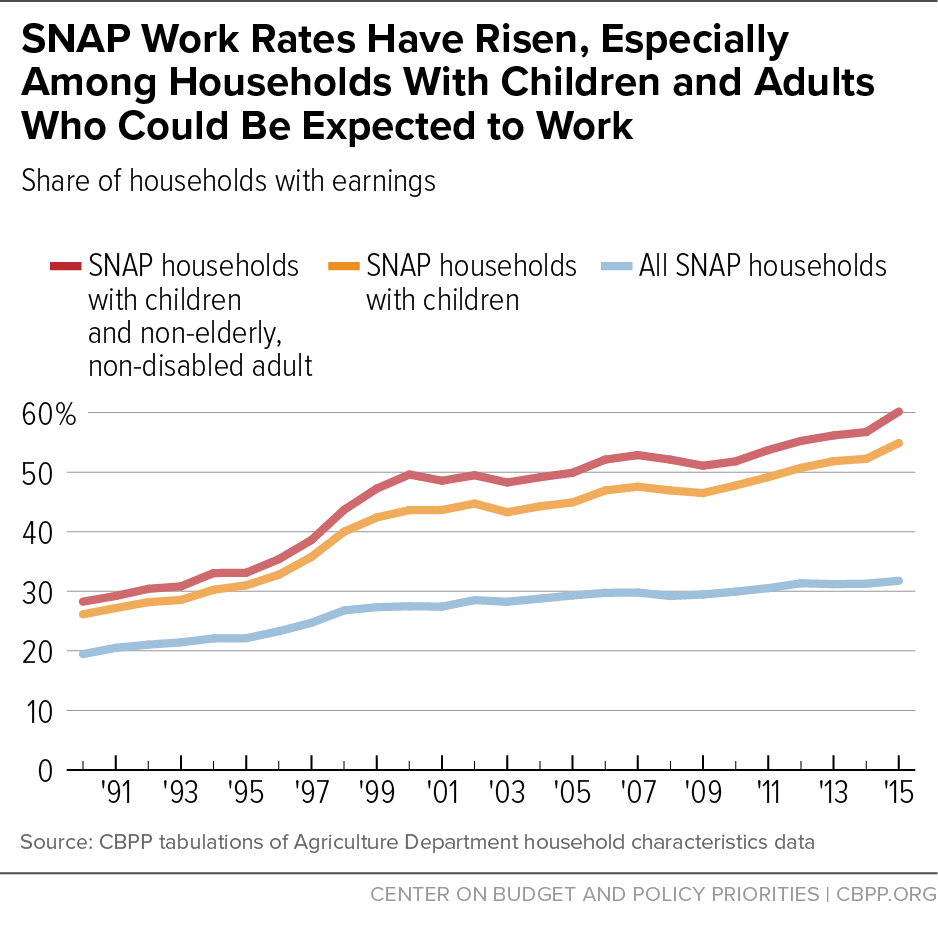
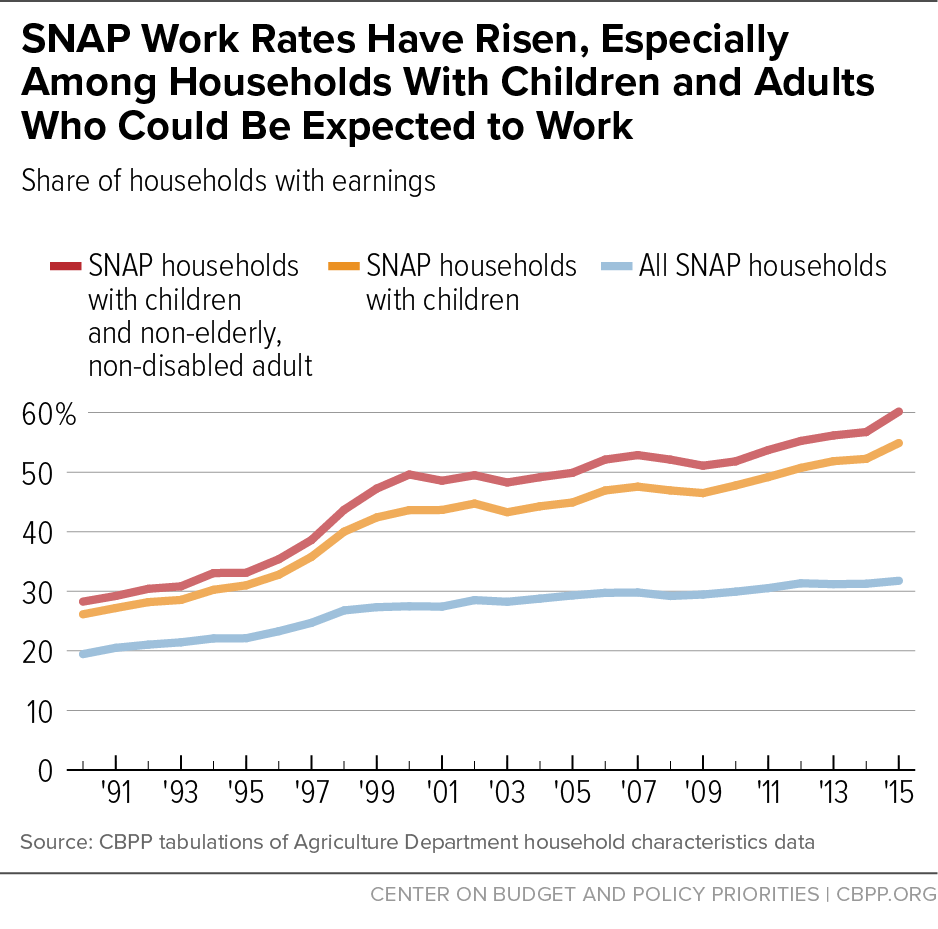
The share of SNAP households with earnings has grown since the 1990s. The share of all households with earnings in an average month while participating in SNAP rose from 19 percent in 1990 to 32 percent in 2015 (see Figure 1). Among households with children and a non-elderly, non-disabled adult, about 60 percent have earnings while participating in SNAP.
Many workers participate in SNAP for part of the year, while they are between jobs or earnings or hours are low, and stop participating when they are earning more. As a result, a snapshot of work among SNAP participants undercounts workers, as many workers only participate in SNAP when they are not working, and workers may cycle in and out of eligibility. For example, an Agriculture Department (USDA) study found that three-quarters of the working poor who were eligible for SNAP at some time during the year were eligible for only part of the year. (See Figure 2.) In contrast, the majority of eligible people who had more stable and often fixed incomes, such as seniors and people with disabilities, were eligible for the full year.[4]
SNAP provides crucial support for workers because they can apply when their incomes drop and receive benefits quickly and on a monthly basis — unlike other programs, where applicants may face a waiting list for benefits. SNAP must provide benefits to eligible applicants within 30 days, and they often receive them much sooner.
SNAP benefits are also designed to support work. The SNAP benefit formula targets benefits based on a household’s income and expenses, phases out benefits slowly as earnings rise, and includes a 20 percent deduction for earned income to reflect the cost of work-related expenses and encourage work. As a result, SNAP benefits fall by only 24 to 36 cents for each additional dollar of earnings for most households. In addition, workers whose pay fluctuates can qualify for higher benefits when their earnings decline, which can help smooth out income for struggling workers.[5] SNAP also serves as an important complement to the Earned Income Tax Credit (EITC), which provides crucial income for low-income working families but in the form of an annual refundable tax credit, whereas SNAP supports working families throughout the year.[6]
Conditions of Low-Paying Jobs Make SNAP Especially Critical
Millions of workers, including household heads supporting families, work in low-wage jobs. One study found that, depending on the definition used, 12 to 30 percent of American workers are in jobs that pay low wages, or wages that would leave a primary wage-earner supporting a family in or close to poverty (that is, wages under $13.50 an hour in 2013); the vast majority are at least age 22, and many are supporting families.[7] Other research that looked at different measures of poverty among workers found that in the preferred estimate, about 9 to 11 percent of working family heads lived in poverty in 2012; some 20 to 24 million people lived in households headed by a working-poor individual.[8]
Occupations that pay low wages are numerous and many are growing. Service jobs, which frequently have low wages, have increased as a share of employment.[9] Six of the 20 largest occupations in the country (retail salespersons, cashiers, food preparation and serving workers, waiters and waitresses, stock clerks, and personal care aides), which together employed about 1 in 8 American workers, had median annual wages close to or below the poverty threshold for a family of three in 2016.[10] Eight of the ten jobs that are expected to add the most new jobs over the next decade (personal care aides, home health aides, food preparation and serving workers, retail salespersons, nursing assistants, customer service representatives, cooks, and construction laborers) have median wages below the national median, and many much lower.[11] For example, home health aide jobs are expected to grow 38 percent and their median pay is 60 percent of the median for all occupations.
Involuntary Part-time Work and Irregular Schedules
Workers in low-wage jobs are likelier than other workers to be working part-time when they would like a full-time job. The number of “involuntary part-time workers” grew by 2 million between 2007 and 2015, rising from 3.1 to 4.4 percent of all workers, a recent study by the Economic Policy Institute found. Service workers accounted for about one-third of all involuntary part-time workers; sales and office workers made up about another quarter.[12] Other research has shown that the share of involuntary part-time workers in the aftermath of the Great Recession was highest among low-skilled occupations and that those workers earn less than workers who are working part-time by choice, even after controlling for factors such as education and occupation.[13]
Many low-income workers must also cope with irregular or unpredictable scheduling. Their schedule (including the number of hours) may vary from week to week and employers may give little advance notice of scheduling, expect workers to be on call, and not allow workers significant input on their schedule.[14] Studies show that irregular schedules are more prevalent in service occupations and industries such as food service and retail. For example, one study of workers ages 26 to 32 found that 90 percent of those in the food service industry experience fluctuations in their number of hours from week to week, and close to two-thirds get less than one week’s notice of their schedule.[15]
The changing number of work hours can increase hardship in other areas of life. Over half of workers with incomes below $40,000 struggled to pay bills due to income fluctuations (the biggest reason for which was irregular work schedules) in 2015, compared to less than 40 percent of higher-income workers, a Federal Reserve Board survey found.[16] Surveys and interviews of workers in low-wage industries, particularly retail and food service, provide evidence of the hardship these workers face, such as income instability and difficulty arranging child care or attending school.[17]
Few Benefits Such as Paid Leave
Low-paying jobs are less likely to provide benefits such as paid leave, and workers who lose low-paying jobs are less likely to receive unemployment insurance benefits. As a result, workers who get sick or have caregiving responsibilities may lose their jobs or delay needed health care, and workers who become unemployed — which is likelier for low-wage workers — face greater hardship.
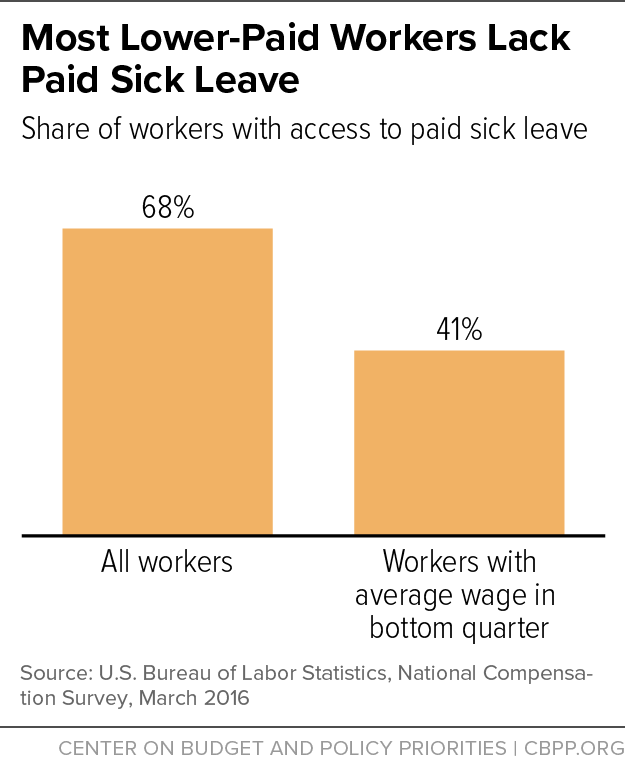
Workers in low-paying jobs are less likely to be able to take a paid day off for vacation, illness, or to take care of a family member or a newborn baby. While about 68 percent of all workers had access to paid sick leave in 2016, only about 41 percent of workers in the lowest wage quartile did (see Figure 3), and fewer of these workers had access to paid vacation, a national survey administered by the Bureau of Labor Statistics found.[18] Low-wage private industry workers were also less likely to have access to both paid and unpaid family leave than those with higher wages.[19]
Workers without paid sick or vacation leave lose wages by taking unpaid leave when they get sick or have to care for a sick child; they may end up losing their job. For example, one study that controlled for other characteristics of workers found that workers with access to paid sick leave or paid vacation were more likely to stay in their current job. This stability reduces disruptive job separations that create income gaps.[20]
Studies also show that workers without access to paid family leave are likelier to have to quit their jobs and to experience hardship when they must care for a child or other family member. For example, one study found that women with less than a high school education were likelier to quit their jobs following the birth of a child than women with higher educational attainment.[21] Another study found that almost two-thirds of workers with family income below the median who took family leave received no or partial pay for their leave; most workers who received less than full pay reported that it was “somewhat difficult” or “very difficult” to make ends meet.[22]
Low-wage workers are also significantly less likely to have access to other benefits that support work, such as health insurance and retirement benefits.[23] Lack of access to these benefits, which enable workers to get preventive care and save for their future, can lead to worsened outcomes and increase the probability of poverty in retirement.[24]
Higher Turnover, Less Access to Unemployment Insurance
Research suggests that low wages and other factors such as unpredictable schedules, lack of schedule control, and involuntary part-time work, contribute to high turnover, which is more common in low-wage jobs.[25] For example, workers may lose jobs when scheduling conflicts such as child care prohibit them from maintaining required hours, or may quit a job to search for one with better conditions.[26] Also, in some industries that employ low-wage workers, the number of temporary and other short-term jobs with less job security has grown.[27] As a result, low-wage workers experience more periods of unemployment than their higher-paid counterparts.[28]
Low-wage workers are also less likely to be eligible for and apply for unemployment insurance, even though they are more likely to experience periods of unemployment and have fewer resources with which to support themselves. Unemployment insurance is a federal-state partnership that provides unemployed workers with income to replace lost wages when they become unemployed. A number of analyses have found that some of the program’s eligibility requirements (both monetary and non-monetary) put low-wage workers — who are likelier to have inconsistent work histories, separations from employment, or periods of part-time work due to caregiving responsibilities — at a disadvantage.[29] One Government Accountability Office study found that though low-wage workers are over twice as likely to be unemployed, they are less than half as likely to be covered by unemployment insurance; even compared with workers with similar work histories, low-wage workers were less likely to receive unemployment insurance.[30] Analyses have also found that workers with lower education levels are less likely to apply for unemployment insurance than workers with more education.[31]
Many SNAP Participants Work in Jobs with Low Pay and Few Supports
Millions of workers have jobs with low pay and few benefits, and many of them turn to SNAP to help put food on the table. Roughly 14.9 million workers, or about 10 percent of all workers, were in households where someone participated in SNAP in the last year, CBPP analysis of data from the 2015 American Community Survey finds.[32] Workers participating in SNAP work in a diverse array of industries and occupations but mostly have jobs with low wages and few supports.
Common Industries Include Education, Health, Hospitality, Retail
Close to two-thirds (63 percent) of workers participating in SNAP are concentrated in four major industries: education and health services, wholesale and retail trade, leisure and hospitality, and professional and business services. As Figure 4 shows, a greater share of SNAP participants work in two of these areas — hospitality and retail — than workers overall. (See Appendix Tables 1 and 2 for details.)
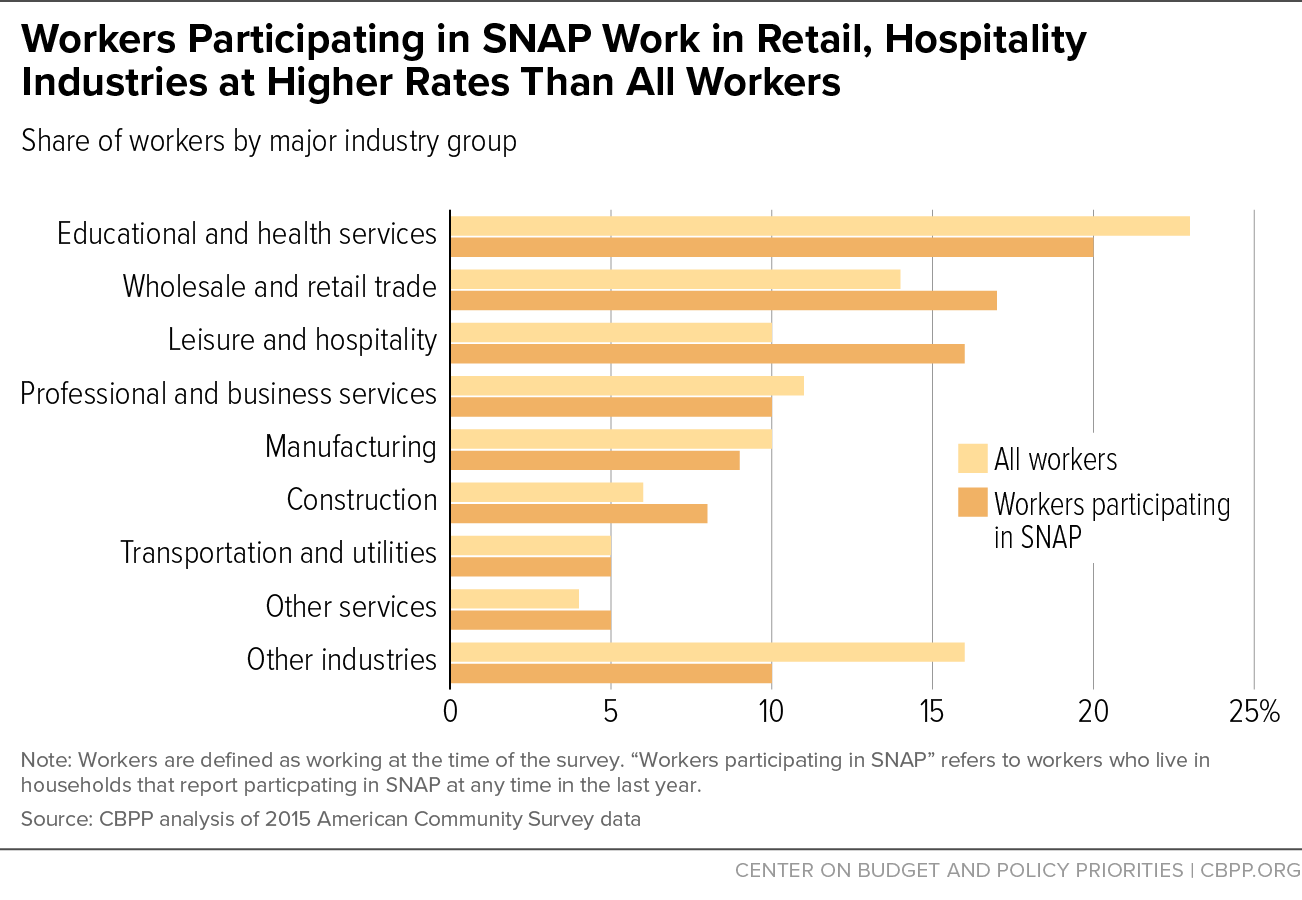
- Education and health services. About 20 percent of workers participating in SNAP work in education and health services. Their most common occupations include home health care aides, personal care aides, child care workers, and teacher assistants. Over two-thirds of these workers work in elementary and middle schools, hospitals, nursing care facilities, home health care services, individual and family services, and child day care services.
- Wholesale and retail trade. About 17 percent of workers participating in SNAP work in wholesale and retail trade. Their most common occupations include cashiers, retail salespersons, and first-line retail supervisors. About half of them work in grocery, department and discount, clothing, or general merchandise stores, or in gas stations.
- Leisure and hospitality. About 16 percent of workers participating in SNAP work in the hospitality sector. Their most common occupations include cooks, waiters/waitresses, cashiers, food preparation workers, and maids and housekeeping cleaners. The majority work in restaurants and other food services —the largest single industry among SNAP participants as a whole, employing about 12 percent of SNAP participants. (See Appendix Table 3 for a list of most common industries where participants work.)
- Professional and business services. About 10 percent of workers participating in SNAP work in professional and business services, mainly in services to buildings and dwellings, landscaping, and employment services. Their most common occupations include grounds maintenance workers, janitors and building cleaners, security guards, maids, and customer service representatives.
- Other industries. About 37 percent of workers participating in SNAP work in manufacturing (9 percent), construction (8 percent), other services (6 percent), transportation and utilities (5 percent), and other industries such as financial activities, public administration, and agriculture (9 percent).
While overall only about 10 percent of all workers participated in SNAP in the last year, the share in several industries was roughly 20 percent or more (see Appendix Table 4). These include home health services, gas stations, general merchandise stores, services to buildings, employment services, private households, and used merchandise stores. This may be because workers in these industries are likelier to live in poverty, due to factors such as low wages or high turnover. It may also be because these workers are likelier to be the primary wage earner and less likely to have other sources of income to supplement low wages.
Common Occupations Include Service, Office Support, and Sales
Close to two-thirds of workers participating in SNAP work in the major occupation groups of service, office and administrative support, sales, and professional occupations. Compared to workers overall, a greater share of SNAP participants work in service occupations, and a smaller share work in professional and management occupations, as Figure 5 shows. (See Appendix Tables 5 and 6 for details.)
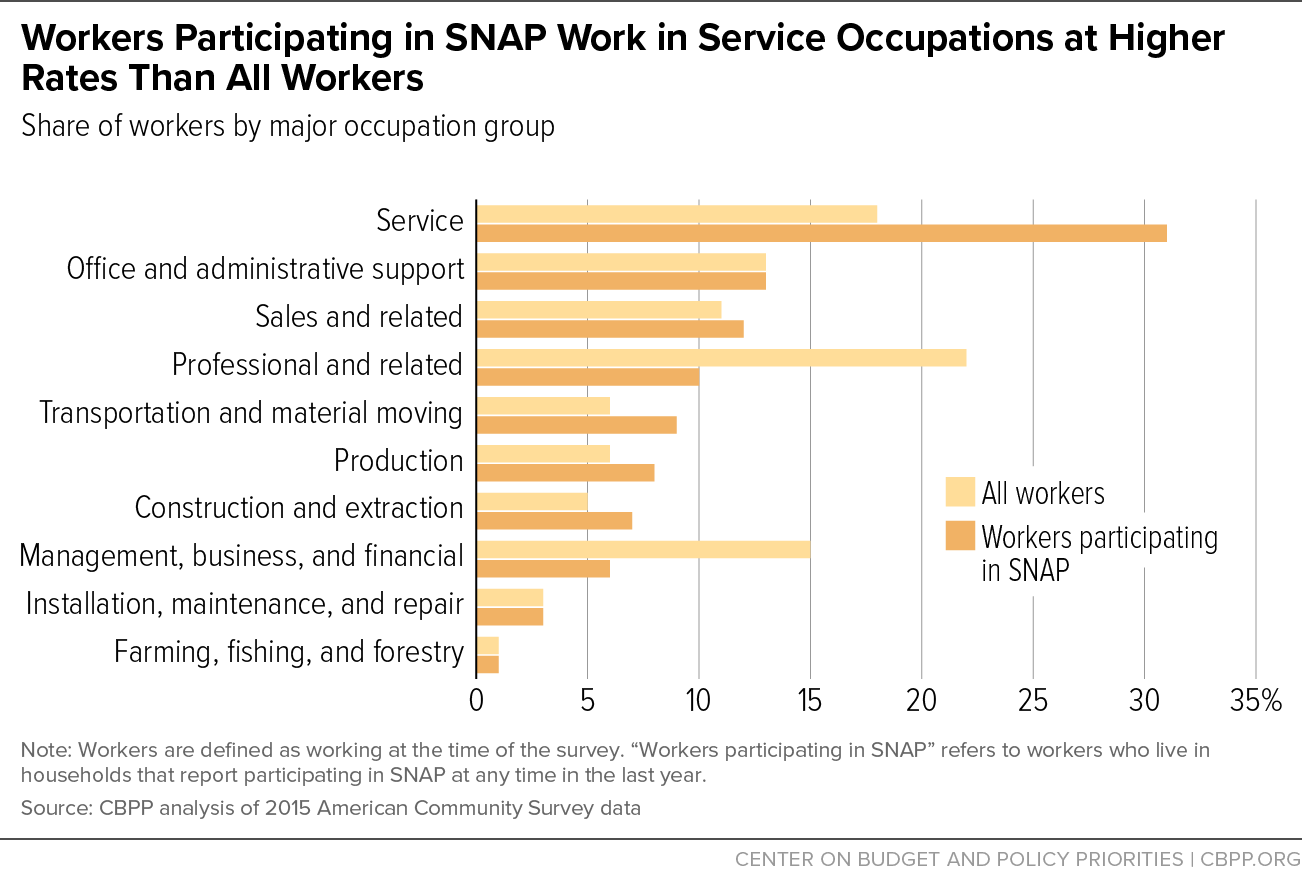


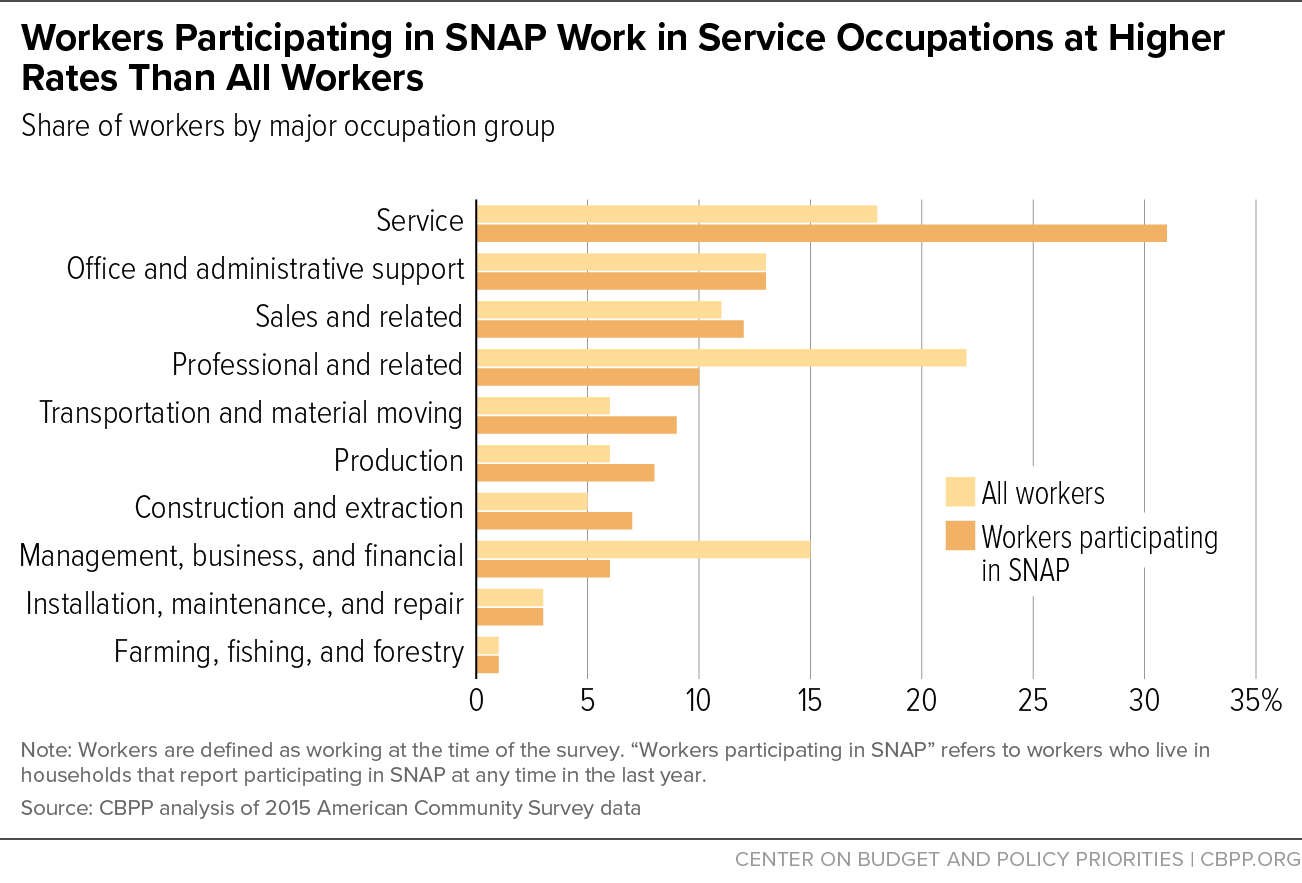
- Service. Some 31 percent of workers participating in SNAP work in service occupations. The most common include cooks, home health aides, janitors, maids, and personal care aides.
- Office and administrative support. Some 13 percent of workers participating in SNAP work in office/administrative support occupations, such as customer service representatives, stock clerks, and administrative assistants.
- Sales and related. About 12 percent of workers participating in SNAP work in sales and related occupations, most commonly as cashiers, retail salespersons, or first-line supervisors of retail workers.
- Professional and related. About 10 percent of workers participating in SNAP (compared to 28 percent of workers overall) had professional jobs, most commonly as teacher assistants or registered nurses.
- Other. Some 34 percent of workers participated in SNAP worked in transportation, production, construction, or other occupations.
In many occupations, particularly service occupations (see Figure 5), at least one-quarter of all workers receive SNAP: personal care aides, maids and housekeeping cleaners, dishwashers, food preparation workers, and nursing, psychiatric, and home health aides. (See Appendix Table 7 for details.) Workers in many of these jobs likely earn low wages or work fewer or less consistent hours than they would like.
Service occupations tend to have low wages. In 2015, for example, only about 26 percent of all workers had wages under $11.75 an hour, compared to more than 40 percent of workers in building and grounds cleaning and maintenance and sales and related occupations, and more than 60 percent of workers in personal care and service and food preparation and serving.[33] Similarly, the majority of workers earning at or below the federal minimum wage worked in service occupations in 2016.[34]
The main industries and occupations in which SNAP participants work demonstrate that the features of low-wage jobs make it difficult for participants to put food on the table. For example, all ten of the most common occupations among SNAP participants had median wages below the national median for all occupations, according to the May 2016 Occupational Employment Survey of the Bureau of Labor Statistics. (See Appendix Table 8 for the most common occupations and median wages.) And three of the top five occupations among SNAP recipients — cashiers, cooks, and maids and housekeeping cleaners — had wages that would leave a single full-time earner supporting two children in poverty.[35] Many of these workers may participate in SNAP to supplement these low wages.
Because SNAP participants work in many industries (such as retail and hospitality) and occupations (such as service and sales) where features such as involuntary part-time work and irregular scheduling are common, they may participate in SNAP to supplement their low incomes due to insufficient or fluctuating hours. Similarly, because workers often cycle in and out of these jobs, workers may participate in SNAP during periods of unemployment or underemployment.
In sum, for millions of working Americans, work does not itself guarantee steady or sufficient income to provide for their families. SNAP responds by providing workers and their families with supplementary income to buy food.
| APPENDIX TABLE 1 | ||||
|---|---|---|---|---|
Workers and Workers Participating in SNAP by Major Industry Group | ||||
| How to read this table: 2,936,000 workers participating in SNAP, or 19.9 percent of workers participating in SNAP, work in the education and health services industry group. By comparison, 34,104,000 workers overall work in the education and health services group, making up 22.8 percent of all workers. | ||||
| Workers Participating in SNAP (000s) | Industry Group’s Share of Workers Participating in SNAP | All workers (000s) | Industry Group’s Share of All Workers | |
| Educational and health services | 2,963 | 19.9% | 34,104 | 22.8% |
| Wholesale and retail trade | 2,576 | 17.3% | 21,176 | 14.2% |
| Leisure and hospitality | 2,393 | 16.1% | 14,457 | 9.7% |
| Professional and business services | 1,473 | 9.9% | 16,992 | 11.4% |
| Manufacturing | 1,382 | 9.3% | 15,433 | 10.3% |
| Construction | 1,146 | 7.7% | 9,632 | 6.4% |
| Other services | 853 | 5.7% | 7,212 | 4.8% |
| Transportation and utilities | 745 | 5.0% | 7,658 | 5.1% |
| Financial activities | 529 | 3.5% | 9,830 | 6.6% |
| Public administration | 353 | 2.4% | 6,874 | 4.6% |
| Agriculture, forestry, fishing, and hunting | 266 | 1.8% | 1,983 | 1.3% |
| Information | 182 | 1.2% | 3,156 | 2.1% |
| Mining | 50 | 0.3% | 893 | 0.6% |
| Total | 14,911 | 100% | 149,400 | 100% |
Note: “Workers participating in SNAP” refers to workers who live in households that report participating in SNAP at any time in the last year. Source: CBPP Analysis of 2015 American Community Survey (ACS) data | ||||
| APPENDIX TABLE 2 | |||
|---|---|---|---|
Workers Participating in SNAP by Major Industry Group, and the Most Common Industries and Occupations Within Them | |||
| Industry Group | Workers Participating in SNAP (000s) | Most Common Industries in This Industry Group Among Workers Participating in SNAP | Most Common Occupations in This Industry Group Among Workers Participating in SNAP |
| Educational and health services | 2,963 | Elementary and Secondary Schools Hospitals Nursing Care Facilities | Nursing, Psychiatric, and Home Health Aides Personal Care Aides Child care Workers |
| Wholesale and retail trade | 2,576 | Grocery Stores Department and Discount Stores Clothing Stores | Cashiers Retail Salespersons First-Line Supervisors Of Retail Sales Workers |
| Leisure and hospitality | 2,393 | Restaurants and Other Food Services Traveler Accommodation Other Amusement, Gambling, and Recreation Industries | Cooks Waiters and Waitresses Cashiers |
| Professional and business services | 1,473 | Services to Buildings and Dwellings Landscaping Services Employment Services | Grounds Maintenance Workers Janitors and Building Cleaners Security Guards |
| Manufacturing | 1,382 | Motor Vehicles and Motor Vehicle Equipment Animal Slaughtering and Processing Furniture and Related Products | Miscellaneous Assemblers and Fabricators Miscellaneous Production Workers Laborers and Freight, Stock, and Material Movers |
| Construction | 1,146 | Construction | Construction Laborers Carpenters Painters and Paperhangers |
| Other services | 853 | Private Households Automotive Repair and Maintenance Beauty Salons | Hairdressers, Hairstylists, and Cosmetologists Maids and Housekeeping Cleaners Automotive Service Technicians and Mechanics |
| Transportation and utilities | 745 | Truck Transportation Services Incidental to Transportation Warehousing and storage | Driver/Sales Workers and Truck Drives Laborers and Freight, Stock, and Material Movers Taxi Drivers and Chauffeurs |
| Financial activities | 529 | Real Estate Insurance Carriers and Related Activities Banking and Related Activities | Property, Real Estate, and Community Association Managers Insurance Sales Agents Customer Service Representatives |
| Public administration | 353 | Justice, Public Order, and Safety Activities Administration of Human Resource Programs Executive Offices and Legislative Bodies | Bailiffs, Correctional Officers, and Jailers Personal Care Aides Police Officers |
| Agriculture, forestry, fishing, and hunting | 266 | Crop Production Animal Production and Aquaculture Support Activities for Agriculture and Forestry | Miscellaneous Agricultural Workers, Including Animal Breeders Farmers, Ranchers, and Other Agricultural Managers Driver/Sales Workers and Truck Drivers |
| Information | 182 | Wired Telecommunications Carriers Broadcasting, Except Internet Motion Picture and Video Industries | Customer Service Representatives Telecommunications Line Installers and Repairers Door-To-Door Sales Workers, News and Street Vendors, and Related Workers |
| Mining | 50 | Support Activities for Mining Nonmetallic Mineral Mining and Quarrying Coal Mining | Miscellaneous Extraction Workers, Including Roof Bolters and Helpers |
| Total | 14,911 | ||
Source: CBPP Analysis of 2015 American Community Survey data Note: “Workers participating in SNAP” refers to workers who live in households that report participating in SNAP at any time in the last year. | |||
| APPENDIX TABLE 3 | |
|---|---|
Industries with the Largest Number of Workers Participating in SNAP | |
| Industry | Workers Participating in SNAP (000s) |
| Restaurants and Other Food Services | 1,771 |
| Construction | 1,146 |
| Elementary and Secondary Schools | 509 |
| Grocery Stores | 472 |
| Hospitals | 426 |
| Department and Discount Stores | 415 |
| Nursing Care Facilities (Skilled Nursing Facilities) | 334 |
| Home Health Care Services | 326 |
| Services to Buildings and Dwellings | 302 |
| Traveler Accommodation | 279 |
| Individual and Family Services | 261 |
| Child Day Care Services | 258 |
| Landscaping Services | 225 |
| Employment Services | 208 |
Source: CBPP Analysis of 2015 American Community Survey data Note: Table omits construction industry group because data for specific industries within this group are not available. “Workers participating in SNAP” refers to workers who live in households that report participating in SNAP at any time in the last year. | |
| APPENDIX TABLE 4 | |||||||
|---|---|---|---|---|---|---|---|
Industries With the Largest Share of Workers Participating in SNAP | |||||||
| Industry | All Workers (000s) | Workers Participating in SNAP (000s) | Share of Workers in industry Participating in SNAP | ||||
| Home Health Care Services | 1,309 | 326 | 24.9% | ||||
| Gasoline Stations | 573 | 129 | 22.5% | ||||
| Miscellaneous General Merchandise Stores | 598 | 124 | 20.8% | ||||
| Services to Buildings and Dwellings | 1,457 | 302 | 20.7% | ||||
| Employment Services | 1,005 | 208 | 20.7% | ||||
| Private Households | 819 | 163 | 19.9% | ||||
| Used Merchandise Stores | 265 | 52 | 19.5% | ||||
| Dry cleaning and Laundry Services | 278 | 53 | 19.2% | ||||
| Vocational Rehabilitation Services | 188 | 36 | 19.2% | ||||
| Barber Shops | 101 | 19 | 19.2% | ||||
| Restaurants and Other Food Services | 9,376 | 1771 | 18.9% | ||||
| Car Washes | 170 | 32 | 18.7% | ||||
| Warehousing and Storage | 485 | 89 | 18.4% | ||||
| Landscaping Services | 1,223 | 225 | 18.4% | ||||
| Department and Discount Stores | 2,270 | 415 | 18.3% | ||||
| Traveler Accommodation | 1,537 | 279 | 18.1% | ||||
| Nursing Care Facilities (Skilled Nursing Facilities) | 1,907 | 334 | 17.5% | ||||
| Animal Slaughtering and Processing | 440 | 77 | 17.4% | ||||
| Taxi and Limousine Service | 325 | 56 | 17.4% | ||||
| Cut and Sew Apparel | 213 | 36 | 17.0% | ||||
| Child Day Care Services | 1,526 | 258 | 16.9% | ||||
| Residential Care Facilities, Except Skilled Nursing Facilities | 1,015 | 171 | 16.8% | ||||
| Bakeries and Tortilla, Except Retail Bakeries | 228 | 38 | 16.6% | ||||
| Business Support Services | 789 | 127 | 16.1% | ||||
| Shoe Stores | 182 | 29 | 16.0% | ||||
| Grocery Stores | 2,979 | 472 | 15.9% | ||||
| Individual and Family Services | 1,648 | 261 | 15.8% | ||||
| Retail Bakeries | 173 | 27 | 15.7% | ||||
| Crop Production | 1,091 | 170 | 15.6% | ||||
| Other Direct Selling Establishments | 155 | 24 | 15.2% | ||||
| Recyclable Material Merchant Wholesalers | 104 | 16 | 15.2% | ||||
| All industries | 149,400 | 14,911 | 10.0% | ||||
How to read this table: 326,000 workers participating in SNAP work in the home health care industry, making up 24.9 percent of the 1,309,000 workers in this industry group. Source: CBPP Analysis of 2015 American Community Survey data Note: Excludes industries with small sample sizes (below roughly 6,000 workers). “Workers participating in SNAP” refers to workers who live in households that report participating in SNAP at any time in the last year. Source: CBPP Analysis of 2015 American Community Survey data Note: Table omits construction industry group because data for specific industries within this group are not available. “Workers participating in SNAP” refers to workers who live in households that report participating in SNAP at any time in the last year. | |||||||
| APPENDIX TABLE 5 | |||||||
|---|---|---|---|---|---|---|---|
Workers and Workers Participating in SNAP by Major Occupation Group | |||||||
| How to read this table: 4,669,000 workers participating in SNAP work in service occupations, making up 31.3 percent of SNAP workers. By comparison, 26,637,000 workers overall work in service occupations, making up 17.8 percent of all workers. | |||||||
| Occupation Group | Workers Participating in SNAP (000s) | Occupation Group Share of Workers participating in SNAP | Number of Workers in occupation group (000s) | Major Occupation Group as a Share of all Workers | |||
| Service occupations | 4,669 | 31.3% | 26,637 | 17.8% | |||
| Office and administrative support occupations | 1,902 | 12.8% | 19,351 | 13.0% | |||
| Sales and related occupations | 1,774 | 11.9% | 15,768 | 10.6% | |||
| Professional and related occupations | 1,453 | 9.7% | 33,074 | 22.1% | |||
| Transportation and material moving occupations | 1,383 | 9.3% | 9,525 | 6.4% | |||
| Production occupations | 1,195 | 8.0% | 8,903 | 6.0% | |||
| Construction and extraction occupations | 1,049 | 7.0% | 7,674 | 5.1% | |||
| Management, business, and financial occupations | 838 | 5.6% | 22,662 | 15.2% | |||
| Installation, maintenance, and repair occupations | 434 | 2.9% | 4,730 | 3.2% | |||
| Farming, fishing, and forestry occupations | 214 | 1.4% | 1,074 | 0.7% | |||
| Total | 14,911 | 100% | 149,400 | 100% | |||
Note: “Workers participating in SNAP” refers to workers who live in households that report participating in SNAP at any time in the last year. Source: CBPP Analysis of 2015 American Community Survey data | |||||||
| APPENDIX TABLE 6 | ||
|---|---|---|
Workers Participating in SNAP by Major Occupation Groups, and the Most Common Occupations Within Them | ||
| How to read this table: 4,669,000 workers participating in SNAP work in service occupations, most commonly as cooks, home health aides, and janitors or building cleaners. | ||
| Workers Participating in SNAP (000s) | Most Common Occupations Among Workers Participating in SNAP in This Major Occupation Group | |
| Service occupations | 4,669 | Cooks Nursing, Psychiatric, and Home Health Aides Janitors and Building Cleaners |
| Office and administrative support occupations | 1,902 | Customer Service Representatives Stock Clerks and Order Fillers Secretaries and Administrative Assistants |
| Sales and related occupations | 1,774 | Cashiers Retail Salespersons First-Line Supervisors of Retail Sales Workers |
| Professional and related occupations | 1,453 | Teacher Assistants Registered Nurses Elementary and Middle School Teachers |
| Transportation and material moving occupations | 1,383 | Driver/Sales Workers and Truck Drivers Laborers and Freight, Stock, and Material Movers, Hand Packers and Packagers |
| Production occupations | 1,195 | Miscellaneous Production Workers, Including Semiconductor Processors Miscellaneous Assemblers and Fabricators Inspectors, Testers, Sorters, Samplers, and Weighers |
| Construction and extraction occupations | 1,049 | Construction Laborers Carpenters Painters and Paperhangers |
| Management, business, and financial occupations | 838 | Miscellaneous Managers, Including Funeral Service Managers and Postmasters and Mail Superintendents Food Service Managers Accountants and Auditors |
| Installation, maintenance, and repair occupations | 434 | Automotive Service Technicians and Mechanics Maintenance and Repair Workers, General Heating, Air Conditioning, and Refrigeration Mechanics and Installers |
| Farming, fishing, and forestry occupations | 214 | Miscellaneous Agricultural Workers, Including Animal Breeders Graders and Sorters, Agricultural Products Logging Workers |
| Total | 14,911 | |
Note: “Workers participating in SNAP” refers to workers who live in households that report participating in SNAP at any time in the last year. Source: CBPP Analysis of 2015 American Community Survey data. | ||
| APPENDIX TABLE 7 | ||||
|---|---|---|---|---|
Occupations with the Largest Share of Workers Participating in SNAP | ||||
| How to read this table: 380,000 personal care aides, 27.3 percent of the 1,394,000 total personal care aides, participate in SNAP. The average median wage among all personal care aides was $10.54 in 2016. | ||||
| Occupation | Median Hourly Wage Among All Workers | All Workers (000s) | Workers in occupation Participating in SNAP (000s) | Share of Workers in occupation Participating in SNAP |
| Personal Care Aides | $10.54 | 1,394 | 380 | 27.3% |
| Maids and Housekeeping Cleaners | $10.49 | 1,564 | 421 | 26.9% |
| Dishwashers | $10.00 | 313 | 83 | 26.4% |
| Graders and Sorters, Agricultural Products | $10.83 | 52 | 14 | 26.0% |
| Packers and Packagers, Hand | $10.64 | 479 | 125 | 26.0% |
| Combined Food Preparation and Serving Workers, Including Fast Food | $9.35 | 378 | 98 | 26.0% |
| Laundry and Dry-Cleaning Workers | $10.34 | 186 | 47 | 25.5% |
| Telemarketers | $11.69 | 80 | 20 | 24.8% |
| Nursing, Psychiatric, and Home Health Aides | $11.93 | 2,048 | 498 | 24.3% |
| Roofers | $18.15 | 215 | 52 | 24.1% |
| Transportation Attendants, Except Flight Attendants | $12.53 | 34 | 8 | 24.0% |
| Cashiers | $9.71 | 3,296 | 780 | 23.7% |
| Cooks | $10.99 | 2,337 | 537 | 23.0% |
| Pressers, Textile, Garment, and Related Materials | $10.24 | 43 | 9 | 22.3% |
| Insulation Workers | $18.89 | 40 | 9 | 21.8% |
| Crossing Guards | $12.84 | 65 | 14 | 21.7% |
| Miscellaneous Agricultural Workers, Including Animal Breeders | $10.83 | 835 | 178 | 21.4% |
| Drywall Installers, Ceiling Tile Installers, and Tapers | $20.33 | 151 | 32 | 21.4% |
| Sawing Machine Setters, Operators, and Tenders, Wood | $13.65 | 34 | 7 | 21.3% |
| Parking Lot Attendants | $10.45 | 81 | 17 | 20.6% |
| Food Batch-makers | $13.37 | 93 | 19 | 20.6% |
| All occupations | $17.81 | 149,400 | 14,911 | 10.0% |
Note: Median hourly wage statistics are from a different source than the number of workers and are for all workers studied. Excludes occupations with small sample sizes (below roughly 6,000 workers). Note: “Workers participating in SNAP” refers to workers who live in households that report participating in SNAP at any time in the last year. Source: CBPP Analysis of 2015 American Community Survey data and May 2016 Occupational Employment Statistics for hourly wage data. | ||||
| APPENDIX TABLE 8 | ||
|---|---|---|
Occupations With the Largest Number of Workers Participating in SNAP | ||
| Occupation | Workers Participating in SNAP (000s) | Median Hourly Wage Among All Workers, 2016 |
| All occupations | 14,911 | $17.81 |
| Cashiers | 780 | $9.70 |
| Cooks | 537 | $10.99 |
| Nursing, Psychiatric, and Home Health Aides | 498 | $11.93 |
| Janitors and Building Cleaners | 440 | $11.63 |
| Maids and Housekeeping Cleaners | 421 | $10.49 |
| Driver/Sales Workers and Truck Drivers | 411 | $17.63 |
| Retail Salespersons | 407 | $10.90 |
| Laborers and Freight, Stock, and Material Movers, Hand | 380 | $12.49 |
| Personal Care Aides | 380 | $10.54 |
| Customer Service Representatives | 368 | $15.53 |
| Waiters and Waitresses | 352 | $9.61 |
| Construction Laborers | 328 | $16.07 |
| Stock Clerks and Order Fillers | 285 | $11.46 |
| First-Line Supervisors of Retail Sales Workers | 268 | $18.77 |
| Grounds Maintenance Workers | 247 | $12.90 |
| Childcare Workers | 214 | $10.18 |
| Secretaries and Administrative Assistants | 214 | $17.90 |
| Food Preparation Workers | 192 | $10.31 |
| Miscellaneous Production Workers | 187 | $13.28 |
| Carpenters | 178 | $20.96 |
| Miscellaneous Agricultural Workers, Including Animal Breeders | 178 | $10.83 |
Source: CBPP Analysis of 2015 American Community Survey data and May 2016 Occupational Employment Statistics for hourly wage data. Note: Median hourly wage statistics are from a different source than the number of workers and are for all workers studied. “Workers participating in SNAP” refers to workers who live in households that report participating in SNAP at any time in the last year. | ||
Appendix: Methodology
This report (and the various Appendix tables) analyzed data from the 2015 American Community Survey (ACS) to examine the occupations and industries of civilian workers who were in households that reported participating in SNAP in the last 12 months. In the ACS, there were 15.1 million households with 50.8 million people who reported participating in SNAP at any point in the last 12 months. Of those individuals, 14.9 million reported they were working at the time of the survey.
This data is illustrative of the occupations and industries of workers in families participating in SNAP, but with several caveats with regards to measurement of SNAP participation and work. First, the ACS measures SNAP at the household level, and individuals in SNAP households may not be eligible for participation (such as ineligible students or non-citizens), even though other household members participate in SNAP. Second, report of SNAP receipt is imperfect, and there is frequently under-reporting of SNAP receipt in survey data. Third, SNAP receipt includes participation at any point in the last year for any length of time, while questions about work cover the previous week only. A household’s participation in SNAP may not coincide with work, such as when a household member gains employment after having received SNAP during a period of unemployment.
Because SNAP participants frequently turn to SNAP when they lose a job, monthly work rates are significantly lower than work rates among those who have received SNAP at any point in the last year. For example, in SNAP administrative data, about 32 percent of households had earnings while participating in SNAP in 2015. In the ACS, 60 percent of households who reported participating in SNAP in the last year had a member who reported they were currently working. Therefore, characteristics of SNAP households in the ACS represent the work profile of households currently or recently participating in SNAP.
End Notes
[1] The threshold used here for illustrative purposes is a median annual wage equivalent to 125 percent of the poverty line for a family of three with two children, or $24,171 or less in 2016. CBPP analysis of May 2016 Occupational Employment and Wage Estimates, Bureau of Labor Statistics.
[2] Bureau of Labor Statistics, Table 1.4, Occupations with the most job growth, 2014 and projected 2024, https://www.bls.gov/emp/ep_table_104.htm.
[3] Bureau of Labor Statistics. Table 6. Selected paid leave benefits: Access, https://www.bls.gov/news.release/ebs2.t06.htm.
[4] Mark Prell, Constance Newman, and Erik Scherpf, “Annual and Monthly SNAP Participation Rates,” USDA Economic Research Service, August 2015, https://www.ers.usda.gov/publications/pub-details/?pubid=45414.
[5] For more on SNAP and work, see Dottie Rosenbaum, “The Relationship Between SNAP and Work,” Center on Budget and Policy Priorities, January 2013, https://www.cbpp.org/sites/default/files/atoms/files/1-29-13fa.pdf.
[6] For more information on the EITC, see “Policy Basics: The Earned Income Tax Credit,” Center on Budget and Policy Priorities, https://www.cbpp.org/research/federal-tax/policy-basics-the-earned-income-tax-credit. The EITC provides more income than SNAP for many families and is not limited to food purchases, but SNAP provides monthly income that gives working families more immediate assistance to buy food.
[7] Vincent Fusaro and H. Luke Shaefer, “How should we define ‘low-wage’ work? An analysis using the Current Population Survey,” Bureau of Labor Statistics, Monthly Labor Review, October 2016, https://www.bls.gov/opub/mlr/2016/article/how-should-we-define-low-wage-work.htm. There is no single definition of “low-wage” jobs. Many researchers compare wages to poverty standards; others compare wages to median wages or to another point in the wage distribution (such as wages in the bottom quartile). In this paper, when referring to specific literature, we specify the definition used for low-wage work; otherwise, the term is used more broadly to connote jobs where a full-time worker would earn a wage insufficient to support a family, or industries or occupations where these jobs are more prevalent.
[8] Brian Thiede, Daniel Lichter, and Scott Sanders, “America’s Working Poor: Conceptualization, Measurement, and New Estimates,” Work and Occupations, Vol. 42, Issue 3, April 2015, http://journals.sagepub.com/doi/abs/10.1177/0730888415573635?journalCode=woxb.
[9] David Autor and David Dorn, “The Growth of Low-Skill Service Jobs and the Polarization of the U.S. Labor Market,” American Economic Review, Vol. 103, No. 5, August 2013, https://www.aeaweb.org/articles?id=10.1257/aer.103.5.1553 and Melissa Kearney, Brad Hershbein, and Elisa Jacome, “Profiles of Change: Employment, Earnings, and Occupations from 1990-2013,” Hamilton Project, Brookings Institution, April 20, 2015, http://www.hamiltonproject.org/papers/profiles_of_change_employment_earnings_occupations_1990-2013. Both discuss how, particularly among workers with less than a college degree, service occupations have increased as a share of employment over the last decades. As discussed later, a much greater share of workers in service occupations such as personal care and service, food preparation and serving, and building and grounds maintenance have low wages than all workers: https://www.bls.gov/oes/2016/may/distribution.htm. Two-thirds of minimum-wage workers in 2016 worked in service occupations: https://www.bls.gov/opub/reports/minimum-wage/2016/home.htm.
[10] The threshold used here for illustrative purposes is a median annual wage equivalent to 125 percent of the poverty line for a family of three with two children, or $24,171 or less in 2016. CBPP analysis of May 2016 Occupational Employment and Wage Estimates, Bureau of Labor Statistics.
[11] Bureau of Labor Statistics, “Table 1.4, Occupations with the most job growth, 2014 and projected 2024,” https://www.bls.gov/emp/ep_table_104.htm.
[12] Lonnie Golden. “Still falling short on hours and pay,” Economic Policy Institute, December 5, 2016, http://www.epi.org/files/pdf/114028.pdf.
[13]Maria Canon et al., “Flows to and from ‘Working Part-Time for Economic Reasons’ and the Labor Market Aggregates During and After the 2007-2009 Great Recession,” Federal Reserve Bank of Richmond, March 6, 2015, https://www.richmondfed.org/-/media/richmondfedorg/research/economists/bios/pdfs/kudlyak_flows_to_and_from.pdf.
[14] Two recent papers summarize research on the topic: Heather Boushey and Bridget Ansel, “Working by the hour,” Washington Center for Equitable Growth, September 2016, http://equitablegrowth.org/research-analysis/working-by-the-hour-the-economic-consequences-of-unpredictable-scheduling-practices/ and Lonnie Golden, “Irregular work scheduling and its consequences,” Economic Policy Institute, April 2015, http://www.epi.org/publication/irregular-work-scheduling-and-its-consequences/. The Center for Law and Social Policy also has a repository of resources on job scheduling: http://www.clasp.org/issues/work-life-and-job-quality/scheduling-resources.
[15] One study found that a higher share of workers in sales and service occupations had irregular work shifts than other workers. Workers earning less than $22,500 were also likelier to experience irregular work schedules. (Golden 2015). Another study that looked at data for young workers (ages 26 to 32) found that workers in four occupations (janitors and housekeepers, food service workers, retail workers, and home care workers) experienced schedule fluctuation at relatively high rates, experienced a greater number of fluctuating hours, were likelier to have one week or less of notice of their schedule, or were likelier to have an employer decide their schedule. Susan Lamber, Peter Fugiel, and Julia Henly. “Precarious Work Schedules Among Early-Career Employees in the U.S.,” University of Chicago, August 2014, https://ssascholars.uchicago.edu/sites/default/files/work-scheduling-study/files/lambert.fugiel.henly_.precarious_work_schedules.august2014_0.pdf.
[16] Board of Governors of the Federal Reserve, “Report on the Economic Well-Being of U.S. Households in 2015,” May 2016, https://www.federalreserve.gov/2015-report-economic-well-being-us-households-201605.pdf.
[17] Stephanie Luce, Sasha Hammad, and Darrah Sipe, “Short Shifted,” Retail Action Project, http://retailactionproject.org/wp-content/uploads/2014/09/ShortShifted_report_FINAL.pdf; Julia Henly, H. Luke Schaefer, and Elaine Waxman, “Nonstandard Work Schedules: Employer- and Employee-Driven Flexibility in Retail Jobs,” Social Service Review, December 2006; Dani Carrillo et al., “On-call job, on-call family: the necessity of family support among retail workers with instable work schedules,” Washington Center for Equitable Growth working paper, November 2016, http://cdn.equitablegrowth.org/wp-content/uploads/2016/10/25123457/110116-WP-retail-workers-with-unstable-schedules.pdf; “Juggling Time,” CLASP and UCLA Labor Center, December 2016, http://www.clasp.org/resources-and-publications/publication-1/UCLA_YoungWorkerScheduling.pdf.
[18] Bureau of Labor Statistics, Table 6. Selected paid leave benefits: Access, https://www.bls.gov/news.release/ebs2.t06.htm.
[19] Bureau of Labor Statistics, Table 32. Leave benefits: access, private industry workers, March 2016, https://www.bls.gov/ncs/ebs/benefits/2016/ownership/private/table32a.htm. While the Family and Medical Leave Act (FMLA) and some state and local laws require employers to provide unpaid leave for family and medical leave reasons such as the birth of a baby, not all employees are eligible. For example, employees who have worked for an employer for fewer than 12 months or work for a company with fewer than 50 employees (within a 75-mile radius) may not be required to be protected under the law.
[20] Heather Hill, “Paid Sick Leave and Job Stability,” Work and Occupations, Vol. 40, Issue 2, 2013, https://www.ncbi.nlm.nih.gov/pmc/articles/PMC3825168/.
[21] Lynda Laughlin, “Maternity Leave and Employment Patterns of First-Time Mothers: 1961-2008,” Census Bureau, October 2011, https://www.census.gov/prod/2011pubs/p70-128.pdf.
[22] Abt Associates for the Department of Labor, “Family and Medical Leave in 2012: Technical Report,” revised April 18, 2014, https://www.dol.gov/asp/evaluation/fmla/FMLA-2012-Technical-Report.pdf.
[23] Tables from the Bureau of Labor Statistics’ National Compensation Survey show that workers with wages in the bottom quartile are less likely to have access to health insurance and retirement benefits, and to participate if they are available. See Table 2, Medical care benefits: Access, participation, and take-up rates, Bureau of Labor Statistics, https://www.bls.gov/news.release/ebs2.t02.htm and Table 1: Retirement benefits: Access, participation, and take-up rates, https://www.bls.gov/news.release/ebs2.t01.htm.
[24] For a discussion of the impacts of lacking health insurance, see “Kaiser Family Foundation, “Key Facts about the Uninsured Population,” September 29, 2016, http://kff.org/uninsured/fact-sheet/key-facts-about-the-uninsured-population/. For information on retirement, see Monique Morrissey, “The State of American Retirement,” Economic Policy Institute, March 3, 2016, http://www.epi.org/publication/retirement-in-america/.
[25] For example, the retail trade and accommodation and food services industries, which employ significant numbers of low-wage workers, had relatively high rates of separations in 2016, or workers leaving the job as a share of total workers (also referred to as the “turnover rate”), compared to all workers. See Bureau of Labor Statistics, “Job Openings and Labor Turnover, January 2017,” https://www.bls.gov/news.release/archives/jolts_03162017.htm.
[26] Arindrajit Dube, William Lester, and Michael Reich, “Minimum Wage Shocks, Employment Flows and Labor Market Frictions,” University of California Berkeley Institute for Research on Labor and Employment, October 2014, http://irle.berkeley.edu/files/2013/Minimum-Wage-Shocks-Employment-Flows-and-Labor-Market-Frictions.pdf; Susan Lambert, Anna Haley-Lock, and Julia Henly, “Schedule flexibility in hourly jobs: unanticipated consequences and promising directions,” Community, Work, and Family, Vol. 15, No. 3, August 2012, https://ssascholars.uchicago.edu/sites/default/files/work-scheduling-study/files/136688032e20122e662803_0.pdf; Lambert, Fugiel, and Henly.
[27] David Weil. “Enforcing Labour Standards in Fissured Workplaces: the U.S. Experience,” Economic and Labour Relations Review, Vol. 22, No. 2, http://web.law.columbia.edu/sites/default/files/microsites/career-services/David%20Weil%20Enforcing%20Labour%20Standards%20in%20Fissured%20Workplaces.pdf; Lawrence Katz and Alan Krueger, “The Rise and Nature of Alternative Work Arrangements in the United States, 1995-2015,” NBER Working Paper 22667, September 2016, http://www.nber.org/papers/w22667.pdf.
[28] For example, two longitudinal surveys from the Bureau of Labor Statistics that follow workers show that over time, workers with lower levels of educational attainment spend more weeks unemployed and have more short job spells. See: https://www.bls.gov/news.release/nlsoy.t03.htm, https://www.bls.gov/news.release/nlsyth.t05.htm, and https://www.bls.gov/news.release/nlsyth.t03.htm.
[29]Maria Enchautegui, “Disadvantaged Workers and the Unemployment Insurance Program,” Urban Institute, June 2012, http://www.urban.org/sites/default/files/publication/25661/412620-Disadvantaged-Workers-and-the-Unemployment-Insurance-Program.PDF and Rachel West et al., “Strengthening Unemployment Protections in America,” Center for American Progress, National Employment Law Project, and Georgetown Center on Poverty and Inequality, June 2016, https://www.americanprogress.org/issues/poverty/reports/2016/06/16/138492/strengthening-unemployment-protections-in-america/.
[30] Government Accountability Office, “Unemployment Insurance: Receipt of Benefits Has Declined, with Continued Disparities for Low-Wage and Part-Time Workers,” September 2007, http://www.gao.gov/new.items/d071243t.pdf.
[31] Alix Gould-Werth and H. Luke Shaefer, “Unemployment Insurance participation by education and by race and ethnicity,” Bureau of Labor Statistics, Monthly Labor Review, October 2012, https://www.bls.gov/opub/mlr/2012/10/art3full.pdf.
[32] In this report, “workers participating in SNAP” are civilians who report they are currently employed and are in a household that reported participating in SNAP in the last year; the workers may not be participants themselves and may have participated in SNAP while they were not working. For more information on the data and methodology and caveats in interpreting the data, see the Appendix.
[33] https://www.bls.gov/oes/2016/may/distribution.htm
[34] https://www.bls.gov/opub/reports/minimum-wage/2016/home.htm
[35] CBPP calculations from 2016 Bureau of Labor Statistics Occupational Employment Survey data