SNAP Helps Millions of Low-Income Seniors
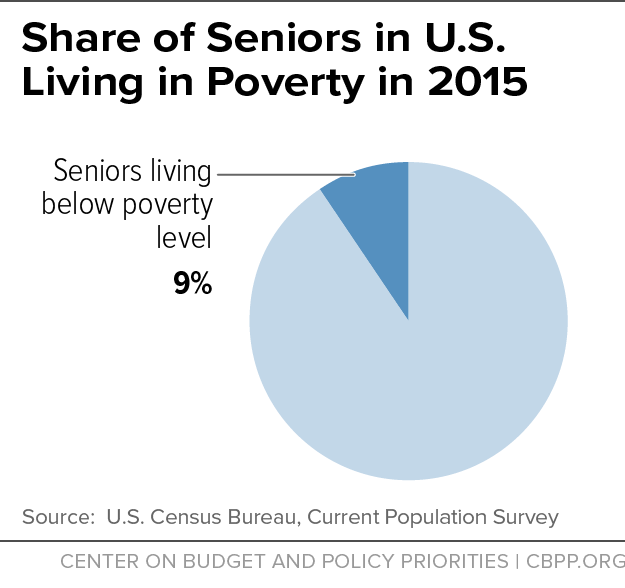
Nearly 67 million people in the United States are age 60 and older, and are eligible for a number of government programs designed to assist with basic life needs. Despite their eligibility for these benefits, about 6.3 million seniors, or 9 percent of seniors, live below the poverty level.[1] (See Figure 1.) Many live on fixed incomes and have limited financial means to afford expenses such as food, medical, or housing costs. Many are also disabled or take care of children. For these seniors, the Supplemental Nutrition Assistance Program (SNAP) plays an important role. While it provides a modest benefit, it enables them to shift their resources towards other immediate needs.
- SNAP provides 4.8 million seniors with resources to afford an adequate diet.[2] This represents 11 percent of all SNAP recipients in 2015.[3]
- Seniors receiving SNAP benefits mostly live alone: only 1 in 4 live in households with other members.[4]
- SNAP provided an estimated $6.6 billion to SNAP households with seniors in 2016, two-thirds of which went to households in which seniors lived alone.
SNAP Supplements Low-Income Seniors’ Income
- Together, housing, health care, transportation, and food comprise the largest share of all U.S. households’ expenses.[5] SNAP helps low-income seniors — many of whom are on fixed incomes — afford food while also covering their other household expenses.
- In 2015, a typical SNAP household with an elderly member included a single elderly individual and had a monthly income of about $912 (not including SNAP), or about $10,940 a year. This income falls under the poverty line for a single-person household ($11,770 in 2015). Some 71 percent of SNAP households with an elderly member had incomes below the poverty line in 2015.
- On average, SNAP households with an elderly member received $128 in benefits each month in 2015, or about $1,500 a year, boosting their income by 14 percent.
Many Low-Income Households with Seniors Cannot Afford Adequate Food
- In 2015, 28 percent of all U.S. households included individuals aged 65 and older. Of this group, 8.3 percent (2.9 million) were food insecure, meaning that these households had difficulty affording nutritious, adequate food. This share remains higher than it was before the recession, in 2007, when 6.5 percent (1.8 million) of these households were food insecure. [6]
- Food insecurity rates are higher for low-income households: in 2015, 1 in 4 U.S. households (4.7 million) with incomes below 130 percent of the poverty line included elderly individuals. Of this group, 25 percent (1.2 million) were food insecure. Seniors lived alone in almost half (574,000) of the low-income, food-insecure households with an elderly member. [7]
- Research indicates that food-insecure seniors have less nutritious diets, have worse health outcomes, and are at higher risk for depression than food-secure seniors. Compared to other adult age groups, seniors are particularly vulnerable to the health consequences of food insecurity. Households with grandchildren are almost three times as likely to be food insecure.[8] SNAP benefits help to alleviate these adverse conditions.
The Number of Low-Income Seniors Receiving SNAP Is Likely to Grow
- The number of senior SNAP recipients is likely to increase, as the elderly population, the number of seniors in poverty, and the number of seniors participating in SNAP continue to grow.
- The U.S. population aged 60 and older has increased from 52 million to 67 million, a 29 percent increase between 2007 and 2015.[9] Over the same period, the number of seniors living below the poverty grew by 27 percent, from 5 to 6.3 million.[10] The number of people 60 and over is projected to increase to 82 million by 2025.[11]
- As states have improved their outreach to seniors, the share of eligible seniors that receive SNAP has grown from 33 percent in 2010 to 42 percent in 2014. But there’s still room for SNAP to improve in reaching seniors — among all individuals eligible for SNAP, some 83 percent participated in 2014.[12]
- Senior participation in SNAP is also likely to increase as food-insecure middle-aged individuals age over the coming decades and become eligible for benefits. A study of food insecurity among middle-aged individuals found that increases in food insecurity were most pronounced for people aged 40-49 and 50-59.[13] The number of individuals between 45 and 64 years old that lived below the income poverty level in 2015 was double that of the population 65 years and older. [14]
- Many of these seniors may need a lot of help. In 2015, 2 percent of the U.S. elderly population (about a million seniors) lived with and were financially responsible for the welfare of their grandchildren. Some 31 percent of the U.S. elderly civilian non-institutionalized population (19 million seniors) were disabled.[15]
| Selected Characteristics of Seniors Receiving SNAP, 2015 | ||
|---|---|---|
| Number of Seniors Receiving SNAP | Share of all Seniors Receiving SNAP a | |
| Total Seniors, Age 60 and Older, Receiving SNAP | 4,799,100 | 100% |
| Age | ||
| 60 to 64 | 1,549,500 | 32% |
| 65 to 69 | 1,086,100 | 23% |
| 70 to 74 | 770,400 | 16% |
| 75 to 79 | 645,900 | 13% |
| 80 and over | 746,900 | 16% |
| Household Gross Income | ||
| At or below 50 percent of poverty level | 550,400 | 13% |
| 51-100% of poverty level | 2,556,100 | 59% |
| 100%+ of poverty level | 1,254,300 | 29% |
| Household Composition b | ||
| Living alone | 3,495,200 | 73% |
| Living with children | 207,300 | 4% |
| Living with other non-elderly adults or seniors, no children in household | 1,096,500 | 23% |
| Citizenship Status b | ||
| Citizen (U.S. born and naturalized) | 4,302,500 | 90% |
| Non-citizen (refugees, legal permanent residents, and other eligible non-citizens) | 496,500 | 10% |
| Seniors Receiving SNAP as a Share of the Population by State, Average SNAP Benefits, 2015 | ||||||
|---|---|---|---|---|---|---|
| State | SNAP Seniors a | Share of State's Seniors Receiving SNAP b | SNAP Households with Seniors | Average Monthly SNAP Benefits, All Households with Seniors | Percentage of SNAP Households with Seniors, with Gross Incomes Under 51% of Poverty | Percentage of SNAP Households with Seniors, with Gross Incomes 51-100% of Poverty |
| Alabama | 71,100 | 7% | 67,700 | $115 | 11% | 67% |
| Alaska | 7,000 | 6% | 6,600 | $187 | 21% | 33% |
| Arizona | 83,700 | 6% | 73,800 | $105 | 15% | 62% |
| Arkansas | 35,800 | 5% | 33,500 | $80 | 6% | 73% |
| California | 172,600 | 2% | 156,700 | $157 | 24% | 33% |
| Colorado | 44,600 | 4% | 42,100 | $119 | 5% | 68% |
| Connecticut | 58,500 | 7% | 53,900 | $158 | 8% | 54% |
| Delaware | 11,100 | 5% | 10,000 | $119 | 13% | 47% |
| District of Columbia | 14,200 | 13% | 13,500 | $116 | 22% | 53% |
| Florida | 511,600 | 10% | 454,400 | $137 | 15% | 58% |
| Georgia | 157,200 | 8% | 145,400 | $107 | 8% | 61% |
| Hawaii | 25,100 | 8% | 22,900 | $244 | 19% | 66% |
| Idaho | 15,600 | 5% | 14,300 | $106 | 9% | 66% |
| Illinois | 228,100 | 9% | 210,000 | $130 | 14% | 61% |
| Indiana | 54,700 | 4% | 52,100 | $99 | 7% | 69% |
| Iowa | 31,200 | 4% | 28,200 | $87 | 4% | 58% |
| Kansas | 21,700 | 4% | 19,900 | $92 | 7% | 71% |
| Kentucky | 65,700 | 7% | 60,900 | $117 | 22% | 64% |
| Louisiana | 69,500 | 7% | 66,800 | $117 | 13% | 70% |
| Maine | 28,700 | 8% | 25,600 | $120 | 4% | 45% |
| Maryland | 84,500 | 7% | 77,600 | $108 | 11% | 59% |
| Massachusetts | 145,400 | 10% | 130,300 | $137 | 11% | 55% |
| Michigan | 174,500 | 8% | 162,800 | $129 | 10% | 60% |
| Minnesota | 53,100 | 5% | 49,800 | $105 | 9% | 62% |
| Mississippi | 54,900 | 9% | 52,000 | $96 | 8% | 71% |
| Missouri | 70,500 | 5% | 65,100 | $115 | 11% | 68% |
| Montana | 10,300 | 4% | 9,600 | $114 | 7% | 70% |
| Nebraska | 14,500 | 4% | 13,700 | $96 | 8% | 62% |
| Nevada | 45,000 | 8% | 40,400 | $103 | 12% | 55% |
| New Hampshire | 10,700 | 3% | 9,800 | $118 | 5% | 60% |
| New Jersey | 142,100 | 8% | 127,100 | $129 | 11% | 59% |
| New Mexico | 38,900 | 8% | 35,700 | $117 | 13% | 70% |
| New York | 631,000 | 15% | 548,500 | $180 | 11% | 64% |
| North Carolina | 151,000 | 7% | 135,800 | $85 | 8% | 51% |
| North Dakota | 6,600 | 4% | 6,000 | $167 | 7% | 57% |
| Ohio | 173,700 | 7% | 160,200 | $115 | 6% | 60% |
| Oklahoma | 47,500 | 6% | 45,500 | $90 | 7% | 76% |
| Oregon | 95,700 | 10% | 89,600 | $115 | 7% | 53% |
| Pennsylvania | 229,200 | 8% | 206,400 | $121 | 5% | 58% |
| Rhode Island | 26,700 | 11% | 26,000 | $140 | 5% | 57% |
| South Carolina | 69,100 | 6% | 64,600 | $98 | 13% | 63% |
| South Dakota | 7,500 | 4% | 6,700 | $161 | 10% | 58% |
| Tennessee | 113,200 | 8% | 105,100 | $91 | 9% | 73% |
| Texas | 338,900 | 7% | 305,100 | $128 | 34% | 47% |
| Utah | 13,600 | 3% | 12,600 | $99 | 14% | 66% |
| Vermont | 13,800 | 9% | 13,100 | $156 | 3% | 46% |
| Virginia | 92,100 | 5% | 86,800 | $101 | 11% | 66% |
| Washington | 104,000 | 7% | 95,300 | $138 | 8% | 55% |
| West Virginia | 34,800 | 7% | 32,200 | $76 | 9% | 65% |
| Wisconsin | 88,300 | 7% | 79,800 | $84 | 6% | 39% |
| Wyoming | 1,900 | 2% | 1,800 | $99 | 4% | 80% |
| Guam | 3,200 | - | 2,600 | $297 | 39% | 39% |
| Virgin Islands | 2,800 | - | 2,500 | $206 | 35% | 45% |
| United States c | 4,799,100 | 7% | 4,360,800 | $128 | 13% | 59% |
End Notes
[1] Census Bureau, 2016 Current Population Survey’s Annual Social and Economic Supplement.
[2] Seniors are defined as individuals aged 60 years and older, unless otherwise noted.
[3] Kelsey Farson Gray, Sarah Fisher, and Sarah Lauffer, “Characteristics of Supplemental Nutrition Assistance Program Households: Fiscal Year 2015,” prepared for the Food and Nutrition Service, USDA, November 2016, https://www.fns.usda.gov/snap/characteristics-supplemental-nutrition-assistance-households-fiscal-year-2015.
[4] Ibid.
[5] Bureau of Labor Statistics, “Consumer Expenditures in 2014,” Department of Labor, October 2016, https://www.bls.gov/opub/reports/consumer-expenditures/2014/home.htm.
[6] Alisha Coleman-Jensen et al., “Household Food Security in the United States in 2015,” Economic Research Service, USDA, September 2016, https://www.ers.usda.gov/publications/pub-details/?pubid=79760. Seniors are defined in this report as individuals aged 65 years and older.
[7] Alisha Coleman-Jensen et al., “Statistical Supplement to Household Food Security in the United States in 2015,” Economic Research Service, USDA, September 2016, https://www.ers.usda.gov/publications/pub-details/?pubid=79430. Seniors are defined in this report as individuals aged 65 years and older.
[8] National Foundation to End Senior Hunger (2014), “Spotlight on Senior Health: Adverse Health Outcomes of Food Insecure Older Americans,” March 2014, http://www.nfesh.org/wp-content/uploads/2013/03/SeniorLiteratureReport-Final-Draft.pdf.
[9] Census Bureau, 2008 and 2016 Current Population Survey’s Annual Social and Economic Supplements.
[10] Census Bureau, 2008 and 2016 Current Population Survey’s Annual Social and Economic Supplements.
[11] Census Bureau, 2014 National Population Projections.
[12] Kelsey Farson Gray and Karen Cunnyngham, “Trends in Supplemental Nutrition Assistance Program Participation Rates: Fiscal Year 2010 to Fiscal Year 2014,” Department of Agriculture, Office of Policy Support, June 2016, https://www.fns.usda.gov/snap/trends-supplemental-nutrition-assistance-program-participation-rates-fiscal-year-2010-fiscal-year.
[13] James Ziliak and Craig Gundersen, “Food Insecurity Among Older Adults,” AARP Foundation, August 2011, http://www.aarp.org/content/dam/aarp/aarp_foundation/pdf_2011/AARPFoundation_HungerReport_2011.pdf.
[14] Census Bureau, 2011-2015 American Community Survey 5-Year Estimates.
[15] Ibid.