MÁS ALLÁ DE LOS NÚMEROS
Official Poverty Measure and Anchored Supplemental Poverty Measure Show Poverty Rate Declined in 2025
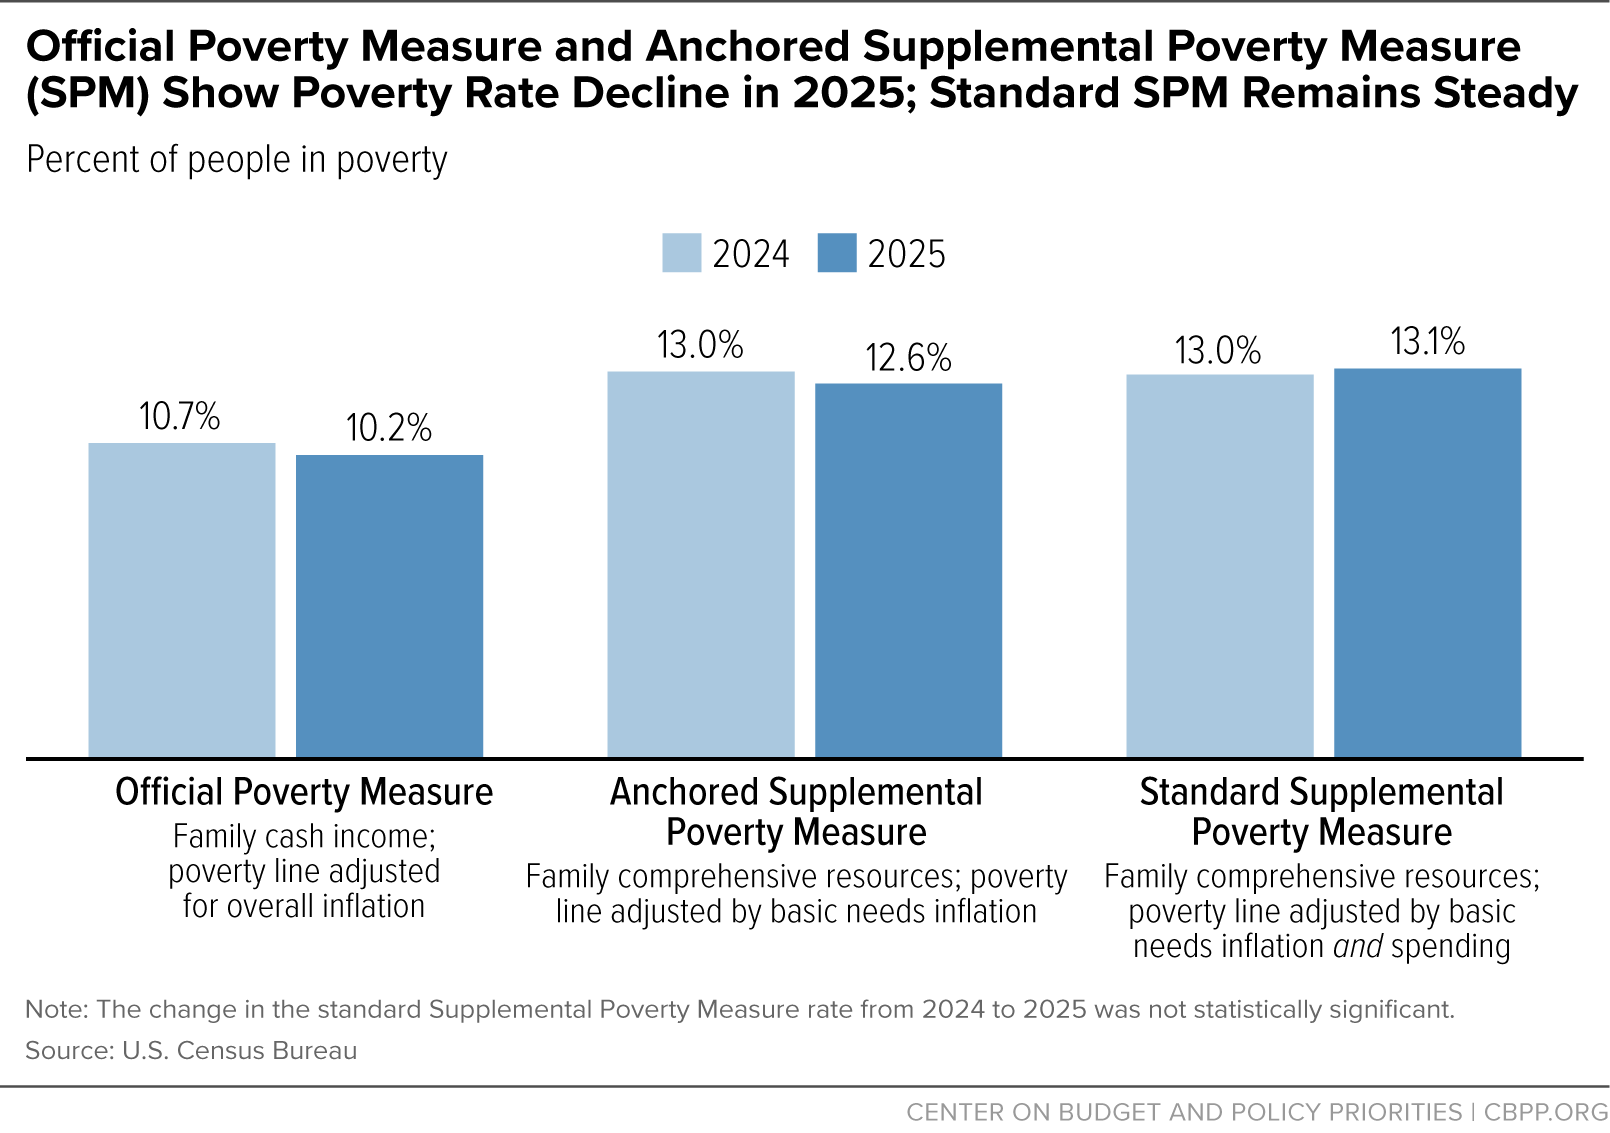
Census figures released yesterday show that the national poverty rate fell in 2025 both when using the official poverty measure and under an alternate Supplemental Poverty Measure (SPM), referred to as an “anchored” SPM, that uses thresholds that are adjusted year-to-year simply for inflation. Poverty held steady in 2025 under the standard SPM that adjusts thresholds not only for inflation but also for changes in families’ inflation-adjusted spending on basic needs. Weighing all the data suggests the financial picture for families with lower incomes likely improved in 2025.
By Census’ official poverty measure (OPM), the poverty rate fell to 10.2 percent in 2025, from 10.7 percent in 2024. The OPM captures the effect of changes in earnings and other cash income, such as Social Security. It chiefly provides a picture of the effect of the private economy on families with low incomes.
By Census’ standard SPM, poverty remained statistically unchanged at 13.1 percent in 2025 (it was 13.0 percent in 2024). The SPM generally provides a fuller picture of families’ needs and resources than the OPM. In addition to reflecting the economy, the SPM reflects the effect of taxes and non-cash benefits like food assistance and rent subsidies. It also captures the impact of work and medical expenses on poverty, the rising cost of basic needs, and other factors.
By Census’ anchored SPM, the poverty rate fell to 12.6 percent in 2025, from 13.0 percent in 2024. This version of the SPM updated the SPM threshold only for changes in basic needs spending in 2025.
The main reason that the standard SPM poverty rate remained flat in 2025 was that standard SPM poverty thresholds rose substantially. Unlike the OPM thresholds — which Census updates each year for overall price inflation — the Bureau of Labor Statistics updates the SPM poverty thresholds using a formula that, in effect, reflects two different things. The first is the rising prices of selected basic needs (such as food, clothing, shelter, and utilities) in the current year (2025). The second is a longer-term rise in families’ inflation-adjusted spending on these basic needs, which is based on five years of expenditure data lagged by a year. (The 2025 threshold adjustment used spending data from 2019 to 2024.)
In most years, this lagged spending adjustment is small; it is meant to capture the gradual evolution in societal spending patterns over the decades and keeps the SPM relevant to current standards. But in 2025 (similar to 2024), the lagged spending factor made a notable difference, adding a sizeable 0.5 percentage points to the poverty rate. It is not clear why prior-year spending patterns had such a sizable effect in 2025. Possibly, it reflects a rise in inflation-adjusted consumer spending during the COVID-19 pandemic. Regardless, a key point is that the 2025 standard SPM was flat in part because of inflation-adjusted spending growth that happened before 2025.
All in all, data from 2025 itself (leaving out pre-2025 spending changes) suggests living conditions improved modestly for those with lower incomes.