After Nearly a Decade, School Investments Still Way Down in Some States
A more recent version of this report is available here.
Public investment in K-12 schools — crucial for communities to thrive and the U.S. economy to offer broad opportunity — has declined dramatically in a number of states over the last decade. Public investment in K-12 schools has declined dramatically in a number of states over the last decade.Worse, most of the deepest-cutting states have also cut income tax rates, weakening their main revenue source for supporting schools.
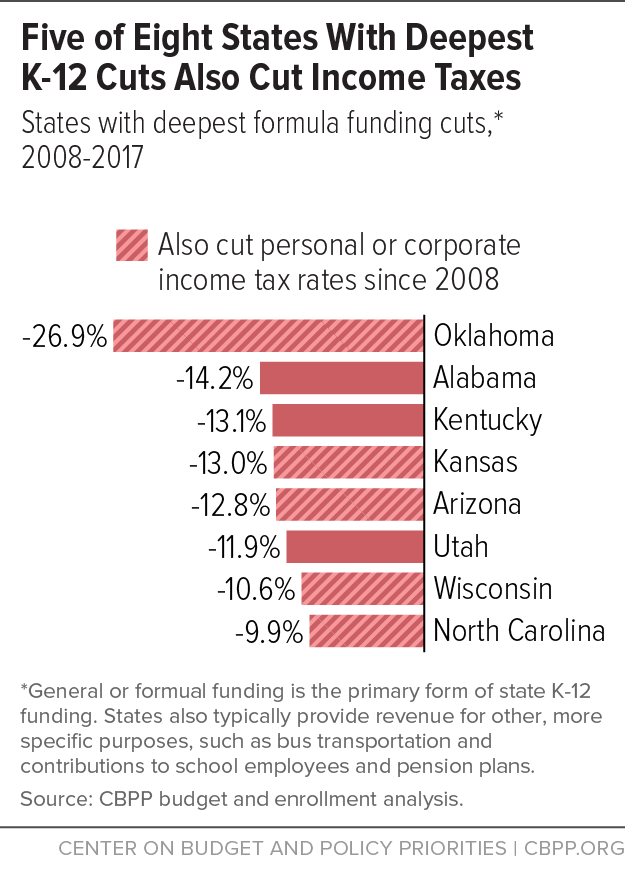
At least 23 states will provide less “general” or “formula” funding — the primary form of state support for elementary and secondary schools — in the current school year (2017) than when the Great Recession took hold in 2008, our survey of state budget documents finds. Eight states have cut general funding per student by about 10 percent or more over this period. Five of those eight — Arizona, Kansas, North Carolina, Oklahoma, and Wisconsin — enacted income tax rate cuts costing tens or hundreds of millions of dollars each year rather than restore education funding.
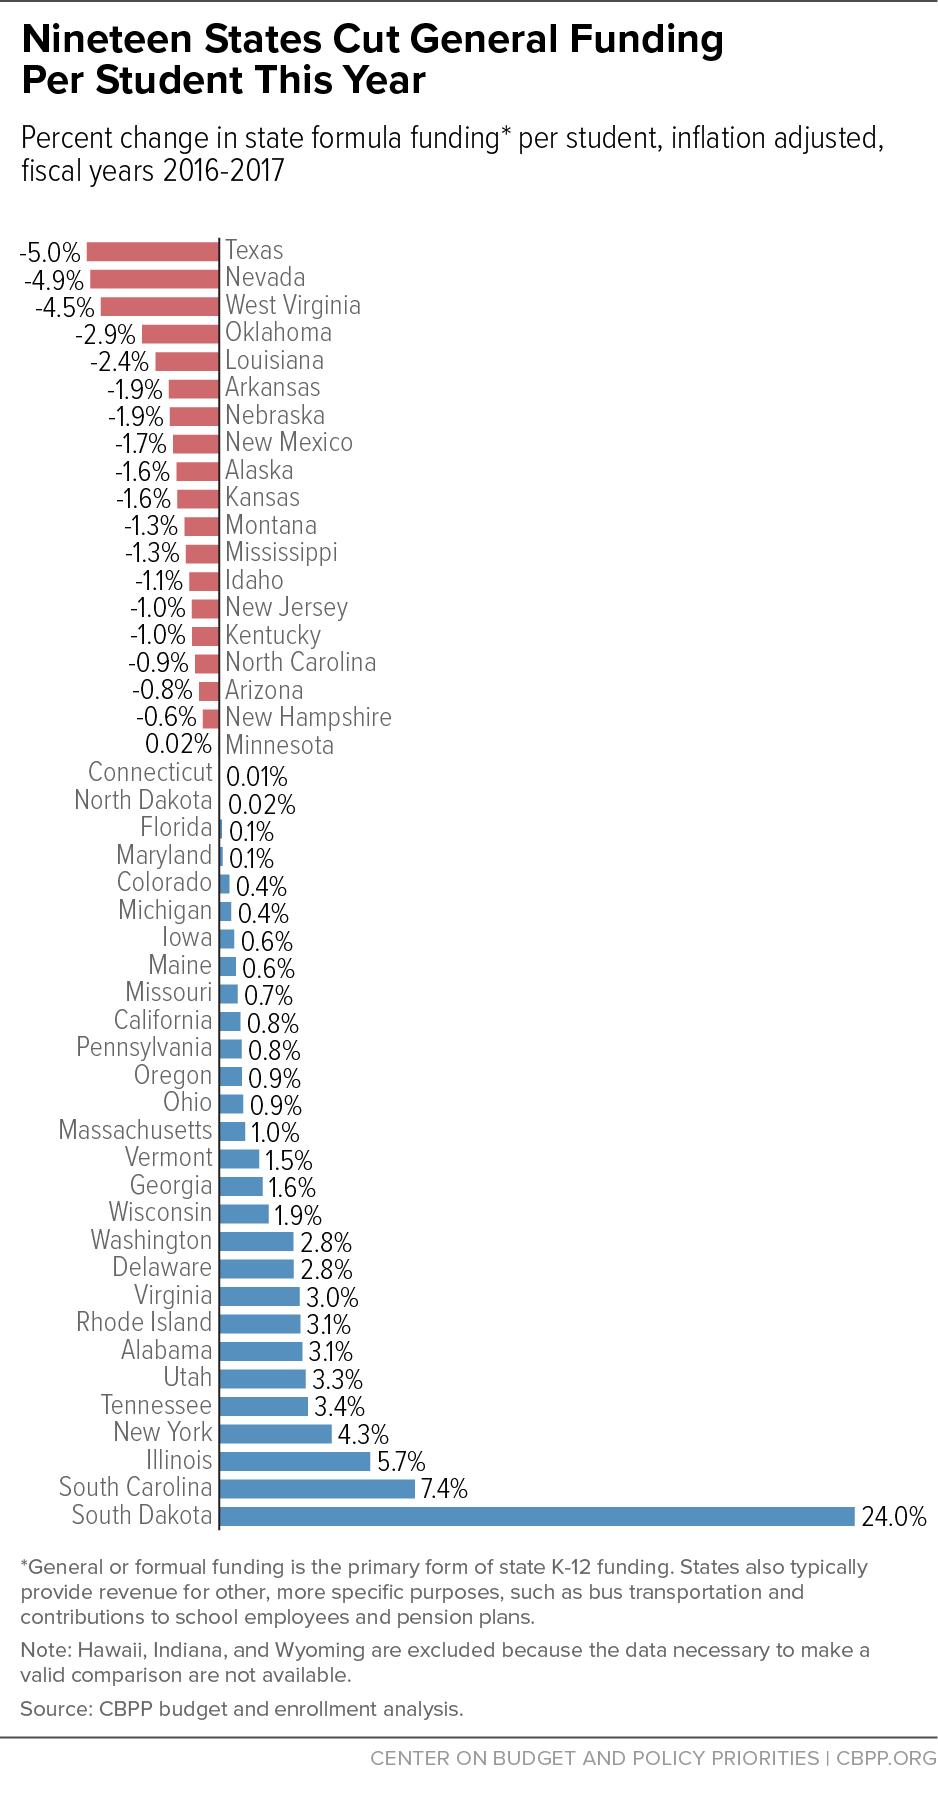
Most states raised general funding per student this year, but 19 states imposed new cuts, even as the national economy continues to improve. Some of these states, including Oklahoma, Kansas, and North Carolina, already were among the deepest-cutting states since the recession hit.
Our country’s future depends heavily on the quality of its schools. Increasing financial support can help K-12 schools implement proven reforms such as hiring and retaining excellent teachers, reducing class sizes, and expanding the availability of high-quality early education. So it’s problematic that so many states have headed in the opposite direction over the last decade. These cuts risk undermining schools’ capacity to develop the intelligence and creativity of the next generation of workers and entrepreneurs.
Our survey, the most up-to-date data available on state and local funding for schools, also indicates that, after adjusting for inflation:
- Thirty-five states provided less overall state funding per student in the 2014 school year (the most recent year available) than in the 2008 school year, before the recession took hold.
- In 27 states, local government funding per student fell over the same period, adding to the damage from state funding cuts. In states where local funding rose, those increases rarely made up for cuts in state support.
As common sense suggests — and academic research confirms — money matters for educational outcomes. For instance, poor children who attend better-funded schools are more likely to complete high school and have higher earnings and lower poverty rates in adulthood.[1]
States cut K-12 funding — and a range of other areas, including higher education, health care, and human services — as a result of the 2007-09 recession, which sharply reduced state revenue. Emergency fiscal aid from the federal government prevented even deeper cuts but ran out before the economy recovered, and states chose to address their budget shortfalls disproportionately through spending cuts rather than a more balanced mix of service cuts and revenue increases. Some states have worsened their revenue shortfalls by cutting taxes.
Restoring school funding should be an urgent priority. Steep state-level K-12 spending cuts have serious consequences.
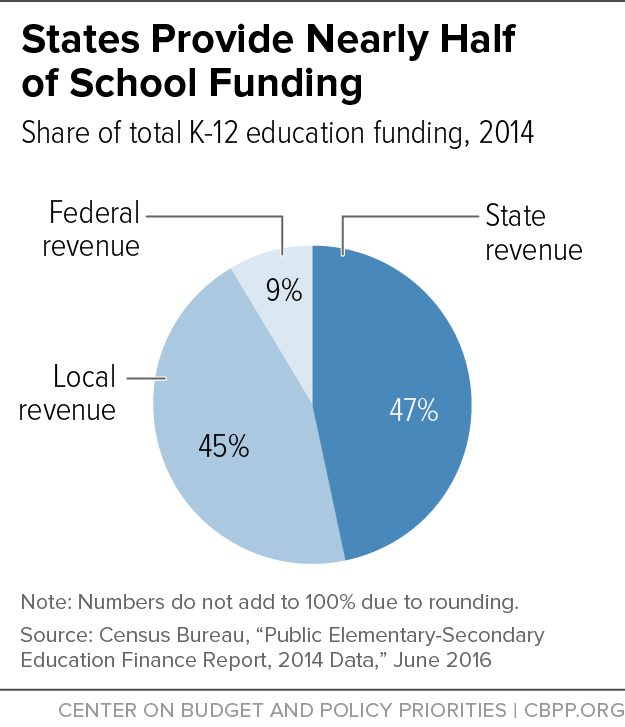
- Weakening a key funding source for school districts. Some 47 percent of K-12 spending nationally comes from state funds (the share varies by state).[2] Cuts at the state level force local school districts to scale back educational services, raise more local revenue to cover the gap, or both. And because property values fell sharply after the recession hit, it’s been particularly difficult for local school districts to raise significant additional revenue through local property taxes without raising tax rates, a politically challenging task even in good times. (See Figure 1.)
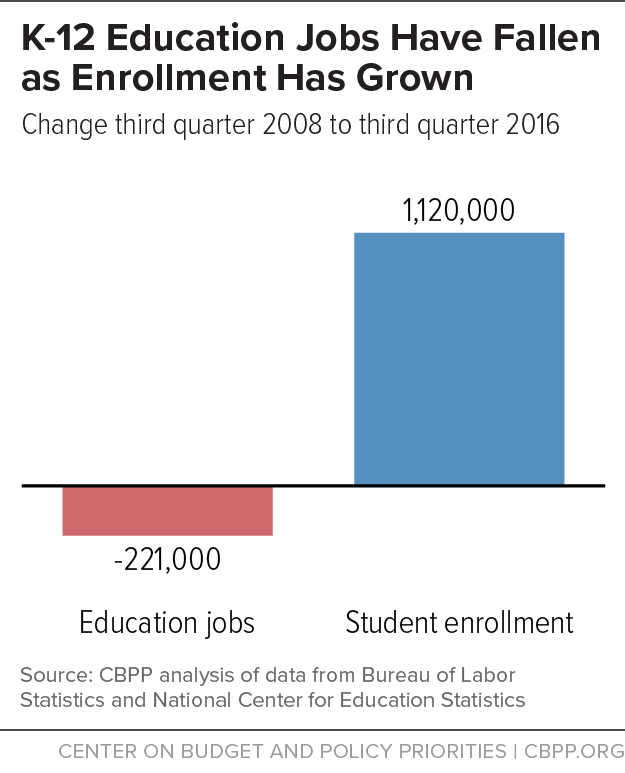
- Slowing the economy’s recovery from the recession. School districts began cutting teachers and other employees in mid-2008 when the first round of budget cuts took effect, federal employment data show. By mid-2012, local school districts had cut 351,000 jobs. Since then they’ve restored some of the jobs but still are down 221,000 jobs compared with 2008.[3] These job losses reduced the purchasing power of workers’ families, weakening overall economic consumption and thus slowing the recovery.
- Impeding reforms widely acknowledged to boost student achievement. Many states and school districts have identified as a priority reforms to prepare children better for the future, such as improving teacher quality, reducing class sizes, and increasing student learning time. Deep funding cuts hamper their ability to implement many of these reforms. For example, while the number of public K-12 teachers and other school workers has fallen by 221,000 since 2008, the number of students has risen by 1,120,000. At a time when producing workers with high-level technical and analytical skills is increasingly important to a country’s prosperity, large cuts in funding for basic education could cause lasting harm.
These trends are very concerning to the country’s future prospects. The health of the nation’s economy and our quality of life will depend crucially on the creativity and intellectual capacity of our people. If we neglect our schools, we diminish our future.
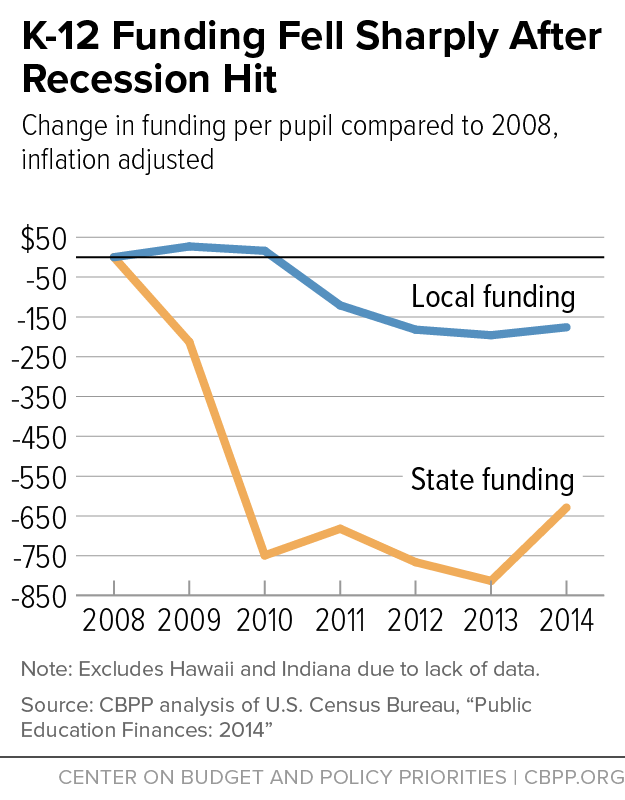
State Funding Fell Sharply, and Local Funding Didn’t Make Up the Difference
K-12 schools in every state rely heavily on state aid. On average, 47 percent of school revenues in the United States come from state funds. Local governments provide another 45 percent; the rest comes from the federal government. (See Figure 2.)
States typically distribute most of their funding through a formula that allocates money to school districts. Each state uses its own formula. Many states, for instance, target at least some funds to districts with greater student need (e.g., more students from low-income families) and less ability to raise funds from property taxes and other local revenues. However, typically this targeting doesn’t fully equalize educational spending across wealthy and poor school districts.[4]
In addition to this “general” or “formula” funding, states typically provide revenue for other, more specific purposes, such as bus transportation, contributions to school employee pension plans, and teacher training. States vary in what they include in their general funding formula and what they fund outside the formula.
Because schools rely so heavily on state aid, cuts to state funding (especially formula funding) generally force local school districts to scale back educational services, raise more revenue to cover the gap, or both.
When the Great Recession hit, however, property values fell sharply, making it hard for school districts to raise local property taxes — schools’ primary local funding source — without raising rates, which is politically challenging even in good times. Raising rates was particularly difficult in the midst of a severe recession with steep declines in housing values in many areas.
As a result, local funding for schools fell after the recession took hold, worsening the even steeper fall in state funding. Local funding still hadn’t recovered in 2014, leaving total state and local K-12 funding per student still well below pre-recession levels as of the 2014 school year — the latest year for which these data are available in most states. This survey (with data from 48 states[5]) finds that, after adjusting for inflation:
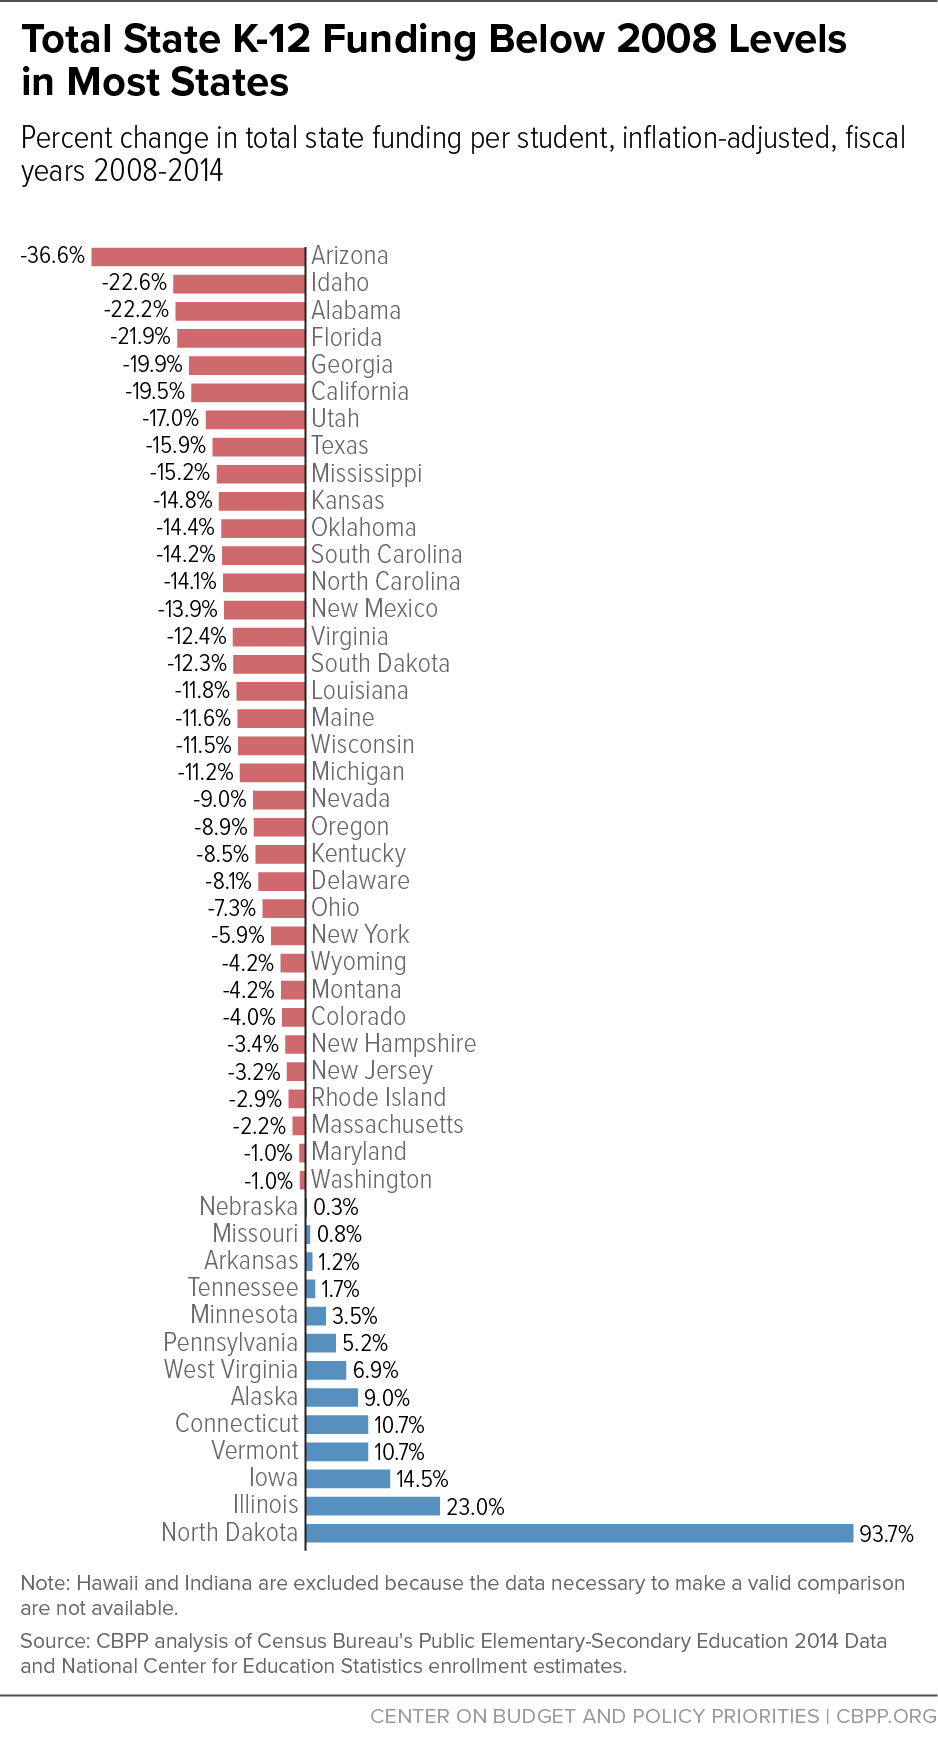
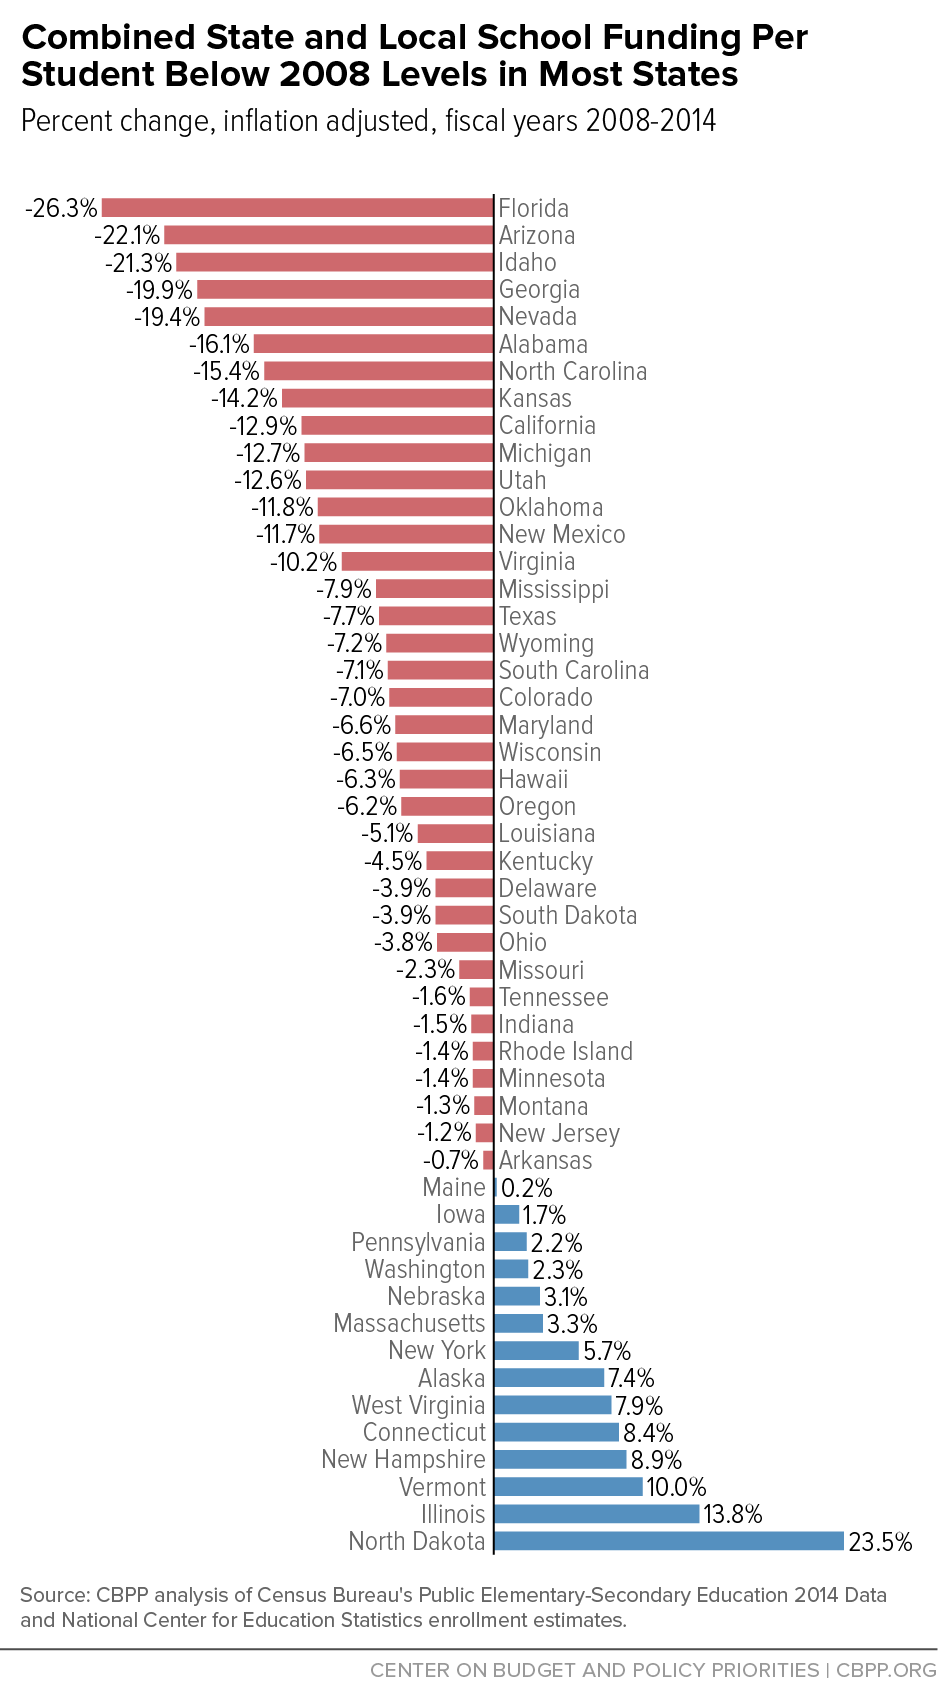
- In 35 states, total state funding per student was lower in the 2014 school year than in the 2008 school year, before the recession took hold. (See Figure 3.)
- In 20 states, the cut exceeded 10 percent.
- In 27 states, local funding per student fell over the same period. In the other 21 states for which we have data, local funding rose, but those increases rarely made up for cuts in state support.
- In 36 states, total state and local funding combined fell between the 2008 and 2014 school years. (See Figure 10 in the appendix for state-by-state figures.)
Current-Year Data Show General Formula Funding Still Down in Many States
Data on total state and local school funding aren’t yet available for the current (2017) school year in most states. However, in 47 states the necessary data are available to compare general formula funding ― the primary state funding source for schools ― this year with funding before the recession took hold.[6]
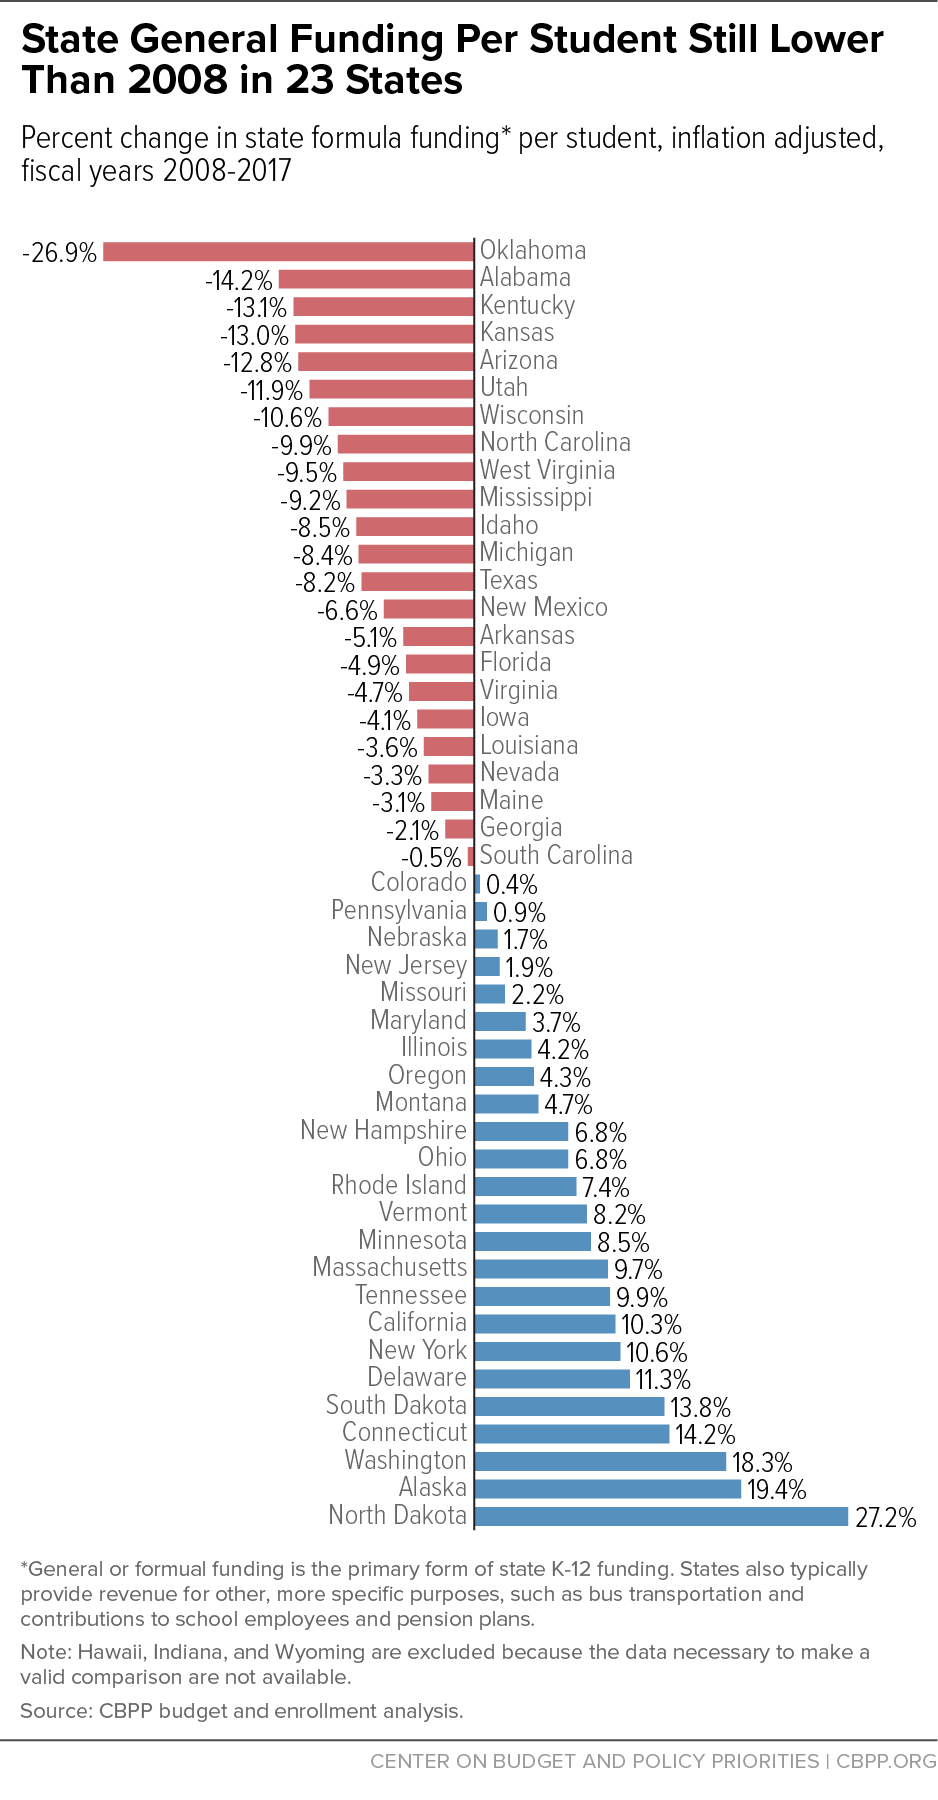
States made widespread and deep cuts to education formula funding when the recession hit, and close to half of the states still haven’t fully restored the cuts nearly nine years later. (See Figure 4.) This survey finds that, after adjusting for inflation:
- Twenty-three of the 47 states are providing less general aid per student this year than in 2008.
- In seven of those 23 states, the cuts are 10 percent or more, and North Carolina’s cut is only slightly smaller, at 9.9 percent.
Most states raised per-pupil general formula funding in the last year (see Figure 5), but in most cases those increases weren’t enough to offset earlier cuts.
- Twenty-eight states raised general funding per student in 2016, after adjusting for inflation.
- In at least 16 of those 28 states, per-student funding was above pre-recession levels even before this year’s increase. But among the other 12 states, only two ― Illinois and South Dakota ― raised funding enough in the last year to make up for cuts in earlier years. For example, Alabama’s $168 per-pupil increase this year was far from enough to offset the state’s $1,082 per-pupil cut over the previous eight years.
-
At least 19 states cut per-student funding this year. In 12 of these states, the cuts came on top of previous cuts, leaving the state even further below pre-recession levels.
Figure 4 - Seven of the ten states with the deepest cuts in general per-student funding since 2008 imposed further cuts this year: Arizona, Kansas, Kentucky, Mississippi, North Carolina, Oklahoma, and West Virginia.
Why Have States Cut Funding So Deeply?
States’ large K-12 cuts reflect a combination of outside factors, such as weak revenues and rising costs, and state policy choices, such as relying on spending cuts to close budget shortfalls and enacting recent tax cuts.
-
State revenues have been slow to recover. The recession caused the national unemployment rate to double between 2007 and 2010 and the economy’s recovery since then has been slow. Median household income fell by 3.8 percent ― or $2,228 ― between 2007 and 2015, adjusted for inflation. Plus, housing values plummeted and remain below their pre-recession peak in some parts of the country, leaving many homeowners more cautious about drawing on home equity to make large purchases. As a result, states’ income and sales tax revenues ― their main sources of revenue to fund education and other services ― were hit hard. State revenues have improved lately but not enough to keep pace with state needs; they are only about 6.6 percent above pre-recession levels, after adjusting for inflation.
-
States relied heavily on spending cuts after the recession hit. States disproportionately relied on spending cuts to close their large budget shortfalls after the recession hit, rather than a more balanced mix of spending cuts and revenue increases. Between fiscal years 2008 and 2012, states closed 45 percent of their budget gaps through spending cuts and only 16 percent through taxes and fees. (They closed the rest with federal aid, reserves, and various other measures.)[7]
-
Federal aid to states has fallen. States used emergency fiscal relief from the federal government (including both education aid and other forms of state fiscal relief) to cover a significant share of their shortfalls through the 2011 fiscal year. After 2011, federal policymakers largely allowed this aid to expire, even though states faced large shortfalls in 2012 and beyond.
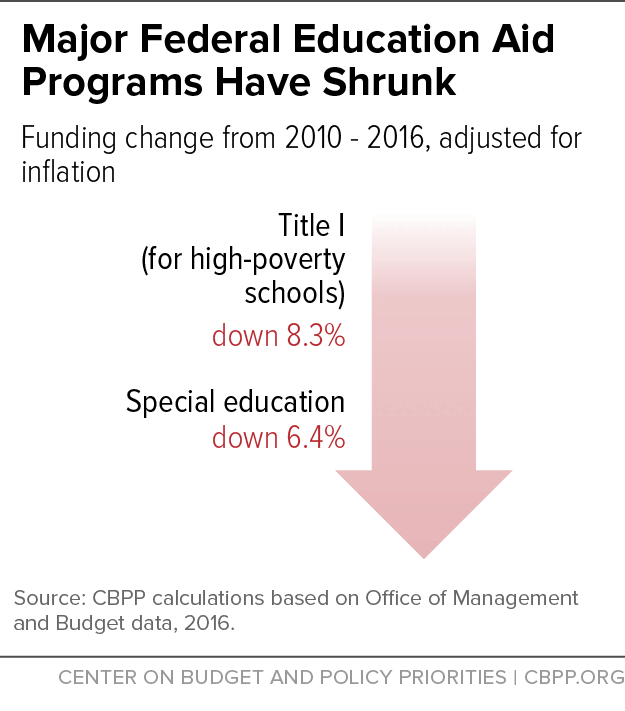
Figure 5 Figure 6 Adding to states’ struggles, federal policymakers have cut ongoing federal funding for states and localities, thereby worsening state fiscal conditions. For example, federal spending for Title I — the major federal assistance program for high-poverty schools — is down 8.3 percent since 2010, after adjusting for inflation. Federal spending on education for disabled students is down 6.4 percent.[8] (See Figure 6.)
-
Costs are rising. Costs of state-funded services have risen since the recession due to inflation, demographic changes, and rising needs. For example, there are about 1.1 million more K-12 students and 1.5 million more public college and university students now than in 2008, the U.S. Department of Education estimates.[9]
-
Some states have cut taxes deeply. Not only did many states avoid raising new revenue after the recession hit, but some enacted large tax cuts, further reducing revenues. Five of the eight states with the biggest cuts in general school funding since 2008 ― Arizona, Kansas, North Carolina, Oklahoma, and Wisconsin ― have also cut income tax rates in recent years. (See Figure 7.)
K-12 Cuts Have Serious Consequences
Local school districts typically struggle to make up for major state funding cuts on their own, so the cuts have led to job losses, deepening the recession and slowing the economy’s recovery. They also impede important state education reform initiatives at a time when producing workers with high-level technical and analytical skills is increasingly important to the country’s prosperity.
A recent study on the impact of school financing reforms beginning in the 1970s highlighted the importance of adequate funding for children’s — especially low-income children’s — success in school and later in the workplace. Examining data on more than 15,000 children born between 1955 and 1985, it found that poor children whose schools were estimated to receive a 10 percent increase in per-pupil spending (adjusted for inflation) before they began public school, and to maintain that increase over their 12 years of school, were 10 percentage points more likely to complete high school than other poor children. They also had 10 percent higher earnings as adults and were 6 percentage points less likely as adults to be poor.[10]
Local School Districts Hard Pressed to Replace Lost State Funding
Property values fell sharply after the recession hit, making it difficult for local school districts to raise significant additional revenue through the property tax to make up for state funding cuts. Property values have since improved, but most states’ property tax revenues don’t yet fully reflect the increase. (There’s generally a significant time lag between when home prices rise and when property tax assessments register the increase.)[11] Local school districts can seek to raise property tax rates, but those increases are usually politically difficult and sometimes legally restricted.
For these reasons, property tax revenue growth nationwide has been modest since the recession hit. While revenue initially surged as property taxes caught up with the rapid growth in home prices associated with the pre-recession housing bubble, they fell sharply once home prices plummeted, and since then have risen only slowly. The overall result: since the recession hit at the end of 2007, revenue growth nationally has averaged only about 1.6 percent above inflation annually ― far from enough to make up for declining state support and rising student enrollment.[12]
Beyond raising local revenues, school districts have few options for preserving investments in education. Some localities could divert funds from other services to shore up school budgets, but this could impair other critical services, like police and fire protection.
Capital Spending to Build and Renovate Schools Also Down
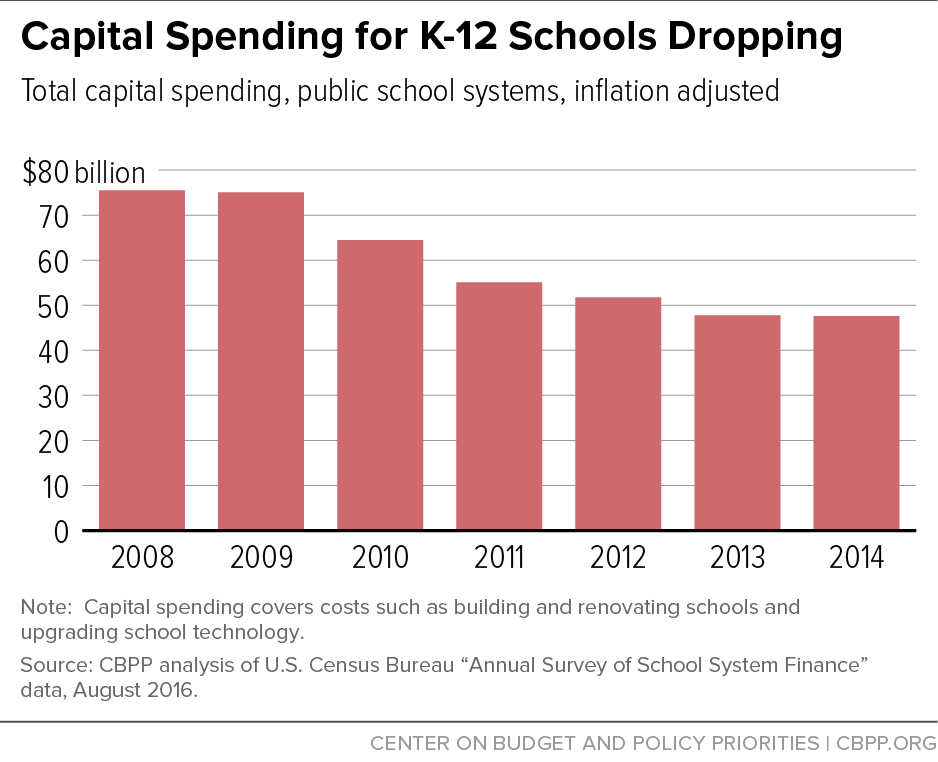
States and localities use capital spending to build new schools, renovate and expand facilities, and equip schools with more modern technologies. In most states capital spending fell sharply after the recession hit, as did the non-capital school funding discussed in this paper.
Elementary and high schools nationally cut capital spending by $28 billion or 37 percent between fiscal years 2008 and 2014 (the latest year available), after adjusting for inflation. (See Figure 8.)
Forty states cut capital spending over this period, in many cases drastically. Eight states cut capital spending by more than half. Nevada, the state with the sharpest reductions, cut capital spending by 86 percent.
Cuts Undermine Education Reforms
Many states have undertaken education reforms (often with federal encouragement), such as supporting professional development to improve teacher quality, improving interventions for young children to heighten school readiness, and turning around the lowest-achieving schools. Deep cuts in state K-12 spending can undermine those reforms by limiting the funds generally available to improve schools and by terminating or undercutting specific reform initiatives. Reforms endangered by funding cuts include:
- Improving teacher quality. Research suggests that teacher quality is the most important school-based determinant of student success.[13] Recruiting, developing, and retaining high-quality teachers are therefore essential to improving student achievement. School budget cuts make these tasks far more difficult. Teacher salaries make up a large share of public education spending, so funding cuts inevitably restrict districts’ ability to expand teaching staffs and supplement wages. In 39 states, the average teacher’s salary declined relative to inflation between the 2010 and 2014 school years (the latest year with comparable data for all states).[14]
- Trimming class size. Evidence suggests that smaller class sizes can boost achievement, especially in the early grades and for low-income students.[15] Yet small class sizes are difficult to sustain when schools cut spending and enrollment rises. In Nevada, for example, the student-to-teacher ratio rose from 18.3 to 20.6 between the 2008 and 2014 school years.[16] The United States as a whole has about 1,120,000 more K-12 students this school year than in 2008 but 221,000 fewer teachers and other school workers.[17]
- Expanding learning time. Many experts believe that more student learning time can improve achievement.[18] Budget cuts make it more difficult to extend instructional opportunities because extending learning time generally adds costs. Some states have even cut student learning time due to budget cuts. When Arizona eliminated funding for full-day kindergarten, for example, some school districts responded by offering only a half-day program or by requiring parents to pay a fee for a full-day program, likely reducing the number of children who can attend.[19]
- Providing high-quality early education. A number of studies conclude that pre-kindergarten or preschool programs can improve cognitive skills, especially for disadvantaged children,[20] but many states cut funding for those programs after the recession hit. In the average state, preschool funding per enrolled child fell by 5 percent between 2008 and 2015, after adjusting for inflation.[21]
Cuts Have Slowed the Economy and Can Inhibit Long-Term Growth
State K-12 cuts have slowed the economic recovery by reducing overall economic activity since the recession officially ended in mid-2009. They forced school districts to lay off teachers and other employees, reduce pay for the remaining workers, and cancel contracts with suppliers and other businesses. These steps remove consumer demand from the economy, which in turn discourages businesses from making new investments and hiring.
Federal employment data show that school districts began cutting teachers and other employees in mid-2008, when the first round of budget cuts began taking effect. By 2012, local school districts had cut about 351,000 jobs. They’ve since added back some of the jobs but still are down 221,000 jobs compared with 2008.[22] (See Figure 9.)
In addition, education spending cuts have cost an unknown but likely significant number of private-sector jobs as school districts canceled or scaled back purchases and contracts (for instance, buying fewer textbooks). These job losses shrink the purchasing power of workers’ families, which in turn affects local businesses and slows recovery.
In the long term, the budgetary savings from recent K-12 funding cuts may cost states much more in diminished economic growth. To prosper, businesses require a well-educated workforce. Deep education funding cuts weaken that future workforce by diminishing the quality of elementary and high schools. At a time when the nation is trying to produce workers with the skills to master new technologies and adapt to the complexities of a global economy, large cuts in funding for basic education undermine a crucial building block for future prosperity.
Appendix: Total State and Local Funding
Appendix: Methodology
The data on state and local K-12 funding in this paper come from a review of state budget documents CBPP conducted in the summer of 2016. An education funding expert in each state, often a budget expert with the state’s education department, reviewed our figures and edited them when necessary.
The figures on total state and total local education funding reflect all state and local revenues dedicated to K-12 education, as reported by the U.S. Census Bureau. The enrollment figures used to analyze total state and total local education funding were taken from the National Center for Education Statistics. Additional adjustments were made to reflect the following state-specific policies or data limitations:
- In Illinois, payments made by the state government into the state’s public school retirement systems on behalf of Illinois school districts are included in state total funding.
- In 2013, the Census Bureau began treating revenue from Wisconsin’s School Levy Tax Credit property tax relief program as revenue from state sources rather than as local property taxes. To create an apples-to-apples comparison across years, we included the School Levy Tax Credit as a state revenue source in years prior to fiscal year 2013.
When possible, the enrollment figures used to calculate general formula funding were collected directly from state agencies. The general education funding totals reflect the funding distributed through states’ major education funding formulas. The figures do not include local property tax revenue or any other source of local funding. Figures for the current fiscal year are based on the amounts states budgeted for the 2016-17 fiscal year when they wrote their budgets earlier this year. Additional adjustments were made to reflect the following state-specific policies or data limitations:
- Arizona voters approved a plan to settle a lawsuit regarding inflation adjustments for K-12 education in May 2016. The plan increased the distribution of state land trust funds over a ten-year period beginning with fiscal year 2016. The result is an increase of approximately $173 million per year through fiscal year 2025. These appropriations are included in Arizona’s funding analysis.
- California’s numbers reflect General Fund Proposition 98 spending for K-12 education. California removed adult education funding from Proposition 98 K-12 spending starting in fiscal year 2016. To make an apples-to-apples comparison, we adjusted our figures for years prior to 2016 by removing in each of those years the estimated amount of adult education funding that was including in General Fund Proposition 98 spending.
- In Idaho, funds for Idaho Educational Services for the Deaf and Blind were removed from recent appropriations to make general formula education allocations comparable across years.
- Iowa’s figures do not include categorical supplemental aid for purposes such as teacher salaries, professional development, early intervention, teacher quality, and teacher training.
- In Kansas, a block grant replaced the previous K-12 funding formula starting in fiscal year 2015. For this reason, certain K-12 funding categories were excluded to ensure a valid comparison across years.
- Maryland’s numbers include funding for the state’s foundation program as well as funding for compensatory education, aid for local employee fringe benefits, formula programs for specific populations, and limited English proficiency programs.
- New York’s numbers reflect school districts’ fiscal years (which end June 30), rather than the state’s fiscal year (which ends March 31).
- North Carolina’s numbers do not include funding for one-time bonuses and increases for salaries and benefits for education personnel in order to accurately compare past and current education spending.
- Ohio’s numbers include school district property tax replacement funds and revenues from the lottery profits education fund.
- Cuts made to the Oklahoma Department of Education were greater than necessary to cover the fiscal year 2016 shortfall. To correct for this, the legislature returned roughly $25.5 million to the Oklahoma Department of Education for the financial support of public schools for that year. That adjustment is included in this report’s analysis for fiscal year 2016.
- Pennsylvania began using a formula to distribute classroom funding in fiscal year 2015. In order to construct a consistent time series, classroom funding is defined as including the following line items: basic education funding, school improvement grants, education assistance program, reimbursement of charter schools, the Pennsylvania accountability block grant, and the Ready to Learn grant.
- South Carolina’s numbers include employer contributions to the Education Finance Act.
- In Vermont, school property taxes are state taxes and are deposited into a state Education Fund, which covers the cost of public education (pre-K through grade 12). The state’s “general formula funding” represents the amount contributed to the Education Fund each year from a state General Fund appropriation and General Fund revenues dedicated to the Education Fund; it does not include any state property tax revenue. Because school property taxes are state taxes in Vermont, the state’s share of total education funding is proportionally greater than in most other states.
Finally, we were unable to find the necessary data on general education funding for some states:
- Hawaii, and Indiana are excluded because the necessary data to make a valid comparison are not available.
- In Wyoming, data for fiscal year 2017 were not available when we completed our analysis in the late summer of 2016.
End Notes
[1] C. Kirabo Jackson, Rucker C. Johnson, and Claudia Persico, “The Effects of School Spending on Educational and Economic Outcomes: Evidence from School Finance Reforms,” Quarterly Journal of Economics, October 1, 2015. See also Bruce Baker, “Does Money Matter in Education?” second edition, Albert Shanker Institute, 2016, http://www.shankerinstitute.org/resource/does-money-matter-second-edition.
[2] U.S. Census Bureau, Public Elementary-Secondary Education Finance Data.
[3] CBPP analysis of Bureau of Labor Statistics data.
[4] See Bruce Baker, David Sciarra, and Danielle Farrie, “Is School Funding Fair? A National Report Card,” fifth edition, Education Law Center, March 2016, http://www.schoolfundingfairness.org; Richard Coley and Bruce Baker, “Poverty and Education: Finding the Way Forward,” ETS Center for Research on Human Capital and Education, July 2013, pp. 36-37, http://www.ets.org/s/research/pdf/poverty_and_education_report.pdf.
[5] Hawaii and Indiana are excluded. Hawaii does not distinguish between state and local funding, as it contains just one school district. Indiana shifted a large share of school funding in 2009 from local governments to the state; that shift is the primary reason why it’s not possible to accurately compare state funding in 2008 to funding in recent years.
[6] Hawaii and Wyoming were omitted due to insufficient data. Indiana was excluded because changes in its education formulas between fiscal years 2008 and 2016 prevent meaningful comparisons across years.
[7] CBPP calculations based on our survey of state budget documents, in-state experts, and other materials. See Elizabeth McNichol, “Out of Balance: Cuts in Services Have Been States’ Primary Response to Budget Gaps, Harming the Nation’s Economy,” Center on Budget and Policy Priorities, April 18, 2012, https://www.cbpp.org/research/out-of-balance.
[8] CBPP analysis of data from the Office of Management and Budget. These cuts include the automatic, across-the-board cuts known as sequestration, as well as other cuts also resulting from the 2011 Budget Control Act.
[9] National Center for Education Statistics, Table 6; and Digest of Education Statistics: 2015, Tables 203.20 and 303.10.
[10] Jackson, Johnson, and Persico.
[11] Recent research suggests it generally takes about three years for property tax revenues to reflect increased property values. See Byron F. Lutz, “The Connection Between House Price Appreciation and Property Tax Revenues,” Federal Reserve Board of Governors, September 12, 2008, http://www.federalreserve.gov/pubs/feds/2008/200848/200848pap.pdf.
[12] CBPP analysis of data from the U.S. Census Bureau’s Quarterly Summary of State and Local Taxes, extracted on August 15, 2016.
[13] See for example, “Empowering Effective Teachers: Readiness for Reform,” Bill and Melinda Gates Foundation Research Brief, February 2010, http://www.gatesfoundation.org/united-states/Documents/empowering-effective-teachers-readiness-for-reform.pdf.
[14] National Center for Education Statistics data.
[15] See Diane Whitmore Schanzenbach, “Does Class Size Matter?” National Education Policy Center, February 2014, http://nepc.colorado.edu/publication/does-class-size-matter. See also Matthew M. Chingos and Grover J. “Russ” Whitehurst, “What Research Says and What it Means for State Policy,” Brookings Institution, May 11, 2011, http://www.brookings.edu/research/papers/2011/05/11-class-size-whitehurst-chingos.
[16] National Center for Education Statistics data.
[17] National Center for Education Statistics and Bureau of Labor Statistics data.
[18] See for example, Center for American Progress, “Expanded Learning Time By the Numbers,” April 22, 2010, http://cdn.americanprogress.org/wp-content/uploads/issues/2010/04/pdf/elt_by_the_numbers.pdf.
[19] See for example, Paul Rhoden, “Local School Districts Return to Fee-Based, All-Day Kindergarten,” The Daily Courier, April 3, 2010, http://www.dcourier.com/news/2010/apr/03/local-school-districts-return-to-fee-based-all-da/.
[20] Julia Isaacs, “Research Brief #1: State Pre-Kindergarten,” Brookings Institution, September 2008, https://www.brookings.edu/wp-content/uploads/2016/07/09_early_programs_brief1.pdf.
[21] W. S. Barnett et al., “The state of preschool 2015: State preschool yearbook,” National Institute for Early Education Research, 2016, p. 6.
[22] Bureau of Labor Statistics data.