Block-Granting Low-Income Programs Leads to Large Funding Declines Over Time, History Shows
Funding for housing, health, and social services block grants has fallen significantly over time, an examination of several decades of budget data demonstrates. This is a red flag, since Congress may soon consider proposals to convert more programs into block grants. This includes programs that serve families and individuals who are low income or otherwise vulnerable, such as Medicaid, which President Trump and some Republicans in Congress have called for block-granting.
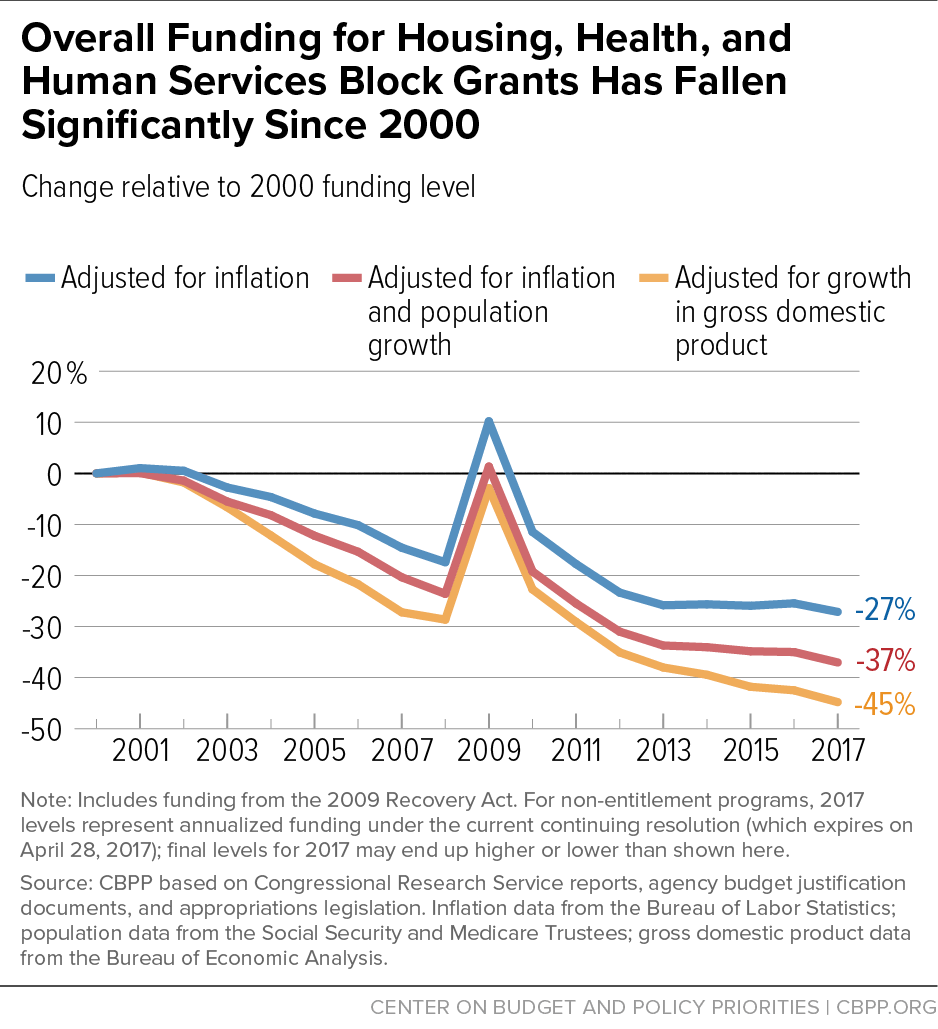
Since 2000, funding for the 13 major housing, health, and social services block grant programs in the federal budget has fallen by 27%.Since 2000, overall funding for the 13 major housing, health, and social services block grant programs in the federal budget has fallen by 27 percent after adjusting for inflation, and by 37 percent after adjusting for inflation and population growth (see Figure 1). Measuring from the year in which each block grant was established in its current form, ten of the 13 block grants have shrunk in inflation-adjusted terms — four of them by more than half. All but one of these block grants have shrunk after adjusting for both inflation and population growth. The largest block grant program examined here, Temporary Assistance for Needy Families (TANF), has lost a third of its value due to inflation, and the amount of basic assistance it provides has fallen even more as states have used their added flexibility under the block grant to shift funds to other purposes.
Nonetheless, congressional leaders and the new administration may push for new block grants of unprecedented sweep and scope. Our examination strongly suggests that even if a new block grant’s funding in its initial year is similar to the existing funding for the programs merged into that block grant, the initial level likely won’t be sustained. This decline in funding is intrinsic to the structure of block grants. They are typically designed to give state and local governments very broad flexibility over implementation. This means the funds are used in diffuse ways and their impact is difficult to assess. Lacking compelling evidence of their effectiveness, national policymakers are more likely to cut block grant programs in subsequent years or to allow their levels to erode over time.
An unfortunate irony here is that while policymakers assert state flexibility as a prime reason to block-grant programs, this flexibility can later be used to justify cutting them or eliminating them entirely. In one telling example, in 1982 conservative lawmakers created the Social Services Block Grant to expand states’ administrative and policy flexibility over these services, but now some conservative lawmakers call for ending the program because it gives states too much flexibility, calling it a “no-strings-attached slush fund for states with no accountability.”[1]
Nearly All Block Grant Programs Have Declined Over Time
Table 1 shows changes in appropriations for each of the 13 major housing, health, and social services block-grant programs, both since the block grant’s creation and since 2000. The list of programs examined is derived from a Congressional Research Service compilation of block grant programs.[2] (All dollar figures and percent changes over time in this report are for fiscal years and are adjusted for inflation, unless we specify otherwise. Levels for 2017 represent annualized funding under the temporary continuing appropriations legislation now in effect, and may change before the year ends. See the Technical Note at the end of this report for more on our methodology.)
From 2000 to 2017, combined funding for the 13 block grants fell by 27 percent or $14 billion. (Since 2000, the median, or typical, funding decline for block grants has also been 27 percent.)
Funding for 10 of the 13 programs has also shrunk in inflation-adjusted terms since their inception, in some cases dramatically. For four of the block grants, funding plunged by significantly more than half. For example, funding for the job training block grant, focused on improving employment and earnings prospects, including among people with less formal education, has fallen by 57 percent since its creation in 1984.
Among the 13 programs examined, only the Child Care and Development Fund and the Community Mental Health Services Block Grant have grown since their inception (in 1997 and 1993, respectively) and also since 2000, after adjusting for inflation. And even they have shrunk from their peak levels, achieved in 2002. Since then, funding for these two block grants has fallen by 14 percent and 10 percent, respectively. Another program that does not show a funding decline since inception, the Substance Abuse Prevention and Treatment Block Grant, grew substantially from its beginning in 1993 until 2002, but since then has been cut back to its 1993 level.
These inflation-adjusted figures, moreover, significantly understate the erosion in these programs relative to need. The overall U.S. population has grown by 16 percent since 2000. As a consequence, overall funding for the 13 block grants has fallen by 37 percent since 2000 when both population growth and inflation are taken into account, with all but one of these block grants falling by this measure. Moreover, the number of Americans living in poverty rose over this period, and costs in some areas such as rental housing have risen faster than the general inflation rate. (Table 1 provides program-by-program detail with adjustments for population growth as well as inflation.)
The funding reductions have been even more severe relative to the size of the economy, which has grown considerably since 2000. In 2000, block-grant funding equaled 0.36 percent of the economy. By 2017, this share had dropped to 0.20 percent, a decline of more than two-fifths.
These large funding declines understate the drop in funding for these services in another way as well. The flexibility that states receive under a block-grant structure can enable them to substitute some federal block-grant dollars for state dollars they previously spent in these areas and then use the freed-up state dollars for unrelated purposes or to plug state budget holes, thereby shrinking the total pool of federal plus state resources used for these services. The Government Accountability Office has documented such substitution under the TANF block grant,[3] and this substitution effect can be especially significant for block grants that states can use for a broad array of purposes.
| TABLE 1 | ||||||
|---|---|---|---|---|---|---|
| Funding for Major Block Grants Over Time | ||||||
| Program | Year of inception | Funding in 2017 (in millions of dollars) | % change, adjusted for inflation | % change, adjusted for inflation and population | ||
| Since 2000 | Since inception | Since 2000 | Since inception | |||
| HOME Investment Partnerships Program | 1992 | $948 | -58% | -63% | -64% | -71% |
| Community Development Block Grant | 1982 | 2,994 | -51% | -64% | -57% | -74% |
| Job Training Formula Grants to States (Youth, Adult, and Dislocated Workers) | 1984 | 2,705 | -41% | -57% | -49% | -68% |
| Social Services Block Grant | 1982 | 1,583 | -38% | -73% | -46% | -81% |
| Maternal and Child Health Block Grant | 1982 | 550 | -34% | -29% | -43% | -49% |
| Temporary Assistance for Needy Families (TANF) block grant | 1998 | 16,574 | -30% | -33% | -40% | -44% |
| Native American Housing Block Grant | 1998 | 647 | -27% | -28% | -37% | -39% |
| Substance Abuse Prevention and Treatment Block Grant | 1993 | 1,855 | -19% | 0% | -30% | -19% |
| Preventive Health and Health Services Block Grant | 1982 | 160 | -17% | -21% | -29% | -43% |
| Community Services Block Grant | 1982 | 714 | -5% | -8% | -18% | -34% |
| Community Mental Health Services Block Grant | 1993 | 532 | 4% | 14% | -10% | -8% |
| Child Care and Development Fund | 1997 | 5,673 | 12% | 27% | -3% | 7% |
| Low Income Home Energy Assistance Block Grant | 1982 | 3,384 | 18% | -27% | 2% | -47% |
| Total | $38,317 | -27% | -37% | |||
Declining Funding for TANF and Housing Block Grants Underscores Concerns
The largest block grant discussed here is TANF. Congress replaced Aid to Families with Dependent Children (AFDC) — an entitlement program like Medicaid or SNAP (formerly known as the Food Stamp Program) — with TANF in 1996. TANF’s annual funding has remained essentially unchanged in nominal terms since then. After adjusting for inflation, federal TANF funding has fallen by 33 percent, even as the U.S. population has grown.
Partly for this reason, TANF today provides substantially less protection against poverty than AFDC did. In 1996, for every 100 poor families with children, 68 families received AFDC cash assistance. By 2015, only 23 families with children received TANF cash assistance benefits for every 100 poor families. In 14 states, ten or fewer of every 100 poor families with children received any cash assistance.[4]
This decline reflects not only the erosion of TANF funding but also state actions to shift TANF funds to other purposes. In 2015, states used only 25 percent of federal and state TANF funds for cash assistance to low-income families — down from 70 percent at the program’s onset. Also in 2015, states spent just another quarter of TANF funds for work activities and child care. This means that just half of TANF funding goes to core welfare reform activities of cash aid, work activities, and child care, as states divert TANF funds to an array of other uses.[5]
Block grants for low-income housing programs provide another example. As Table 1 shows, funding for the three housing-related block grants established in recent decades has fallen substantially. Since 2000, funding for the HOME Investment Partnership Program and the Native American Housing Block Grant has fallen by 58 percent and 27 percent, respectively, after adjustment for inflation.
Funding for the Community Development Block Grant (CDBG), which supports housing and other community development purposes, has fallen by 51 percent.
Revenue Sharing Program Started Strong — and Then Was Zeroed Out
This analysis does not include General Revenue Sharing, which was not restricted to housing, health, or social services and does not exist today. In some respects, however, it was the purest block grant ever established. As its name implies, the program shared federal revenue with states and localities, which received the funds in quarterly lump sums with extraordinarily few restrictions on how they could be used. The program started in 1972 with robust funding of $28.1 billion, in 2017 dollars. Congress eliminated the grants to states in 1980 and eliminated the rest of the program in 1986.
Year-by-Year Analysis Shows Falling Funding Since 2000
A year-by-year analysis of funding for these block grants since 2000 shows that overall funding for the 13 health, housing, and social services block grants deteriorated or remained stagnant in virtually every year (see Figure 1).[6] In 2017, combined funding for these block grants reached its lowest level during this period — $14 billion below the 2000 level adjusted for inflation. Adjusted for inflation and population growth, combined block grant funding in 2017 is more than $20 billion below its 2000 level.
Total funding for the block grants rose significantly in just one of the last 15 years: 2009. Some of this increase reflected a boost in the Low Income Home Energy Assistance Program in response to a sharp rise in energy prices in the summer of 2008, but most was due to funding boosts for several block grants in the 2009 Recovery Act, as part of the response to the Great Recession. Policymakers intended the Recovery Act to be temporary — to counter the recession and ameliorate its effects — and declines in block-grant funding then quickly resumed.
Putting the one-time Recovery Act funding increases aside, a detailed examination shows the trend of funding deterioration. Overall funding for the block-grant programs remained essentially unchanged from 2000 to 2002 despite the 2001 recession and then declined steadily through 2008. After rising significantly in 2009, funding fell off rather sharply in 2010, even though the economy continued to struggle and need for many of these programs remained elevated. And starting in 2011, overall funding was cut below its pre-recession level and has continued since then on a fairly steady downward path.
The marked deterioration in block-grant funding over time refutes the common claim by advocates of block grants that if funding levels prove inadequate, Congress will provide appropriate additional funding. Instead, a significant overall increase in such funding occurred only in the 2009 Recovery Act, and in that year only. Every Republican member of the House of Representatives, and all but three Republican senators, voted against that act.
Unlike block grants, entitlement programs such as Medicaid and SNAP are highly responsive to changes in need. They grow immediately and automatically when need rises. This growth is critically important during recessions: it not only directly helps families hit by the downturn but also moderates the severity and duration of the recession by lessening the drop in consumer purchasing power, thereby helping the economy as a whole.[7] Programs like Medicaid and SNAP would lose this responsiveness if turned into block grants.
Funding Erosion Is Intrinsic to Block Grant Structure
Block grants’ basic structure makes them especially vulnerable to funding reductions over time. Block grants are usually designed to give state and local governments very broad flexibility over their use of federal funds. As a result, the funds are used in a variety of ways and their impact is hard to document. Often, it is difficult even to track in detail how the money is used. That, in turn, makes it easier for national policymakers seeking resources for their own priorities to look to block grants for savings, and has made block grants particularly vulnerable to funding freezes for years on end. It should come as no surprise that block grants in general have fared very poorly in the competition for resources.
The shifting politics around the Social Services Block Grant (SSBG) is illustrative. In 1981, President Reagan argued for creating new block grants by saying they are needed “to reduce wasteful administrative overhead and to give local governments and states more flexibility and control.” SSBG was an element of broad 1981 legislation, but its funding has since dropped by 73 percent, after adjusting for inflation. More recently, House Republicans have proposed eliminating SSBG, with House Ways and Means Committee Chairman Kevin Brady calling it a “no-strings-attached slush fund for states with no accountability.” [8]
Policymakers should keep this in mind when considering new block-grant proposals and claims that merging programs into broad block grants will improve results for the families the programs serve. Experience suggests, to the contrary, that the most predictable result of merging social programs into broad block grants is substantial erosion in funding over time, with negative consequences for efforts to assist people in need and for the economy as a whole.
Technical Note
The funding levels used in this paper represent the amounts appropriated for each year for discretionary (non-entitlement) programs, or the amounts specified in authorizing legislation in the case of the three mandatory programs included (TANF, the Social Services Block Grant, and the mandatory portion of the Child Care and Development Fund). Figures for 2017 represent the annualized amounts available under the continuing resolution currently in effect through April 28 (PL 114-254). Because of numerous pressures on non-defense appropriations, combined with a flat overall cap, final overall 2017 funding for discretionary block grant programs is more likely to end up a bit lower than higher.
The funding levels in our analysis include any small set-asides for related purposes such as training, technical assistance, or evaluation, but do not include set-asides for competitive grants or ad hoc disaster assistance. The inception dates represent the fiscal year in which each of the block grants took on its current basic form. If a particular grant was phased in, the inception date is the year in which the phase-in was complete.
Some amounts given in this paper differ somewhat from those in previous CBPP papers on the subject. The main reason is that for many of the block grants, previous papers used data on amounts obligated in each year rather than amounts appropriated. We have now found sources that allow switching entirely to appropriations (budget authority) data, which is a better measure of the discretionary action taken by Congress each year and allows more direct comparisons with subsequent appropriations legislation. In addition, a few of the inception dates have been revised based on further research.
For more information on the methods used to construct these numbers, see the Methodology to this paper at https://www.cbpp.org/research/federal-budget/block-granting-low-income-programs-leads-to-large-funding-declines-over-ti-0.
End Notes
[1] Richard Kogan, “House GOP Effort to Kill Social Services Block Grant Should Be Cautionary Tale,” CBPP, April 8, 2016, https://www.cbpp.org/blog/house-gop-effort-to-kill-social-services-block-grant-should-be-cautionary-tale.
[2] Robert Jay Dilger and Eugene Boyd, “Block Grants: Perspectives and Controversies,” Congressional Research Service, July 15, 2014, http://fas.org/sgp/crs/misc/R40486.pdf. Table 2 of this CRS report contains a list of block-grant programs. This analysis examines all the listed block-grant programs that are focused on housing, health, and social services for low-income people, except for those funded at levels below $100 million and also excepting Emergency Solutions Grants, which did not exist in its current form in 2000, our departure point for analyzing trends over time. Funding for Emergency Solutions Grants is now $269 million. Accounting for inflation, this represents a decline of 12 percent since 2012, the first year it was fully in effect in its current form; accounting for population growth as well, this represents a decrease of 15 percent (funding data from Libby Perl, “The HUD Homeless Assistance Grants: Programs Authorized by the HEARTH Act,” Congressional Research Service, August 29, 2016).
[3] “Maintenance-of-effort” (MOE) requirements can limit such funding shifts, but such requirements are notoriously difficult to enforce, and experience has shown they are not fully successful. The Government Accountability Office has documented, for example, how some states substituted federal TANF funding for other state costs, despite an MOE requirement. (See “Welfare Reform: Challenges to Maintaining a Federal-State Fiscal Partnership,” August 2001, http://www.gao.gov/assets/240/232403.pdf.) MOE requirements also can be compromised when states can count spending by third parties toward the requirements. For a particularly egregious example of this practice, see Melissa Johnson, “Pending TANF Changes Could Send Georgia Budget Writers Scrambling,” Georgia Budget and Policy Institute, August 21, 2015, http://gbpi.org/pending-tanf-changes-could-send-georgia-budget-writers-scrambling.
[4] Liz Schott, “Lessons from TANF,” CBPP, February 22, 2017, https://www.cbpp.org/research/lessons-from-tanf-block-granting-a-safety-net-program-has-significantly-reduced-its.
[5] Liz Schott and Ife Floyd, “How States Use Funds Under the TANF Block Grant,” CBPP, January 5, 2017, https://www.cbpp.org/research/family-income-support/how-states-use-funds-under-the-tanf-block-grant.
[6] For year-by-year figures for the individual block grant programs from 2000-2017, adjusted for inflation, https://www.cbpp.org/sites/default/files/atoms/files/2-22-17bud.xlsx.
[7] Nationally, the number of families receiving TANF cash aid increased only modestly during the Great Recession, and actually fell in some states, despite the large jump in need. SNAP, in contrast, grew commensurate with the increase in need and in recent years has fallen as need has declined. Schott, op. cit.
[8] Kogan, op. cit.
More from the Authors

Areas of Expertise