Incomes Fell for Poorest Children of Single Mothers in Welfare Law’s First Decade
Average incomes fell significantly among the poorest children in single-mother families in the first decade after enactment of the 1996 welfare law, reflecting a large drop in cash assistance through the Temporary Assistance for Needy Families (TANF) block grant. These findings provide further evidence that supports the growing agreement among researchers that TANF’s record has been mixed.[1] Since the welfare law’s enactment, the overall poverty rate for single-parent families has fallen — though many other factors besides TANF influenced this trend — but the poorest families and children have become worse off. Previous analyses have found that the share of children in “deep poverty,” with incomes below half of the poverty line, climbed during the welfare law's first decade.[2]
This new analysis provides these findings:
- Incomes fell by 18 percent for the poorest tenth of children of single mothers between 1995 and 2005. Using a comprehensive measure of family income, we find that between 1995 and 2005 (the best period to examine the effects of TANF reforms, as the economy was similar in both years), the average family income of the poorest one-tenth of children in single-mother families fell by nearly $2,400, or 18 percent. The losses among this group, which consists of about 2 million of the nation’s most disadvantaged children, were driven by a $2,800 decline in TANF cash assistance. In contrast, incomes rose for every other income group of children of single mothers over this period, though the gains were particularly modest for the next poorest decile. (All figures in this analysis are adjusted for inflation and family size; they are expressed in 2015 dollars and as equivalent to a three-person family.)
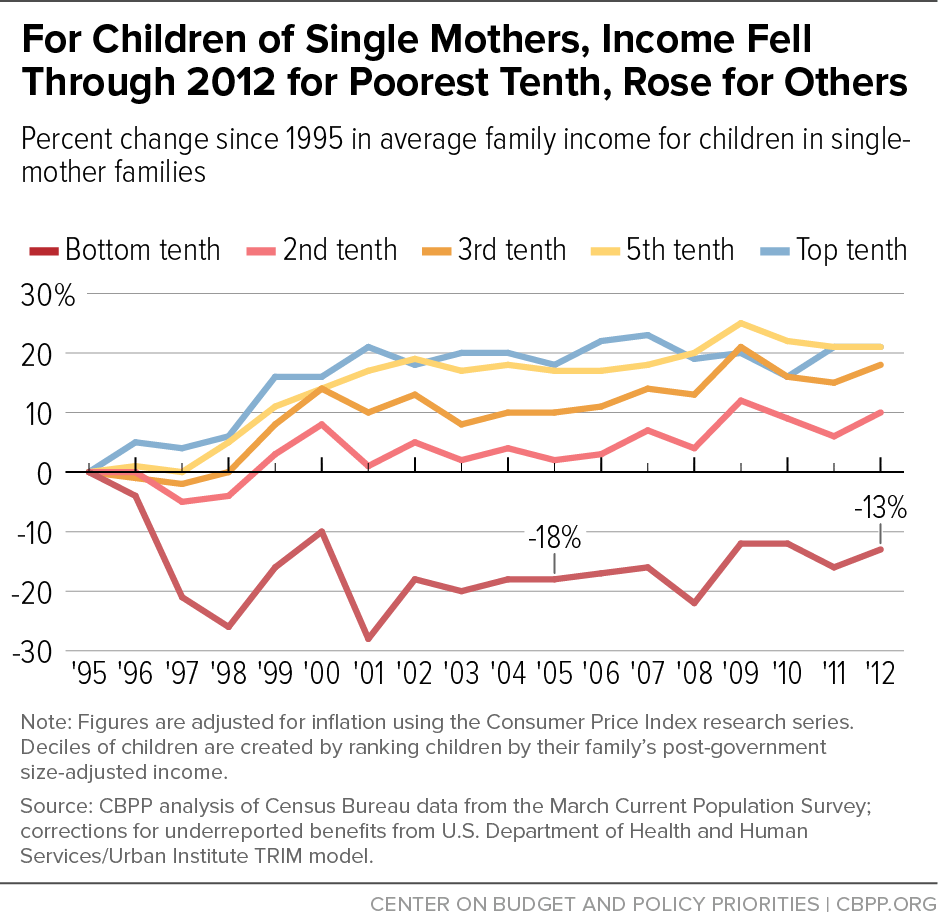
- The poorest single-mother families recouped some of these losses after 2005. From 2005 to 2012 (the last year for which our income measure is available), the bottom tenth of children in single-mother families gained about $700, on average. Their TANF aid continued to decline, however, albeit by a more modest $200 per family. The gains over this period largely reflect increases in SNAP (formerly food stamps), including temporary measures enacted to support struggling households during the Great Recession, which expired in 2013. Even so, from 1995 to 2012 (when the temporary increase in SNAP benefits was still in effect), the bottom tenth of children in single-mother families lost ground.
- The loss of TANF also affected other children in single-mother families. Among the second tenth of children in single-mother families, average annual TANF income fell nearly $3,600 from 1995 to 2005. This group lost more in TANF than it gained in earnings and other non-government income. It avoided losing overall family income only because some families in the group were able to turn to other safety-net benefits.
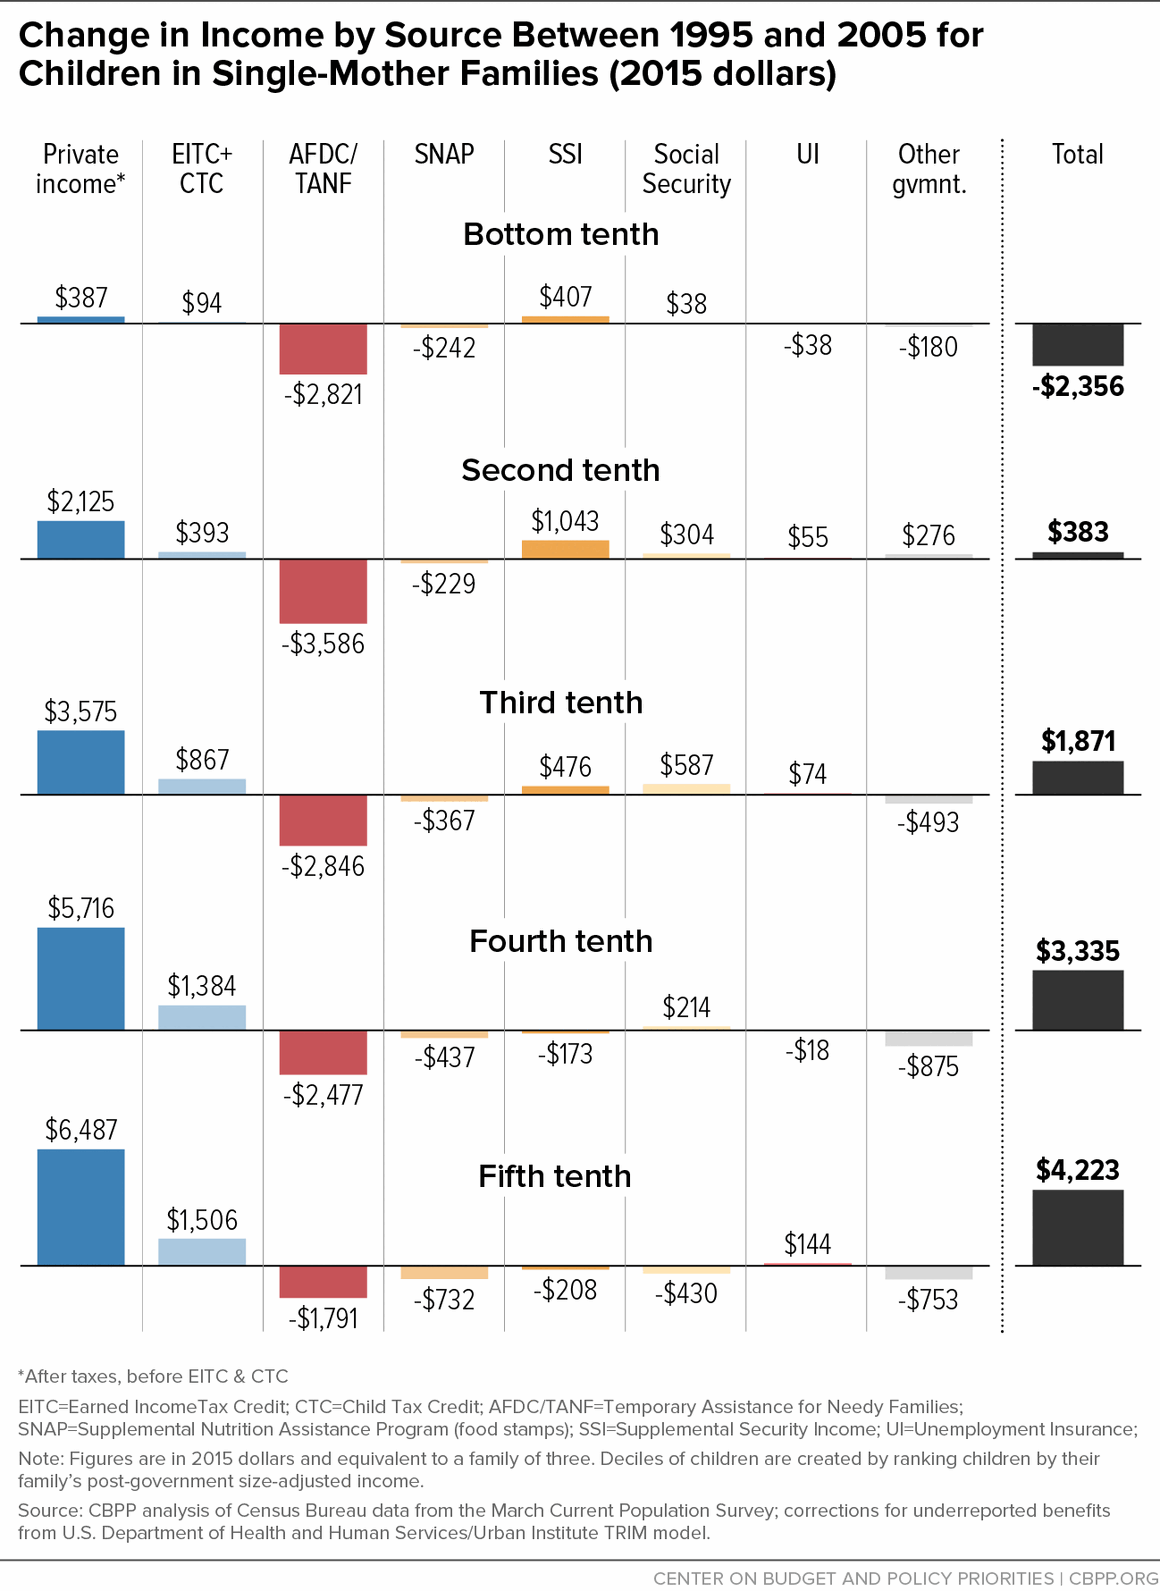
- The income declines for the poorest children reflect a shift toward a work-based safety net that helps those somewhat higher on the income scale. This analysis suggests that the focus of the safety net has shifted away from helping the very poorest children (particularly with regard to TANF) and toward those modestly higher on the income ladder (particularly with tax credits for working families, such as the Earned Income Tax Credit and Child Tax Credit). From 1995 to 2005, government support fell by an average of $2,400 for children with no other identifiable source of family income, due primarily to a $4,100 average drop in TANF benefits. Government support also fell for those with $1 to $10,000 in non-government income, as well as for those earning $10,000 to $20,000, with TANF again leading the losses. In contrast, government support rose for those earning $20,000 to $30,000 and those making $30,000 to $40,000, as increases in their Earned Income Tax Credit and Child Tax Credit outweighed declines in TANF. The finding that safety net assistance has shifted from the poorest families toward families with somewhat higher incomes is consistent with recent research by leading academic experts.[3]
Our Approach
This analysis focuses on children, the age group for whom evidence is strongest that deep poverty can cause lasting harm. We limit this analysis to children in single-mother families because such families historically have been those most likely to receive cash assistance and therefore would have been the most strongly affected by the 1996 welfare law. (“Single mothers” in this analysis include a small number of other female family heads in a parenting role — in particular, a grandparent or other female relative when no parent is present.)
The analysis uses a more comprehensive measure of family economic well-being than the standard Census income data provide. Specificially, our income measure goes beyond standard Census income data in that it accounts for taxes (including refundable tax credits such as the Earned Income Tax Credit and Child Tax Credit) and benefits that are similar to cash (food assistance, housing subsidies, and home energy assistance), adjusts income for changes in family size (following the Congressional Budget Office methodology for doing so), counts unmarried but long-term partners as part of the family, and includes the best available corrections for households’ underreporting of government benefits in the Census data, using the Urban Institute’s TRIM model to make these corrections.
Poorest Tenth of Children of Single Mothers Lost Income from 1995 to 2005
The decade from 1995 to 2005 is the most suitable period for examining the effects of the 1996 welfare law. It extends from the year before the law was passed until ten years later, when the major changes made to TANF had mostly played out. Further, 1995 and 2005 shared similar overall unemployment rates and represented similar stages in the business cycle.[4] Comparing years with similar economic conditions makes it easier to assess the independent effects of policy changes.
Although the poverty rate for single-mother families as a whole fell over this decade,[5] the economic situation of the very poorest of these families deteriorated, and the poorest 10 percent of children in single-mother families fared notably worse than their peers at every other income level. These conclusions emerge when children of single mothers are ranked by family income and divided into ten equally sized groups, or deciles. From 1995 to 2005, using a comprehensive income measure:
- The average family income of the poorest decile of children in single-mother families fell 18 percent, from $12,960 to $10,604.[6]
- No other income group lost ground, though average family income barely changed for the second poorest decile, edging up 2 percent. Incomes rose 10 percent or more for the other deciles. (See Figure 1; Appendix B Table 1 provides more detail.)
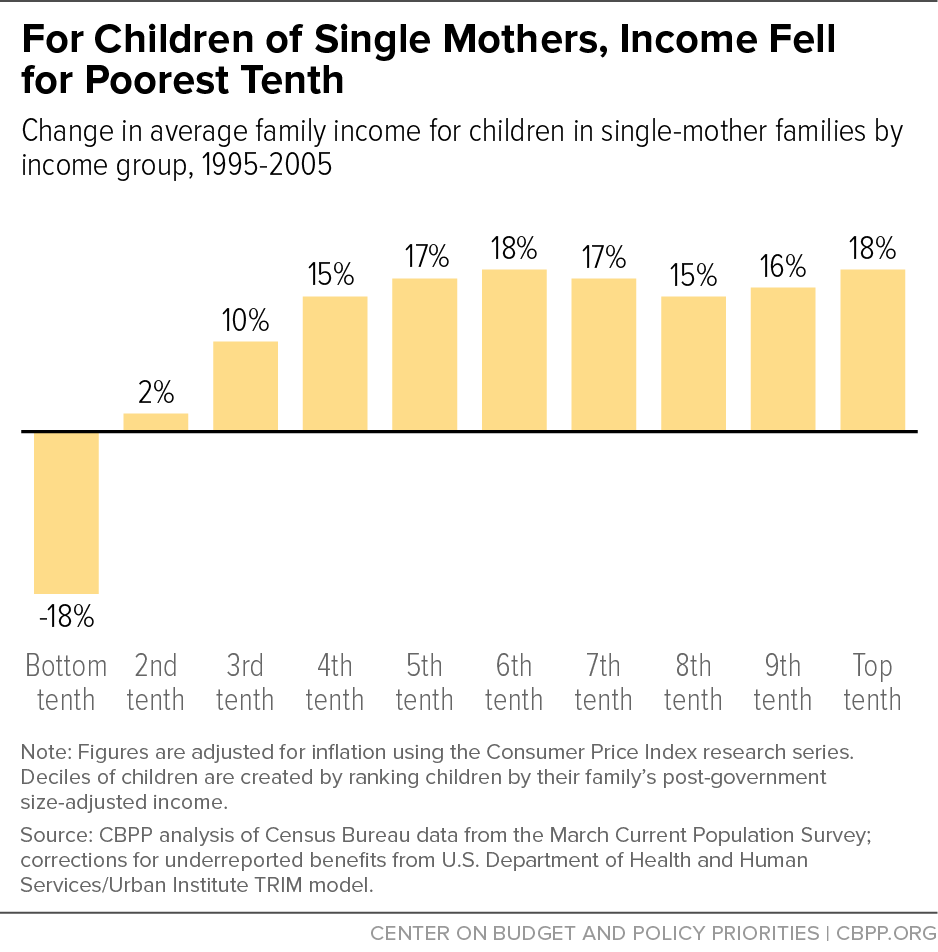
As these data show, families in the second and third deciles — which received more aid, on average, in 1995 from Aid to Families with Dependent Children (AFDC, TANF’s predecessor) than did families in higher deciles — had somewhat slower income growth than higher-income families. The second- and third-decile families experienced both smaller gains in earnings and larger losses of cash assistance than families in higher deciles.
Dwindling TANF Assistance Drove Income Losses at the Bottom
The chief reason for the decline in income for the poorest tenth of children in single-mother families after 1995 was loss of TANF cash assistance that wasn’t replaced with other income sources. These children’s average family income from TANF or AFDC fell by more than $2,800 between 1995 and 2005. Their income from other sources rose by less than $500, for a net loss of nearly $2,400.[7] (See Table 1.)
TANF income fell in part because of a sharp drop in the number of families TANF served, which fell by more than half from 1995 to 2005,[8] due in large measure to the welfare law’s work requirements, time limits, and other restrictions. The value of TANF benefits per recipient also fell, with the maximum benefit for a three-person family in the median state falling 18 percent from January 1996 to January 2005, after adjusting for inflation. The decline in the number (and share) of low-income families receiving assistance — and in the level of benefits provided to those still getting aid — reflects, in part, TANF’s funding structure, which provides states with great flexibility for how funds are used and rests on a level of federal block-grant funding that has been frozen since 1996 and whose value consequently has eroded markedly with inflation.
| TABLE 1 | |||
|---|---|---|---|
| Change in Income by Source for Bottom Tenth of Children in Single-Mother Families, 1995 to 2005 (2015 dollars) | |||
| 1995 | 2005 | Change | |
| Private Income (after taxes, before EITC & CTC) | $1,665 | $2,052 | +$387 |
| EITC + CTC | 298 | 392 | +94 |
| TANF | 3,926 | 1,105 | -2,821 |
| SNAP | 4,523 | 4,281 | -242 |
| Other government assistance | 2,548 | 2,775 | +227 |
| Total Income | 12,960 | 10,604 | -2,356 |
Other sources of family income for the bottom decile changed far less than TANF. As Table 1 shows, SNAP benefits for this group fell by an average of more than $200 over this period. (The welfare law included several across-the-board SNAP benefit reductions that affected virtually all households with children. It also eliminated SNAP eligibility for many legal immigrants, although some of these eligibility cuts were later reversed.) Private income, refundable tax credits, and other government assistance all rose somewhat.[9]
The net result was unmistakable. Children in the nation’s poorest single-mother families lost ground in the period after welfare reform.
Safety Net Expansions After 2005 Helped Children in Poorest Single-Mother Families to Partially Recoup Income Losses
From 2005 to 2012, children in the poorest single-mother families gained modestly by our measure, despite the worst recession in decades, due to the strengthening of SNAP — including a sizeable temporary benefit increase in the 2009 Recovery Act. As Table 2 shows, average SNAP benefits for the bottom decile rose by more than $1,200 from 2005 to 2012. Other income sources declined, though to a lesser degree. The decline in TANF income of approximately $200, while notable, was modest compared with the decline of more than $2,800 from 1995 to 2005. The net result was that family income for these children rose by nearly $700 on average.
| TABLE 2 | |||
|---|---|---|---|
| Change in Income Amounts by Source for the Bottom Tenth of Children in Single-Mother Families, 2005 to 2012 (2015 dollars) | |||
| 2005 | 2012 | Change | |
| Private Income (after taxes, before EITC & CTC) | $2,052 | $1,783 | -$269 |
| EITC + CTC | 392 | 324 | -68 |
| TANF | 1,105 | 897 | -208 |
| SNAP | 4,281 | 5,512 | +1,231 |
| Other government assistance | 2,775 | 2,764 | -11 |
| Total Income | 10,604 | 11,281 | +677 |
The modest gains for the bottom decile between 2005 and 2012 only partly offset their dramatic income declines between 1995 and 2005. As Table 3 shows, income for the bottom decile fell by nearly $1,700 (13 percent) between 1995 and 2012. Their TANF income fell by more than $3,000 (77 percent), their SNAP benefits rose about $1,000, and other income sources rose slightly. (For year-by-year detail, see Appendix B Figure 1.)
These figures stop at 2012, the latest year for which corrections for underreported income are available, and therefore do not reflect the recent declines in SNAP, including the expiration of the Recovery Act’s temporary benefit increase in November 2013.[10] Nor do the figures reflect more recent earnings growth, along with a drop in unemployment insurance assistance.
| TABLE 3 | |||
|---|---|---|---|
| Change in Income Amounts by Source for the Bottom Tenth of Children in Single-Mother Families, 1995 to 2012 (2015 dollars) | |||
| 1995 | 2012 | Change | |
| Private Income (after taxes, before EITC & CTC) | $1,665 | $1,783 | +$118 |
| EITC + CTC | 298 | 324 | +26 |
| TANF | 3,926 | 897 | -3,029 |
| SNAP | 4,523 | 5,512 | +989 |
| Other government assistance | 2,548 | 2,764 | +216 |
| Total Income | 12,960 | 11,281 | -1,679 |
Year-by-year figures illustrate the impact of temporary Recovery Act measures in averting income losses in the Great Recession. For the bottom three deciles of children in single-mother families, average family incomes started to decline as the recession took hold in 2008 but recovered in 2009 as these temporary measures were implemented. (See Figure 2.)
Loss of TANF Also Affected Other Children in Single-Mother Families
The decline in TANF income support from 1995 to 2005 affected not only the poorest tenth of children in single-mother families but also many of their peers somewhat higher in the income distribution. (See Appendix B Figure 2 for a breakdown of changes in income for each of the five lowest deciles.) In particular, children in the second decile — with incomes barely above those of the poorest decile[11] — avoided losing family income only because they were able to turn to other safety-net benefits. On balance, their average income gain was a small 2 percent over this decade.
In this income group, average annual TANF income fell nearly $3,600 from 1995 to 2005, more than in any other income decile. Their decline in TANF income was larger than their gain in earnings and other private (non-government) income (which was $2,100 after taxes but before tax credits). The second decile avoided net income losses only thanks to gains in Supplemental Security Income (SSI) and the two major working-family tax credits that policymakers expanded in the 1990s and early 2000s: the Earned Income Tax Credit (EITC) and Child Tax Credit (CTC).
The rise in SSI income of about $1,000 a year suggests that some parents or children in the second decile who lost TANF may have subsequently enrolled in SSI’s benefits for individuals with severe disabilities.[12] Increased employment and earnings in the second decile during this period also raised this group’s EITC and CTC income, as both credits reward work by rising in value as earnings rise.
While the 1996 welfare law almost certainly propelled some earnings gains, how much it contributed is unclear. Past research has found that the welfare law resulted in lower TANF participation and increased earnings overall. Researchers have also found, however, that the combination of the strong economy of the 1990s and EITC expansions were more important factors in the increase in employment of single mothers than the 1996 welfare law.[13] As noted previously, our data show a pattern of strong income gains for most of the deciles in this analysis — including the top deciles, where the law’s influence was presumably quite small — further suggesting that factors other than the welfare law contributed importantly to the earnings gains.
In the third through fifth deciles, the EITC and CTC contributed between one-third and one-half of the overall income gains, with the increase peaking in value in the fifth decile at just over $1,500. See Appendix B Figure 2 for further details.
Income Declines for Poorest Children Reflect Shift Toward Work-Based Safety Net
The figures cited above suggest there has been a shift in the focus of the safety net, away from helping the very poorest children (particularly with regard to TANF) and toward those modestly higher on the income ladder (particularly with the expansion of tax credits for low- and modest-income working families). Leading academic experts have noted this shift as well.[14]
A more direct way to see this shift is to examine changes over time in the impact of government benefits and taxes on children in a given income range. From 1995 to 2005, among children in single-mother families in our data:
- For the very poorest children — those with no identifiable source of family income apart from government benefits — total government support (net of taxes) fell by about $2,400, driven entirely by a decline in TANF.
- Government support also declined (by $1,200) for those with between $1 and $10,000 in non-government income as well as for those making $10,000 to $20,000 (by $200), with TANF again leading the losses.
- Government support rose for those with non-government income between $20,000 and $30,000 (up $1,100) and those making $30,000 to $40,000 (up $800), as increases in the EITC and CTC outweighed declines in TANF.
The safety net rewards and encourages work more than it did 20 years ago. That’s a positive development. But the goal of encouraging work is important but should be pursued in ways that do not expose children to deeper economic hardship. Research suggests that even modest differences in family income for young children in poverty can have measurable effects on academic achievement, school completion, and expected earnings in adulthood.[15]
Conclusion
In the decade following the 1996 welfare law, the safety net became weaker for many of the poorest and most vulnerable children, as support shifted toward those in working families. From 2005 to 2012, income support rebounded somewhat, thanks in large measure to SNAP, including a temporary expansion enacted during the Great Recession that has now expired. Some policymakers have proposed TANF-like changes to SNAP and other key safety net programs. If such changes reduce access to assistance as they have with TANF, however, the poorest children in single-mother families could end up still worse off.
Appendix A:
Methodology
This analysis starts with person-level data from the Census Bureau’s Current Population Survey (CPS) Annual Social and Economic Supplement covering 1995 to 2012. We limit our analysis to children in single-mother families because such families historically were the most likely to receive cash assistance and therefore were the most strongly affected by the 1996 welfare law. We include all children under age 18 living in a single-mother family except those in a family with negative private (non-government) income; we exclude these families because they likely include business owners who may possess substantial assets but experience temporary business losses. “Single mothers” in this analysis include a small number of other female family heads in a parenting role — in particular, a grandmother or other female relative when no parent is present.
To examine the economic well-being of children in single-mother families, we first rank all children in single-mother families in our data from poorest to richest by year, based on each family’s size-adjusted income. Based on that ranking, we divide children into ten equal groups, or deciles. Each decile consists of about 2 million children. We use the same family-size adjustment that the Congressional Budget Office applies to household income in its studies of historical federal income distribution and tax burdens; specifically, we divide family income by the square root of the number of people in the family, counting adults and children equally. This adjustment implies that each additional person increases a family’s needs but does so at a decreasing rate because larger families can share resources and take advantage of economies of scale. We present all family income figures as equivalent to a family of three, which is the most common family size for children in single-mother families. To do this, we multiply size-adjusted family income figures by the square root of three.
We adjust income for inflation using the Bureau of Labor Statistics’ research series of the Consumer Price Index (CPI-RS). This is the same inflation adjustment that the Census Bureau uses for adjusting its historical series of family and household income. The federal government has multiple inflation adjustments, however, and some analysts prefer an adjustment known as the Personal Consumption Expenditures (PCE) deflator. As we’ve noted, using the PCE deflator instead of the CPI-RS does not substantially change our main finding. Between 1995 and 2005, the average family income of the poorest decile of children in single-mother families fell by 18 percent when using the CPI-RS and by 14 percent using the PCE.
To more accurately measure the family income of children in single-mother families, we have made a number of additional adjustments to our data, including:
- Accounting for non-cash benefits and taxes. The official poverty measure and standard Census income data count only cash income, which includes sources such as earnings from work, interest, dividends, child support, and government cash payments such as Social Security, unemployment insurance, and monthly payments from TANF and the SSI program for very-low-income seniors and people with disabilities. Our income measure also includes the value of government non-cash benefits (other than medical benefits, which most analysts agree are “far from being equivalent to cash”[16]) and the net impact of federal and state income taxes and payroll taxes. Specifically, we include the value of SNAP and housing assistance, school lunch subsidies, and low-income home energy assistance. We also count tax credits for working families such as the EITC and CTC, while subtracting federal and state income taxes and payroll taxes paid. We do not subtract state sales tax because the data needed to do so are not available. We use payroll tax estimates provided by Census on the CPS file. We use federal and state income tax estimates based on a model created by the National Bureau of Economic Research (and known as TAXSIM); these are more consistent over time than the Census Bureau’s own income tax estimates, which Census is continually improving. [17]
- Correcting for underreporting of benefits. We correct for the tendency of Census Bureau data to underreport income from three government assistance programs: TANF, SNAP, and SSI. The corrections come from the Transfer Income Model version 3 (TRIM3) policy micro-simulation model baseline estimates, maintained and developed by the Urban Institute with primary funding from the U.S. Department of Health and Human Services Office of the Assistant Secretary for Planning and Evaluation. TRIM starts with Census survey data but adjusts those data to more closely match actual numbers and characteristics of benefit recipients shown in program records. Our analysis ends in 2012 because that is the last year for which these corrections are available for all three programs we use: TANF, SNAP, and SSI, which are the only three assistance programs for which TRIM provides corrections from 1995 to 2012 that are adjusted to match administrative totals.
- Counting more people as family members. In the official poverty measure and standard Census family income tables, the family unit includes people residing together who are related by birth, marriage, or adoption. This means that under the official poverty measure, the income of a single mother’s unmarried partner is not counted toward her family’s income. Research has generally found that cohabitating couples are less likely than married couples to pool all of their income together.[18] In this analysis, we’ve chosen to include longer-term partners in a single mother’s family unit though not temporary partners, since they appear to contribute less of their income to the family than long-term partners do.[19] (We consider partners long-term if they were present in the household both at the time of the survey and 12 months earlier. We do this only if one of the partners is the head of household, because the relationship data needed for including other unmarried partners are not available for the early years of our study.) Counting short-term as well as long-term partners in the family unit would not substantially change our main finding. Between 1995 and 2005, the average family income of the poorest decile of children in single-mother families fell by 18 percent when including only long-term partners and by 16 percent when including all partners.[20]
Income Support Programs
The following government benefits are included in this analysis:
- Social Security
- Unemployment insurance (UI)
- Workers’ compensation
- Veterans’ benefits
- Pell Grants and other government education grants
- Temporary Assistance for Needy Families (TANF)
- State General Assistance (GA)
- Supplemental Security Income (SSI)
- Supplemental Nutrition Assistance Program (SNAP, formerly food stamps)
- National School Lunch Program
- Rental subsidies (such as Section 8 and public housing)
- Home energy assistance
- Earned Income Tax Credit
- Child Tax Credit
Benefit figures for 2008-2010 also reflect a number of temporary federal benefits enacted in response to the Great Recession:
- 2008 stimulus payment
- 2009 Economic Recovery Payment
- 2009-2010 Making Work Pay Tax Credit
Taxes owed consist of federal and state income tax and federal payroll tax.
Appendix B:
Detailed Figures and Tables
A Year-by-Year Compositional Analysis
Appendix Figure 1 illustrates in greater detail the shifting income sources of children in single-mother families for each year from 1995 through 2012. The figure shows both the overall decline in average family income for the poorest decile of children of single mothers (in the top line) and the role that dwindling TANF income played in that decline.
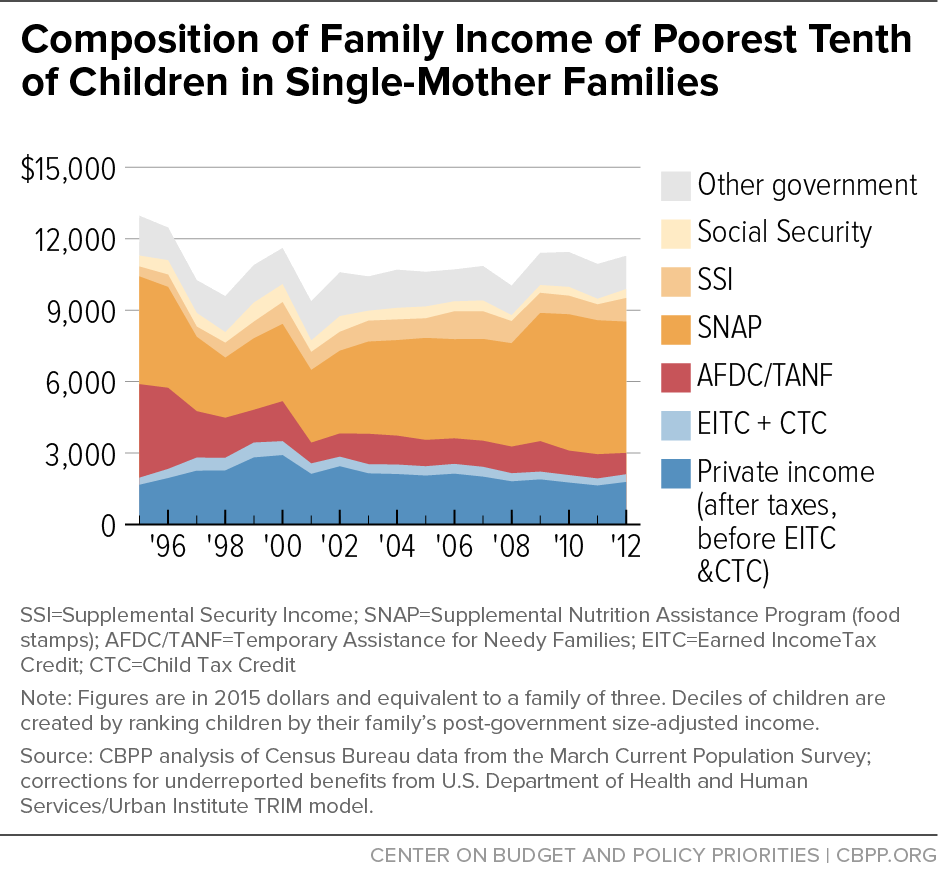
Each color in Figure 1 represents a different source of income. Cash assistance from AFDC/TANF (in red) shrank rapidly through 2000 and remained at a diminished level by 2005; it showed few signs of growing in response to the Great Recession.
Although the growth of the dark blue area at the bottom of the graph indicates that earnings and other private income (after taxes but before tax credits) grew from 1995 through 2000 — consistent with the combined effect of a booming economy, welfare-to-work policies, and an expanded EITC and other supports for working families — this growth in private income did not make up for the loss of TANF for this group of disadvantaged children.
Other than the changes to TANF, changes to SNAP had the largest effect on income trends among the bottom decile of children in single-mother families over the 1995 to 2012 period. At first, SNAP income (in darker orange), fell sharply, shrinking by one-third from 1995 through 1998. One reason for this dropoff was the economy: SNAP eligibility and participation are responsive to the business cycle, and this was a period of economic growth. Another important factor was the 1996 welfare law, which made a number of cuts in SNAP eligibility and benefits. Moreover, the tightening of access to TANF initially had the unintended consequence of reducing SNAP participation because, prior to TANF, many recipients received food stamps as a result of applying for cash assistance; falling TANF caseloads severed this link and meant that many low-income families no longer received food stamps despite remaining eligible. Participation rates in SNAP as measured by the U.S. Department of Agriculture fell from 75 percent in 1994 to 54 percent by 2002.
A bipartisan consensus that the SNAP program should be more accessible, particularly to working families, led Congress to enact changes to the program in 2002 and 2008 that, along with state administrative improvements, raised program participation by eligible households. By 2010, the share of eligible individuals receiving SNAP was back at 75 percent. The bump in SNAP income that can be seen in 2009 also reflects in part a sizable temporary boost in monthly SNAP benefits enacted as part of the Recovery Act, which expired in November 2013.
It should be noted that SNAP participation and average benefits per participant have declined significantly since 2012, the last year for which our corrected income measure is available.[21]
1995 to 2005 Change in Income by Source
Declines in TANF affected each of the five lowest deciles (which together make up the poorest half) of children in single-mother families from 1995 to 2005. For each of those deciles, Appendix Figure 2 shows how other income sources made up for — or failed to make up for — the reduction in TANF.
In the poorest decile, as noted previously, other income sources did not compensate for TANF losses, and net income fell.
The second decile avoided net income losses thanks to gains in SSI and the EITC (chiefly from 1995 to 1996) and the CTC (which was created in 1997 but became an important income source for this income group in the early 2000s).
In the third through fifth deciles, the EITC and CTC contributed a rising share of the overall income gains.
| APPENDIX TABLE 1 | ||||||
|---|---|---|---|---|---|---|
| Change in Family Income for Deciles of Children in Single-Mother Families, 1995 to 2012 Figures are in 2015 dollars and equivalent to a family of three |
||||||
| 1995 | 2005 | 2012 | 1995-2005 | 2005-2012 | 1995-2012 | |
| Bottom 10% | $12,960 | $10,604 | $11,281 | -18% | 6% | -13% |
| 10-20% | $16,716 | $17,099 | $18,413 | 2% | 8% | 10% |
| 20-30% | $19,414 | $21,285 | $22,941 | 10% | 8% | 18% |
| 30-40% | $22,237 | $25,572 | $26,875 | 15% | 5% | 21% |
| 40-50% | $25,267 | $29,490 | $30,560 | 17% | 4% | 21% |
| 50-60% | $28,501 | $33,663 | $34,146 | 18% | 1% | 20% |
| 60-70% | $33,416 | $39,232 | $38,479 | 17% | -2% | 15% |
| 70-80% | $40,479 | $46,551 | $45,197 | 15% | -3% | 12% |
| 80-90% | $50,392 | $58,308 | $56,751 | 16% | -3% | 13% |
| 90-100% | $82,147 | $97,306 | $99,299 | 18% | 2% | 21% |
End Notes
[1] Robert Greenstein, “Welfare Reform and the Safety Net: Evidence Contradicts Likely Assumptions Behind Forthcoming GOP Poverty Plan,” Center on Budget and Policy Priorities, June 6, 2015, https://www.cbpp.org/research/family-income-support/welfare-reform-and-the-safety-net.
[2] Arloc Sherman, “Commentary: After 1996 Welfare Law, a Weaker Safety Net and More Children in Deep Poverty,” Center on Budget and Policy Priorities, August 9, 2016, https://www.cbpp.org/family-income-support/commentary-after-1996-welfare-law-a-weaker-safety-net-and-more-children-in; Arloc Sherman and Danilo Trisi, “Safety Net for Poorest Weakened After Welfare Law But Regained Strength in Great Recession, at Least Temporarily,” Center on Budget and Policy Priorities, May 11, 2015, https://www.cbpp.org/sites/default/files/atoms/files/5-11-15pov.pdf./ See also Yonatan Ben-Shalom, Robert Moffitt, and John Karl Scholz, “An Assessment of the Effectiveness of Anti-Poverty Programs in the United States,” National Bureau of Economic Research, 2011, www.nber.org/papers/w17042.pdf (also available in the Oxford Handbook on the Economics of Poverty, Oxford University Press, 2012).
[3] Robert A. Moffitt, “The Deserving Poor, the Family, and the U.S. Welfare System,” Demography, Volume 52, Issue 3, 2015.
[4] Unemployment stood at 5.6 percent in 1995 and 5.1 percent in 2005. Each year represented the fourth full year of economic growth following a recession.
[5] See Sherman and Trisi (2015); James P. Ziliak, “Temporary Assistance for Needy Families,” in Robert Moffitt, ed., Economics of Means-Tested Transfer Programs in the United States, National Bureau of Economic Research, November 2015, http://www.nber.org/chapters/c13483.pdf.
[6] The 18 percent decline is calculated using the Consumer Price Index research series to adjust for inflation; this is the standard method used by the Census Bureau for adjusting family income. If the Personal Consumption Expenditures (PCE) deflator is used instead, the decline is 14 percent. See methodological appendix for further details.
[7] Family income figures in text are rounded to the nearest $100; figures in tables are not rounded.
[8] HHS/ASPE, Welfare Indicators and Risk Factors: Fourteenth Report to Congress, Table TANF 1, https://aspe.hhs.gov/report/welfare-indicators-and-risk-factors-fourteenth-report-congress.
[9] The increase in other government assistance was driven by an increase in Supplemental Security Income (SSI) as some children and parents who lost benefits under TANF were found to be eligible for SSI’s assistance for poor people with serious disabilities.
[10] Dottie Rosenbaum and Brynne Keith-Jennings, “SNAP Costs and Caseloads Declining” Center on Budget and Policy Priorities, March 2016, https://www.cbpp.org/research/food-assistance/snap-costs-and-caseloads-declining.
[11] This category — the second decile of children of single mothers — had family incomes equivalent to about $15,400 to $18,000 a year for a family of three in 1995 (in 2015 dollars). In 2005, the range was $14,800 to $19,100.
[12] The composition of deciles is not fixed. The individual children in each decile may change from one year to the next, as may the characteristics of the families that make up the decile, such as the prevalence of disability or rate of employment. Thus, the data do not reveal the degree to which the rise in SSI income in the second decile reflects a rise in SSI participation among families that were always in that decile or a shift of previous SSI participants into the decile.
[13] Jeffrey Grogger, “The Effects of Time Limits, the EITC, and Other Policy Changes on Welfare Use, Work, and Income among Female-Head Families,” Review of Economics and Statistics, May 2003. See also Hanming Fang and Michael Keane, “Assessing the Impact of Welfare Reform on Single Mothers,” Brookings Papers on Economic Activity, 2004.
[14] Moffitt (2015).
[15] Hilary W. Hoynes, Diane Whitmore Schanzenbach, and Douglas Almond, “Long Run Impacts of Childhood Access to the Safety Net,” National Bureau of Economic Research Working Paper 18535, 2012, www.nber.org/papers/w18535; Greg J. Duncan and Katherine Magnuson, “The Long Reach of Early Childhood Poverty,” Pathways, Winter 2011, pp. 22-27, http://www.stanford.edu/group/scspi/_media/pdf/pathways/winter_2011/PathwaysWinter11_Duncan.pdf; Chuck Marr et al., “EITC and Child Tax Credit Promote Work, Reduce Poverty, and Support Children’s Development, Research Finds,” Center on Budget and Policy Priorities, updated October 1, 2015, https://www.cbpp.org/research/federal-tax/eitc-and-child-tax-credit-promote-work-reduce-poverty-and-support-childrens.
[16] Yonatan Ben-Shalom, Robert A. Moffitt, and John Karl Scholz, “An Assessment of the Effectiveness of Anti-Poverty Programs in the United States,” National Bureau of Economic Research Working Paper 17042, May 2011, http://www.nber.org/papers/w17042.
[17] Using TAXSIM means that we give up some features of the Census model, such as imputation of itemized deductions, but in return we are assured of a consistent model over time. For details on the NBER TAXSIM version9 model, see www.nber.org/~taxsim. Using TAXSIM with the CPS requires determining which individuals file taxes together. In general, we treat each nuclear family as a tax filing unit; however, we assume that foster children are dependents of the head of the housing unit, as are certain clusters of relatives (called related subfamilies) if they are living at home but have no earnings.
[18] Anne E. Winkler, “Economic decision-making by cohabitors: findings regarding income pooling,” Applied Economics Vol. 29 (1997); and Nicole Hiekel, Aart C. Liefbroer, and Anne-Rigt Poortman, “Income pooling strategies among cohabiting and married couples: A comparative perspective,” Demographic Research, Vol. 30 (2014).
[19] Short-term partners may contribute less to family finances than long-term partners, either because they feel less invested in the family or simply because couples in which the partner contributes less for whatever reason tend to break up sooner. We found evidence for this when we examined data on family hardships. In an unpublished analysis, we examined 402 single parents living below the poverty line (according to the official annual cash poverty definition) with an unmarried partner, using SIPP hardship questionnaires from 1998, 2003, 2005, and 2011 and income data for the preceding 12 months. Among these parents, having a partner with enough income to lift them and their children above the poverty line for the year was associated with significantly fewer material hardships, relative to having a poorer partner — but only if the partner was stable, that is, had lived with the family consistently for the previous 12 months. For other, non-stable partners, bringing in enough income (while cohabiting) to lift the family’s annual income above the official poverty line for the year did not reduce the number of reported hardships. This difference between stable and non-stable partners was statistically significant and suggests that the case for including long-term partners in the family unit for purposes of poverty determination is more compelling than the case for including short-term partners. (The analysis examined four hardships: food insecurity, falling behind on the rent or mortgage, having phone service cut off for failure to pay, and falling behind on gas or electric bills. Results were similar after controlling for differences in race, ethnicity, gender, number of children, parent education, age, disability, and whether the partner was a biological parent of the children.)
[20] If the PCE deflator is used instead of the CPI-RS to adjust for inflation and both short- and long-term partners are included in the family unit, the average family income of the poorest decile of children in single-mother families fell by 13 percent from 1995 to 2005.
[21] Dottie Rosenbaum and Brynne Keith-Jennings, “SNAP Costs and Caseloads Declining, Trends Expected to Continue,” Center on Budget and Policy Priorities, updated March 8, 2016, https://www.cbpp.org/research/food-assistance/snap-costs-and-caseloads-declining; Dottie Rosenbaum and Brynne Keith-Jennings, “SNAP Caseload Declines Accelerated in Recent Months, Return of Three-Month Time Limit a Factor in Many States,” Center on Budget and Policy Priorities, July 29, 2016, https://www.cbpp.org/research/food-assistance/snap-caseload-declines-accelerated-in-recent-months.
More from the Authors

Areas of Expertise
