
Where Families With Children Use Housing Vouchers
A Comparative Look at the 50 Largest Metropolitan Areas
The Housing Choice Voucher Program, the nation’s largest federal rental assistance program, assists over 5 million people in 2.2 million low-income households. Housing Choice Vouchers help these families afford decent, stable housing, avoid homelessness, and make ends meet. When implemented properly, vouchers can give low-income families real choices about where to live — including the chance to live in lower-poverty, higher-opportunity neighborhoods — and help public housing agencies meet their legal obligation to address housing discrimination and segregation.
This is the first metropolitan-level analysis to explore the concentration of families using vouchers across multiple neighborhood characteristics.This analysis examines the location of families with children using vouchers in all U.S. metropolitan areas and in the 50 largest metro areas across multiple neighborhood characteristics. Using Department of Housing and Urban Development (HUD) administrative data and Census Bureau survey data, we compare the location of these families to the location of voucher-affordable units using three measures: neighborhood poverty, an opportunity index, and the share of residents who are people of color.[2] This is the first metropolitan-level analysis, to our knowledge, to explore the concentration of families using vouchers across multiple neighborhood characteristics. Briefly summarized, our findings are:
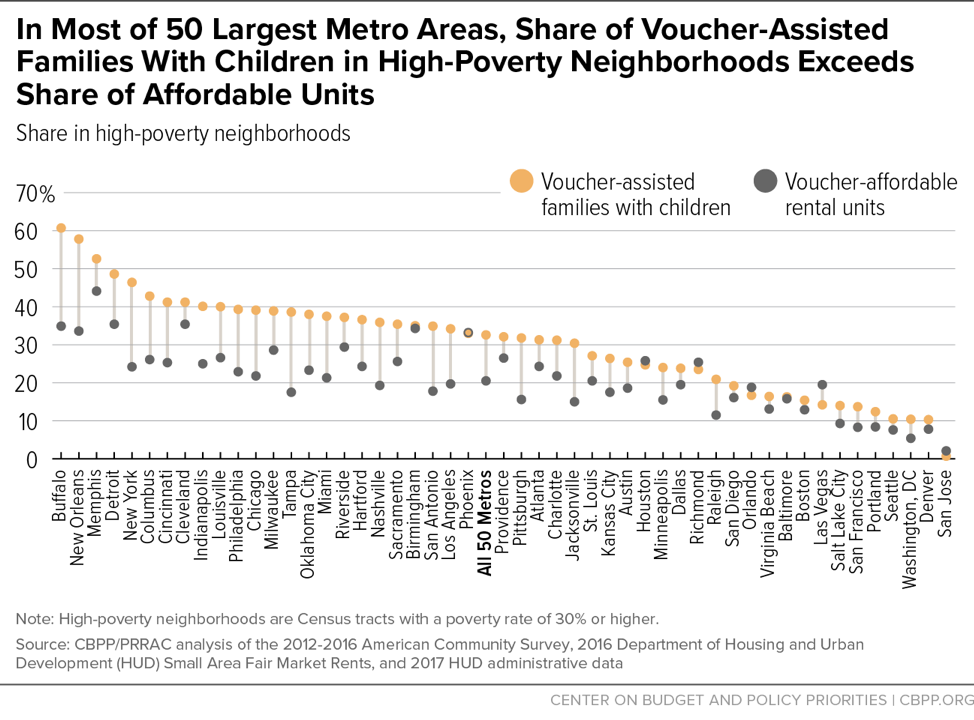
- Poverty rate. Few metropolitan[3] families with children using vouchers live in low-poverty neighborhoods (poverty rate below 10 percent), despite the presence of affordable units. Specifically, 14 percent of metropolitan families using vouchers live in low-poverty neighborhoods, but 25 percent of metropolitan voucher-affordable rental units are located there. Similarly, high-poverty areas (poverty rate at or above 30 percent) contain 33 percent of metropolitan families using vouchers but only 22 percent of metropolitan voucher-affordable rentals. These figures vary widely among the 50 largest metro areas. For example, the share of voucher-assisted families with children living in high-poverty neighborhoods ranges from 1 percent in the San Jose metro area to 61 percent in the Buffalo metro area.
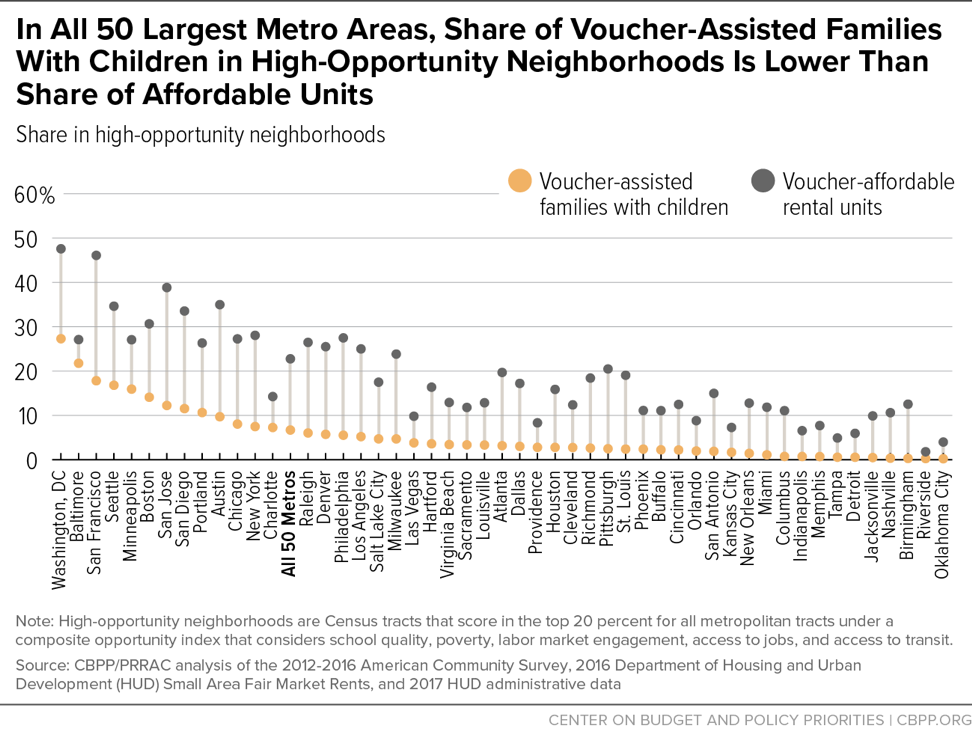
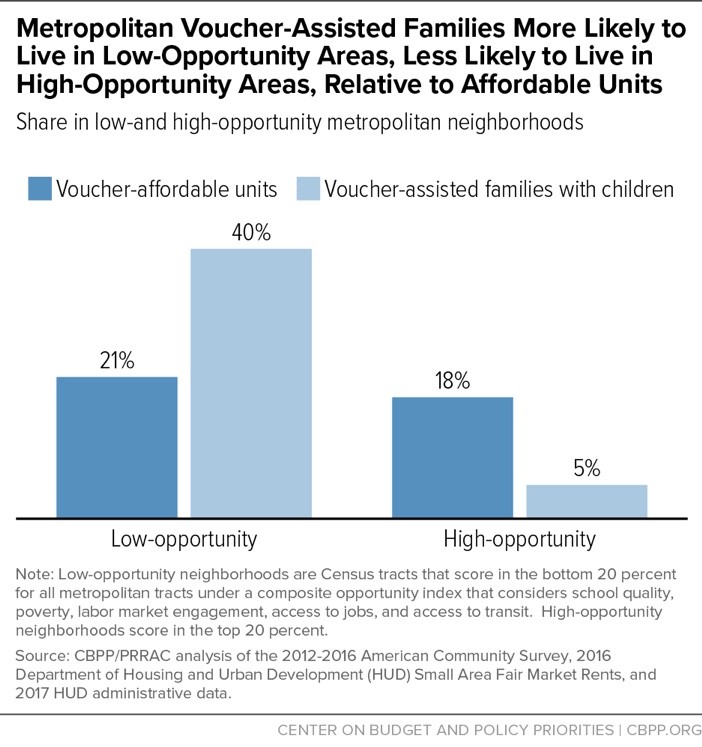
- Opportunity index. Few metropolitan families with children using vouchers live in “high-opportunity neighborhoods” based on a comprehensive composite index of opportunity we developed using indices created by HUD.[4] Specifically, 5 percent of metropolitan families using vouchers, but 18 percent of all metropolitan voucher-affordable rentals, are in high-opportunity neighborhoods. Similarly, low-opportunity areas contain 40 percent of metropolitan voucher-assisted families but only 21 percent of metropolitan voucher-affordable units. In every one of the 50 largest metro areas, the share of families with children using vouchers in high-opportunity neighborhoods is smaller than the share of voucher-affordable units in such neighborhoods.
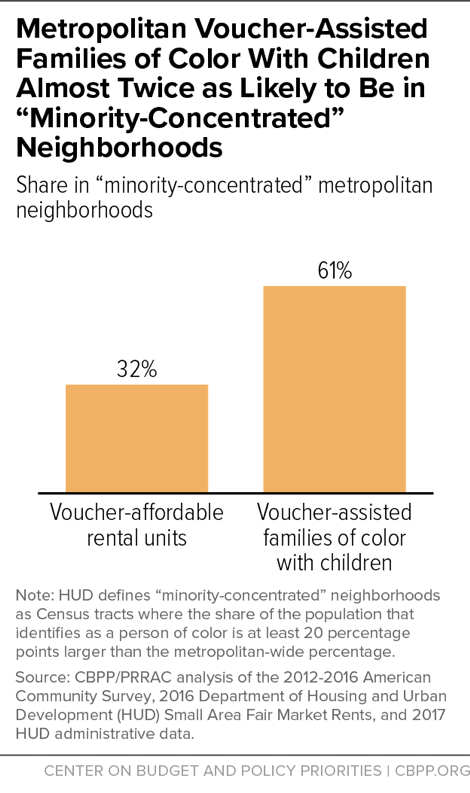
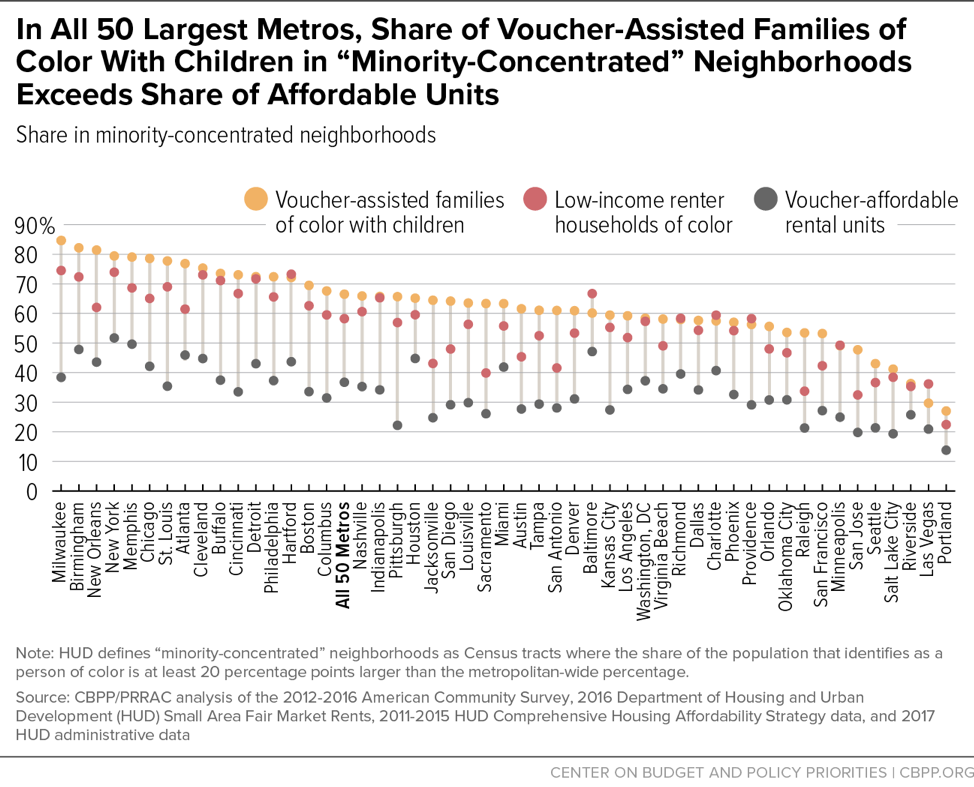
- Share of residents who are people of color. Under the Fair Housing Act, state and local voucher programs are required to administer their programs in a non-discriminatory manner and “to take the type of actions that undo historic patterns of segregation and other types of discrimination and afford access to opportunity that has long been denied.”[5] Yet most families with children using vouchers, including most families of color, live in what HUD terms “minority-concentrated” neighborhoods — neighborhoods with a higher share of black, Hispanic/Latino, Asian, Pacific Islander, or Native American residents than the metro area overall — even though most voucher-affordable units are located elsewhere. Specifically, 61 percent of metropolitan voucher-assisted families of color with children, but only 32 percent of metropolitan voucher-affordable units, are in “minority-concentrated” neighborhoods.[6] The clustering of voucher-assisted families of color in “minority-concentrated” neighborhoods isn’t solely due to existing or historical patterns of residential segregation or racial discrimination in the rental market. In most of the 50 largest metro areas, voucher-assisted families of color are more likely to live in “minority-concentrated” neighborhoods than low-income renters of color overall.
Policymakers, housing agencies, advocates, and civil rights groups can use these findings to better understand how local voucher programs perform relative to the local housing market and identify areas for improvement. Approaches should include investing in the communities where many voucher-assisted families live, as well as increasing access to a wide range of neighborhoods so that families using vouchers have real choices about where to live. Some families[7] want to remain in their current neighborhoods to be close to their relatives, child care, or current job. Other families would like to move to safer neighborhoods with good schools, and much more could be done to ensure that families can use their voucher in a neighborhood of their choosing.
These large metro areas have enough rental units to enable a much greater share of families using vouchers to rent in low-poverty and high-opportunity areas. For example, the number of voucher-affordable rentals in low-poverty neighborhoods alone exceeds the total number of voucher-assisted families in each of the 50 largest metro areas. In metro areas where access to voucher-affordable units in low-poverty, high-opportunity neighborhoods is severely constrained, agencies can set interim goals that include helping more interested families move from neighborhoods with high poverty and little opportunity to ones with more moderate levels of poverty and opportunity.
This paper begins by briefly reviewing research on the effect of neighborhoods on children and families’ well-being and why it’s important to analyze where families with vouchers reside in relation to the local rental market. After a detailed examination of the findings summarized above, it closes with potential areas for further research and implications for program administrators and policymakers. A companion set of interactive tables, charts, and maps provides information on voucher-affordable units and families with children, families of color with children, and all households in the voucher program in the 50 largest metro areas.[8]
Neighborhoods Influence Families’ Well-Being and Long-Term Success
Where families live largely determines the quality of their children’s schools[9] and the safety of the streets and playgrounds. It also can affect adults’ access to jobs,[10] transportation costs to work, access to fresh and reasonably priced food and other basic goods and services, and the distance between child care and jobs.[11]
An emerging body of research finds that living in lower-poverty neighborhoods has important benefits for families, including improved academic performance for children and higher employment and earnings among adults.[12] For instance, moving to a lower-poverty neighborhood while young can sharply increase children’s earnings in adulthood and chances of attending college and can reduce girls’ likelihood of becoming single mothers.[13] Studies have also consistently found that living in high-poverty neighborhoods with low-performing schools and high rates of violent crime harms families’ well-being and children’s long-term outcomes.[14]
Considering these findings, the Housing Choice Voucher program should provide low-income families — particularly those with young children — the chance to live in high-opportunity, lower-poverty neighborhoods, if they wish to do so. Some families want to stay in their current neighborhoods to be near their relatives, child care, or current job. But other families want to move to safer neighborhoods with good schools and diverse neighbors. These families might do so if they had more information, more assistance from program administrators to identify landlords willing to accept vouchers, or if their voucher covered the higher rents typical of lower-poverty, higher-opportunity neighborhoods. Because the Housing Choice Voucher program assists more families with children than the other two major rental assistance programs (public housing and Project-Based Rental Assistance) combined, it has a unique potential to help families move to neighborhoods with low poverty, low crime, and strong schools. [15]
Key Terms
This report uses the following terms to describe neighborhoods:
- Low-poverty neighborhoods have a poverty rate of less than 10 percent.
- High-poverty neighborhoods have a poverty rate of 30 percent or higher.
- High-opportunity neighborhoods score in the top 20 percent for all metropolitan neighborhoods under our composite opportunity index.
- Low-opportunity neighborhoods score in the bottom 20 percent for all metropolitan neighborhoods under our composite opportunity index.
- HUD defines “minority-concentrated” neighborhoods as those where the percentage of people of color is at least 20 percentage points higher than for the entire metro area.
Voucher-Affordable Rental Housing Varies Among Metro Areas
Housing is tied to a place, which means that housing analyses that focus on states or the nation as a whole are not granular enough to capture key differences in local housing markets. Housing markets typically extend well beyond local jurisdictional boundaries and generally correspond to metropolitan areas. Metropolitan areas therefore provide a much better picture of local housing markets and how they are functioning than state or national data alone. Additionally, nearly 90 percent of families using vouchers reside in metropolitan areas, and roughly 60 percent of all families using vouchers live in the 50 largest metro areas.[16]
The availability and location of rental units affordable to voucher recipients — and the location of families that use vouchers — vary considerably among metro areas. Housing voucher subsidies are capped based on a Fair Market Rent that HUD estimates each year for modest housing units in a geographic area. We consider a rental unit to be “voucher-affordable” if its gross rent is below HUD’s Small Area Fair Market Rent (SAFMR) for a modest two-bedroom apartment.[17] We are, to our knowledge, the first to use SAFMRs to compute tract-level estimates of voucher-affordable rentals units. However, the available data do not allow us to limit the number of voucher-affordable units to those with two or more bedrooms. This measure therefore includes some studio and one-bedroom units that would be too small for the typical voucher-assisted family of one parent and two children. It also mostly misses three-bedroom (and larger) units, likely partly offsetting the inclusion of smaller units. (See Appendix 2 for our full methodology.)
Voucher-affordable units may be concentrated in neighborhoods of greater or lesser opportunity due to market or historical dynamics unique to a particular metro area, such as exclusionary zoning, geography, access to public transportation, historical segregation-related policies like redlining, and more.[18] Our analysis finds that voucher-assisted families with children tend to be more clustered in neighborhoods that: (a) score in the bottom 20 percent of our opportunity index, (b) have high poverty rates, or (c) have larger shares of residents who are people of color, relative to voucher-affordable units. These differences are sometimes quite pronounced, depending on the metropolitan area. To help set reasonable expectations for how local voucher programs can do more to give families the chance to move to lower-poverty, higher-opportunity neighborhoods, it’s critical to examine the percentage of voucher-assisted families in a given type of neighborhood and compare that to the underlying affordable rental market.[19]
For example, in some metro areas, voucher-affordable rental units are relatively scarce in low-poverty neighborhoods or disproportionately concentrated in high-poverty neighborhoods. In these metro areas, state and local housing agencies that administer the voucher program may find it more difficult to help interested families move to low-poverty areas. Conversely, in metropolitan areas with more voucher-affordable units in low-poverty neighborhoods, agencies may find it easier to assist families wishing to move to these areas.
Across metropolitan areas nationally, a quarter of voucher-affordable rentals are in low-poverty neighborhoods. But the share varies considerably among individual metro areas, from 12 percent in the Riverside (CA) metro area to 54 percent in the San Jose (CA) metro area.[20] At the other end of the spectrum, a little over one-fifth of all metropolitan voucher-affordable units are in high-poverty neighborhoods. However, among the 50 largest metro areas, the range spans from just 2 percent in the San Jose metro area to 44 percent in the Memphis metro area. As discussed later in this report, metropolitan areas show similar diversity in the location of voucher-affordable units when examining other neighborhood characteristics, like opportunity and the share of residents who are people of color. (Visit our interactive map to compare the location of voucher recipients and voucher-affordable units in the 50 largest metropolitan areas.)
Poverty Rate
Growing up in safe, low-poverty neighborhoods with good schools improves children’s academic achievement and long-term chances of success.[21] Yet few metropolitan voucher-assisted families with children live in low-poverty neighborhoods — fewer than one would expect given the supply of rental units in those neighborhoods that are affordable to voucher holders. Also, 1 in 3 metropolitan families using vouchers live in high-poverty areas — more than one would expect given the share of voucher-affordable units in those neighborhoods — which may expose them to more violent crime and worse-performing schools.[22]
Few Metropolitan Families Using Vouchers Live in Low-Poverty Neighborhoods, Despite the Presence of Affordable Units
Just 14 percent of all metropolitan voucher-assisted families with children — 123,000 households — live in low-poverty neighborhoods. The share varies considerably by location, ranging from 4 percent in the New Orleans metro area to 45 percent in the Washington, D.C. metro area (see Figure 1). (See Appendix 1 and our interactive web tables for data on additional neighborhood measures.)
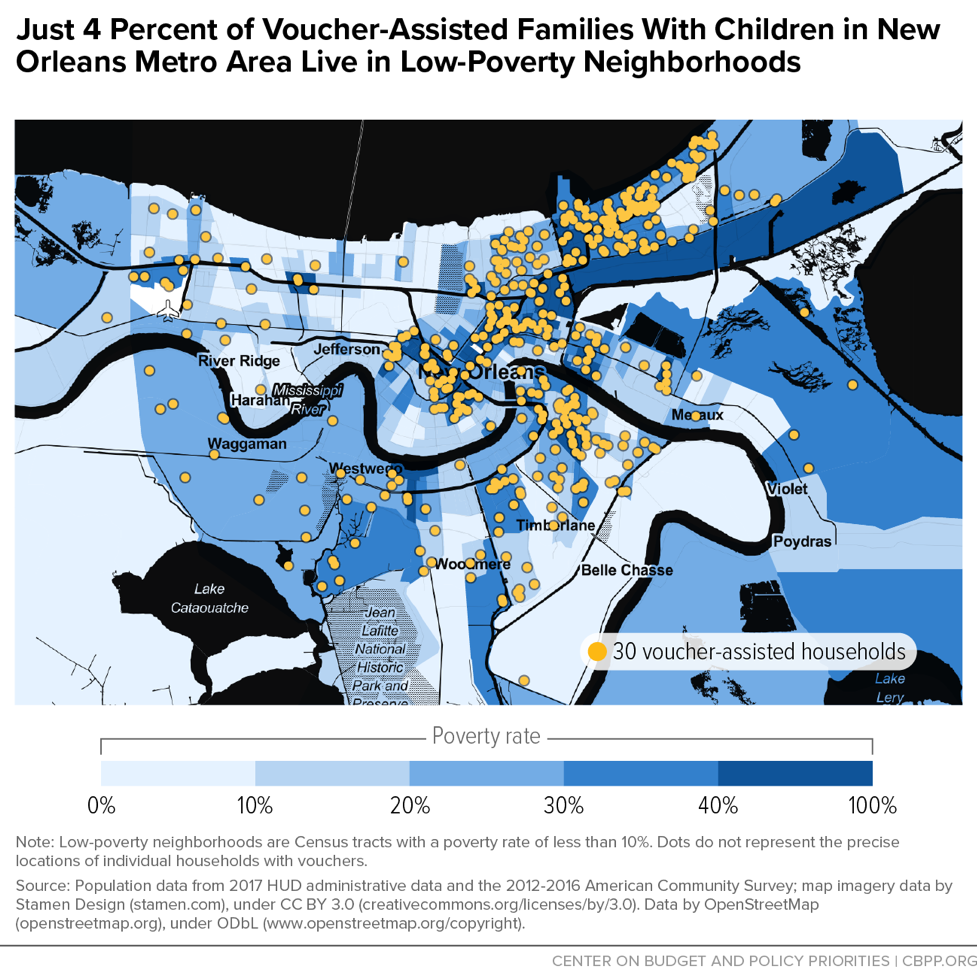
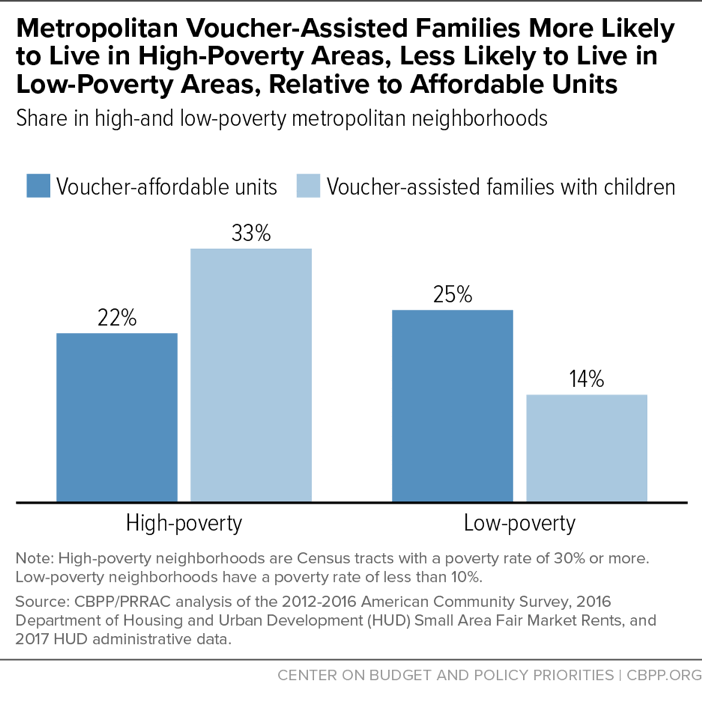
In contrast, 25 percent of all metropolitan voucher-affordable rental units — over 4.8 million units — are in low-poverty neighborhoods. That’s almost twice the share of voucher-assisted families with children living in those neighborhoods (see Figure 4). Thus, the small share of families using vouchers in low-poverty neighborhoods is not primarily due to lack of affordable units.
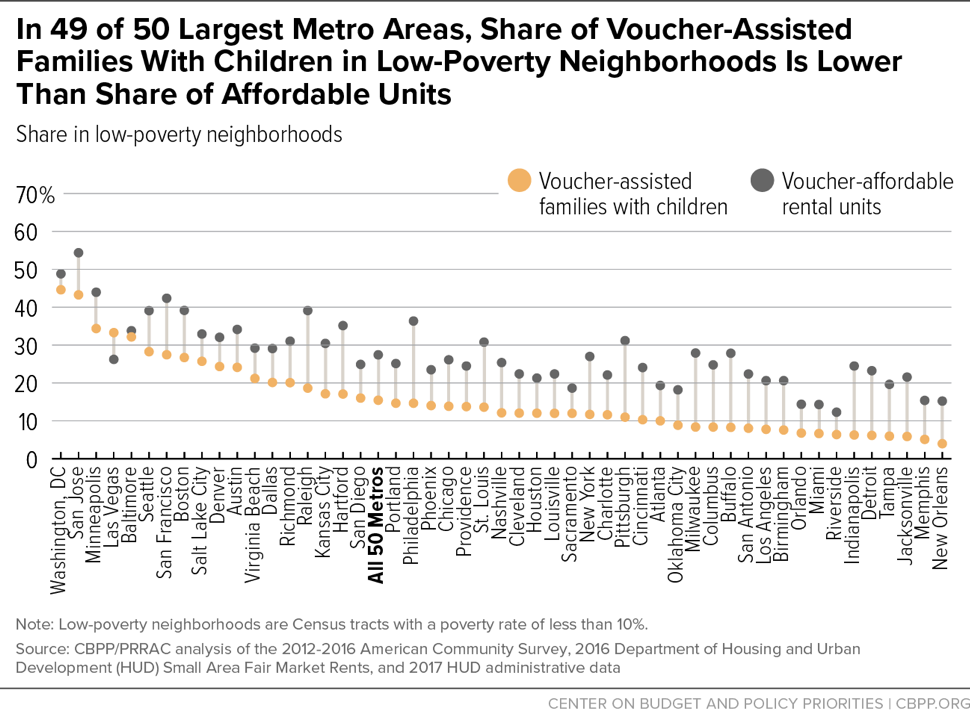
If the distribution of families using vouchers simply reflected the distribution of affordable units in the metropolitan housing market, the proportion of voucher-assisted families with children in low-poverty neighborhoods would be roughly the same as the proportion of voucher-affordable units. Instead, in 49 of the 50 largest metro areas, families using vouchers are less likely to be in low-poverty neighborhoods than voucher-affordable units are, sometimes considerably so (see Figure 2).[23]
In some metro areas, families using vouchers access low-poverty neighborhoods at similar rates to the rental market. For example, nearly one-third of metropolitan Baltimore voucher-assisted families with children live in low-poverty neighborhoods, a figure in line with the local distribution of voucher-affordable rentals.[24] And in the Las Vegas metro area, the share of voucher-assisted families living in low-poverty areas exceeds the share of voucher-affordable units in these areas (see Figure 2). We discuss possible reasons for these differences in the Areas for Further Research section below.
Many Metropolitan Families Using Vouchers Live in High-Poverty Neighborhoods, Even Though Most Voucher-Affordable Units Are in Lower-Poverty Areas
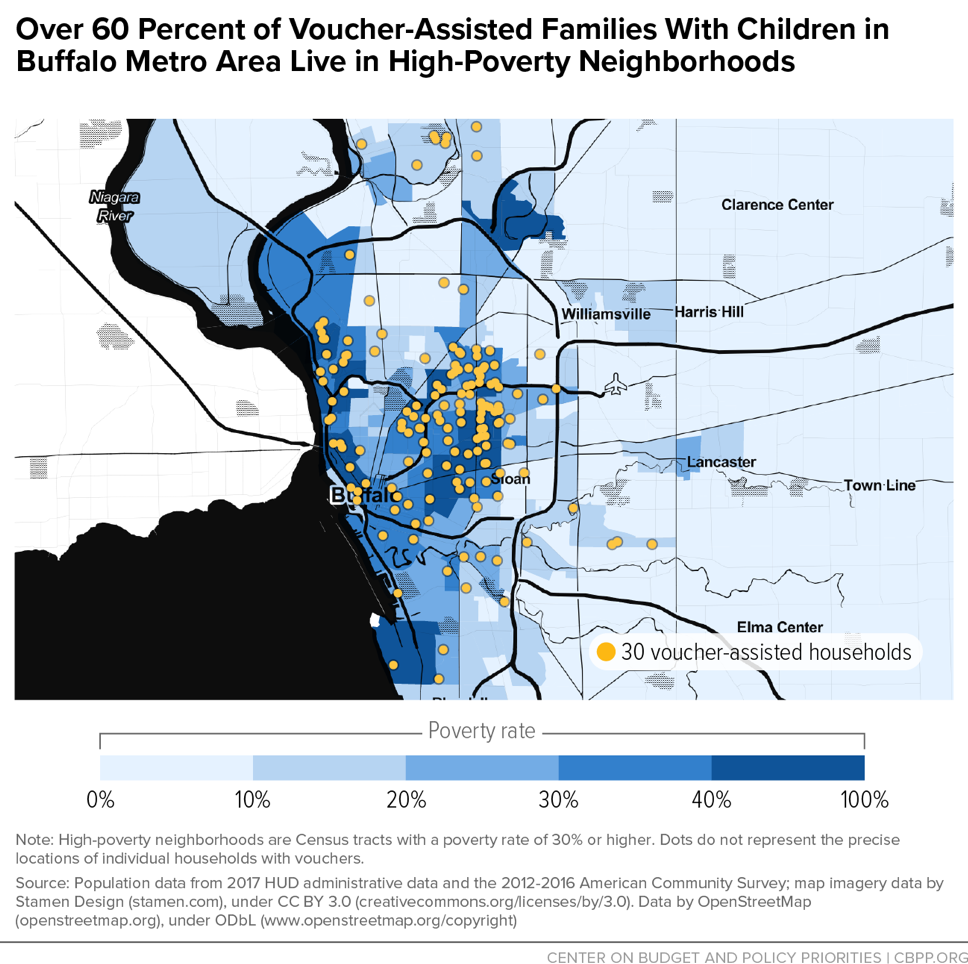
Nationally, 33 percent of metropolitan voucher-assisted families with children — 290,000 households — live in high-poverty neighborhoods.[25] The share varies considerably among the 50 largest metro areas, from 1 percent in the San Jose metro area to 61 percent in the Buffalo metro area (see Figure 3).
The large share of families using vouchers in high-poverty neighborhoods doesn’t primarily reflect a lack of affordable units in other neighborhoods; in fact, voucher-affordable units aren’t especially concentrated in high-poverty metropolitan neighborhoods. Only 22 percent of metropolitan voucher-affordable rentals are in high-poverty neighborhoods (see Figure 4), yet 33 percent of voucher-assisted families with children live in these neighborhoods.
In fact, in 44 of the 50 largest metro areas, the share of voucher-assisted families with children living in high-poverty neighborhoods exceeds — sometimes considerably so — the share of voucher-affordable units in these neighborhoods (see Figure 5). In metro areas like Buffalo or New Orleans, the share of families using vouchers in high-poverty neighborhoods is much larger than the share of voucher-affordable units; in other metropolitan areas, like Cleveland, the gap between the two shares is small. In some metro areas, local patterns of racial segregation and past and present discriminatory policies are likely driving higher concentrations of voucher-affordable units in high poverty neighborhoods than would otherwise be the case.
Opportunity Index
While neighborhood poverty can significantly affect a family’s well-being, other important neighborhood characteristics can also affect families’ and children’s success. Examples include educational attainment, employment, marriage status, housing conditions, school quality, availability of services and resources, and incidence of crime.[26] Poverty rates are often used as a proxy for neighborhood opportunity because poverty is more easily measured and tends to be correlated with other neighborhood attributes related to opportunity. But researchers, recognizing that neighborhood poverty rates are only a rough and sometimes inadequate stand-in for a variety of conditions that affect social mobility, have begun developing composite opportunity measures designed to better capture the myriad social and environmental characteristics that shape a person’s chances for success.
In 2016, HUD released several neighborhood opportunity indices to help local governments and housing agencies identify high-opportunity neighborhoods and meet their obligation to affirmatively further the goals and requirements of the Fair Housing Act of 1968. These multifaceted measures cover several predictors of upward economic mobility, including neighborhood poverty as well as access to good schools, jobs, and public transportation. We combine five of these HUD indices to create a comprehensive composite index of opportunity that considers school quality, poverty, labor market engagement, access to jobs, and access to transit. (For more on our opportunity index, see the methodology in Appendix 2.)
While opportunity measures are becoming more widely used, researchers are still debating what constitutes a “high-opportunity” neighborhood and how to appropriately measure opportunity given limited data.[27] Our index is a good starting point and illustrates how an opportunity measure can expand upon the poverty measure.[28] In our analysis, 80 percent of all high-opportunity metropolitan neighborhoods also have poverty rates below 10 percent, indicating a high degree of agreement between the high-opportunity and low-poverty measures. However, only 42 percent of low-opportunity neighborhoods also have poverty rates that are 30 percent or greater. This means that our index considers a substantial number of neighborhoods with low-to-moderate poverty rates to be “low-opportunity” because they have poorly performing schools, low labor market participation, or are far from employment opportunities and public transit.
Our analysis finds that very few voucher-assisted families with children live in high-opportunity areas — fewer than one would expect given the local distribution of voucher-affordable units in these metro areas. Also, 4 in 10 families using vouchers reside in low-opportunity neighborhoods, nearly twice the rate one would expect given the local rental market.
Few Metropolitan Families Using Vouchers Live in High-Opportunity Neighborhoods, Despite the Presence of Voucher-Affordable Units
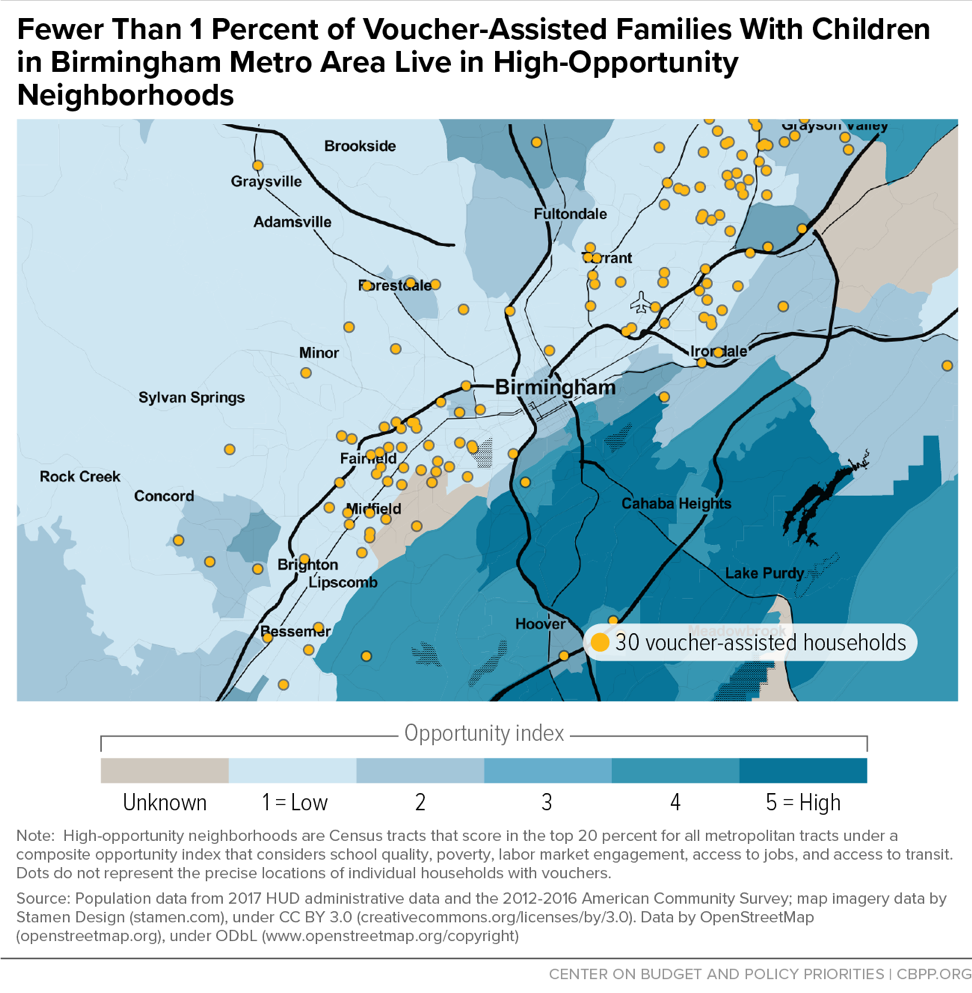
Just 5 percent of all metropolitan voucher-assisted families with children — fewer than 45,000 households — live in high-opportunity neighborhoods, and the share is even smaller in most of the 50 largest metro areas (see Figure 9). In the Birmingham, Jacksonville, Nashville, Oklahoma City, and Riverside metro areas, the share is effectively zero, even though they all have high-opportunity neighborhoods with voucher-affordable rentals (see Figure 6). Even in the Washington, D.C. metro area, which has the highest share of families with vouchers living in high-opportunity neighborhoods in our analysis, only 27 percent of families using vouchers live in such neighborhoods.
Although few voucher-assisted families with children live in high-opportunity neighborhoods, most large metro areas in our analysis have enough voucher-affordable units in these areas to make such moves possible for a greater share of families. Eighteen percent of all metropolitan voucher-affordable rentals — about 3.4 million units — are in high-opportunity neighborhoods. Thus, voucher-affordable rentals are over three times as likely to be in high-opportunity areas as voucher-assisted families with children (see Figure 9).
As with neighborhood poverty, the location of voucher-assisted families with children doesn’t reflect the local rental market in high-opportunity areas. In every one of the 50 largest metro areas, the share of families using vouchers in high-opportunity neighborhoods is smaller than the share of voucher-affordable units in such neighborhoods (see Figure 7). Some metro areas, such as Seattle or San Jose, have a considerable share of voucher-affordable rental units in high-opportunity areas, but the share is quite small in metro areas like Riverside and Oklahoma City (see Figure 7).
Even if the supply of voucher-affordable units with two or more bedrooms in high-opportunity areas is somewhat lower than shown here due to data limitations, the size of these gaps in most places suggests that there is enough supply to allow more voucher-assisted families to live there.
Many Metropolitan Families Using Vouchers Live in Low-Opportunity Neighborhoods, Nearly Double the Share of Voucher-Affordable Units in These Areas
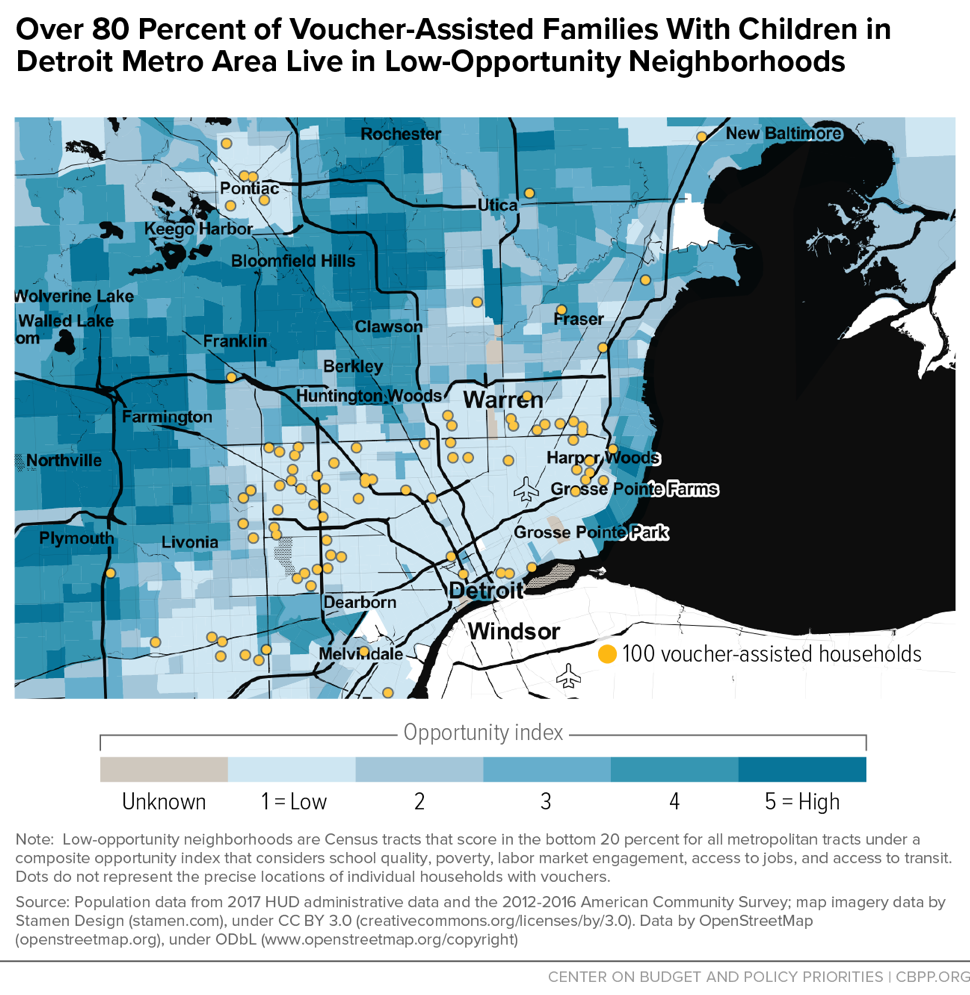
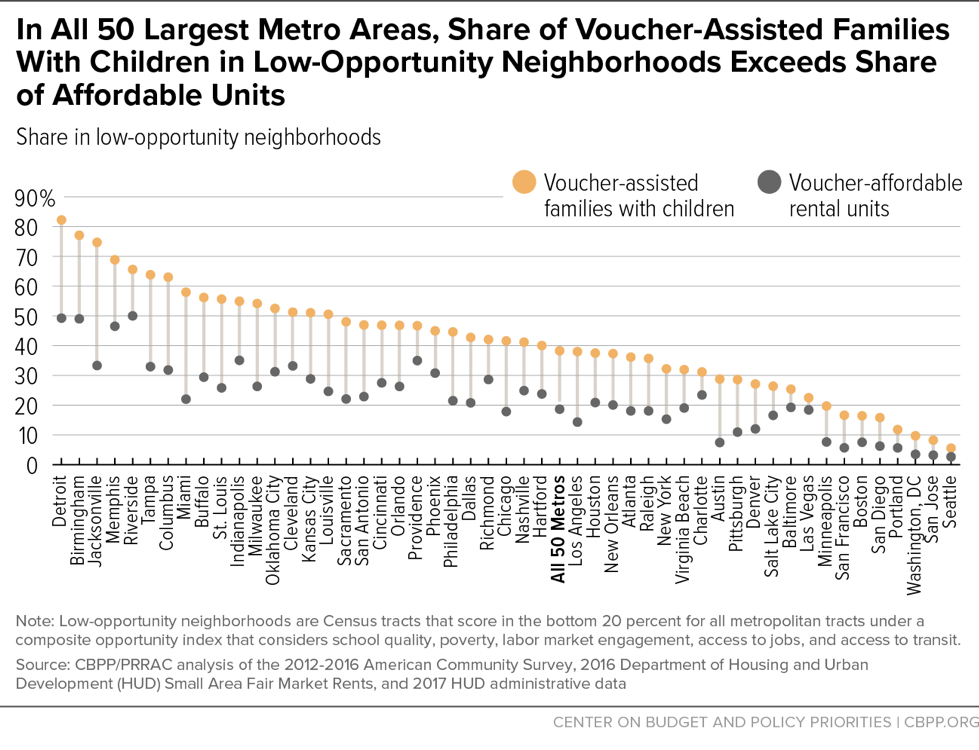
Fully 40 percent of all metropolitan voucher-assisted families with children — nearly 340,000 households — live in low-opportunity neighborhoods, and the share is considerably higher in many of the 50 largest metro areas. In the Detroit metro, for example, it’s a staggering 82 percent (see Figure 8). At the other end of the spectrum, just 6 percent of metropolitan Seattle families using vouchers live in low-opportunity areas.
Compared to families using vouchers, a substantially smaller share of all metropolitan voucher-affordable units — 21 percent — are in low-opportunity neighborhoods (see Figure 9). Thus, voucher-assisted families with children are almost twice as likely as voucher-affordable units to be in these types of neighborhoods. Given these large differences, the voucher program may be disproportionately concentrating families in low-opportunity areas compared with the rental supply.
Indeed, in each of the 50 largest metro areas, the share of voucher-assisted families with children in low-opportunity neighborhoods exceeds the share of voucher-affordable units in these neighborhoods (see Figure 10). Many West Coast metro areas, including Seattle, San Jose, and Portland, have small shares of both voucher-affordable units and families using vouchers in low-opportunity neighborhoods. However, in other metro areas, especially Jacksonville and Miami, the share of families using vouchers in low-opportunity neighborhoods far exceeds the share of voucher-affordable units in those neighborhoods.
Share of Residents Who Are People of Color
Public housing agencies administering the voucher program have an obligation to further the purposes of the Fair Housing Act, which prohibits discrimination in the housing market based on race, religion, sex, disability, family status (including presence of children), or national origin. It also requires states and localities receiving HUD funds, as well as public housing agencies, to actively address and work to eliminate housing discrimination and segregation for all the populations protected by the legislation. This statutory obligation, known as “Affirmatively Furthering Fair Housing,” remains in effect despite HUD’s recent suspension of regulatory requirements that housing agencies (and others) identify barriers to fair housing in their regions and take steps to overcome them.[29]
Most metropolitan voucher-assisted families with children live in neighborhoods that HUD terms “minority-concentrated,” meaning the share of people that identify as a person of color is at least 20 percentage points higher than the share for the metro area as a whole. Voucher-assisted families of color — the population for whom living in “minority-concentrated” neighborhoods represents a potential fair housing issue — are even likelier to live in these neighborhoods. But even in metro areas with extremely concentrated voucher-assisted families of color, most voucher-affordable units are located outside of “minority-concentrated” neighborhoods.
Moreover, metropolitan voucher-assisted families of color live in “minority-concentrated” neighborhoods at higher rates than other low-income renters of color.[30] This suggests that the voucher program is not merely reflecting existing patterns of residential segregation driven by past and present discriminatory policies or racial discrimination in the rental market. Instead of furthering the goals of the Fair Housing Act, state and local voucher programs may be contributing to the clustering of families of color in certain neighborhoods, potentially perpetuating or exacerbating existing patterns of racial and ethnic residential segregation.
Most Families of Color Using Vouchers Live in “Minority-Concentrated” Neighborhoods, Even Though Most Voucher-Affordable Units Are Elsewhere
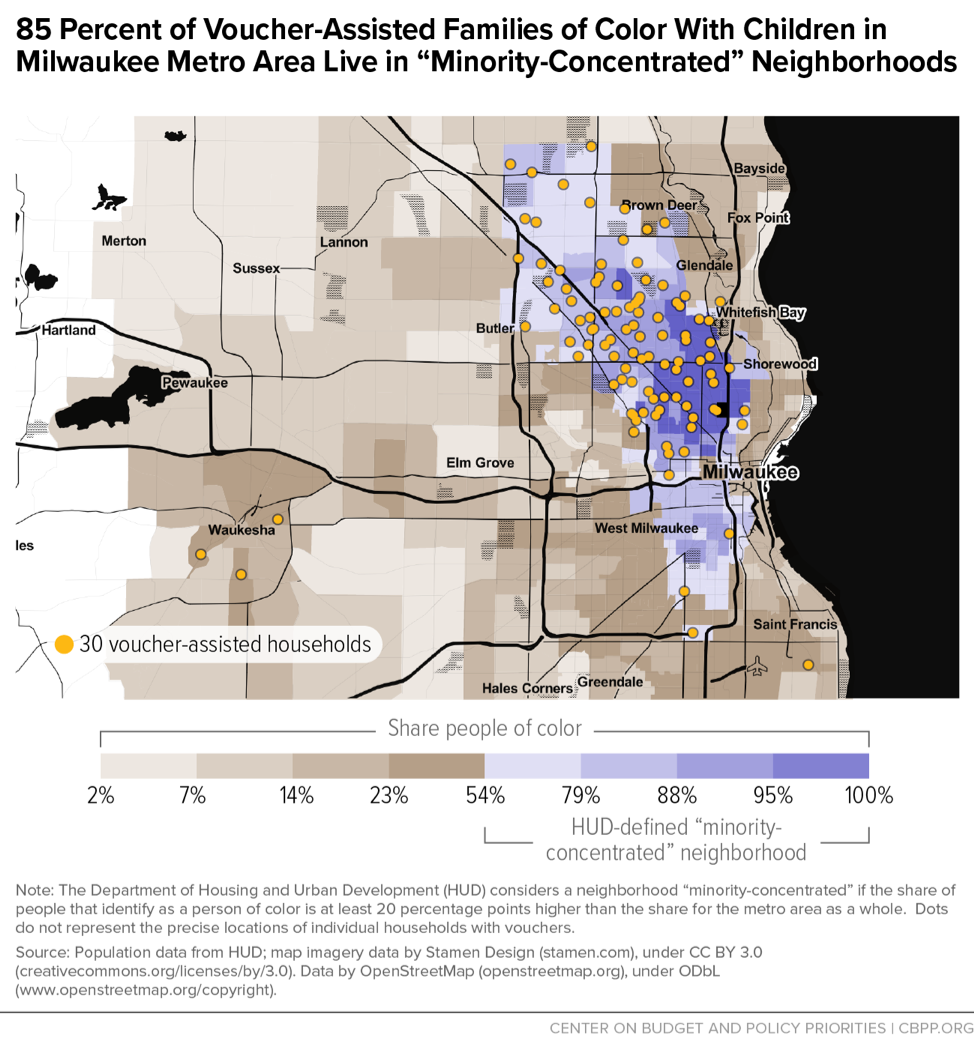
Sixty-one percent of metropolitan voucher-assisted families of color with children — roughly 433,000 households — live in neighborhoods HUD defines as “minority-concentrated” (see Figure 12), compared to 19 percent of white, non-Hispanic families using vouchers.[31] In metro areas like Milwaukee, Birmingham, and New Orleans, over 80 percent of families of color using vouchers live in such neighborhoods (see Figure 11). At the other end of the spectrum, 27 percent of metropolitan Portland families of color using vouchers live in “minority-concentrated” areas.
Metropolitan voucher-assisted families of color live in “minority-concentrated” neighborhoods at noticeably higher rates than would be expected given the local rental market. Thirty-two percent of metropolitan voucher-affordable units are in “minority-concentrated” neighborhoods (see Figure 12). Thus, families of color using vouchers are almost twice as likely as voucher-affordable units to be in these areas. In 49 of the 50 largest metro areas, most voucher-affordable units are located outside “minority-concentrated” neighborhoods.
Families of Color Using Vouchers Are More Likely to Live in “Minority-Concentrated” Neighborhoods Than Low-Income Renters of Color Overall
The clustering of metropolitan voucher-assisted families of color with children in “minority-concentrated” neighborhoods isn’t solely due to patterns of residential segregation or racial discrimination in the rental market. In 43 of the 50 largest metropolitan areas, the share of families of color using vouchers in “minority-concentrated” neighborhoods exceeds the share of low-income renters of color overall in these neighborhoods (see Figure 13).[32]
Local voucher programs may be driving up the share of people of color in “minority-concentrated” neighborhoods of some of the largest metro areas. This suggests that, in many areas, the voucher program has not complied with its obligation to reduce segregation and expand access to opportunity. For instance, in the New Orleans metro area, over 80 percent of families of color using vouchers live in “minority-concentrated” neighborhoods, compared to 62 percent of all low-income New Orleans renters of color. In other metro areas, like Indianapolis, Minneapolis, and Riverside, the voucher program appears to be largely perpetuating existing residential patterns, as there is little difference in the location of families of color using vouchers and all low-income renters of color. In the Baltimore, Charlotte, Hartford, Las Vegas, and Providence metro areas, however, families of color using vouchers appear to be less likely to live in “minority-concentrated” neighborhoods than all low-income renters of color (see Figure 13).
Further Research Needed to Understand Differences Among Metro Areas
In some metropolitan areas, voucher-assisted families with children are distributed similarly to voucher-affordable housing. But in other metro areas, these families are disproportionately clustered in high-poverty, low-opportunity, or “minority-concentrated” neighborhoods. Further research is needed to understand what causes these differences, particularly around the role of rental vacancy rates, landlord discrimination,[33] current and historical patterns of residential segregation, and public housing agencies’ policies and practices.[34]
We explored several theories that might explain the differences we found among large metropolitan areas, but we weren’t able to draw definitive conclusions with the available data. For instance, a lower rental vacancy rate might make it harder for voucher recipients to rent in lower- poverty or higher-opportunity areas, since the greater competition from other renters gives landlords more choice among tenants. Conversely, a higher rental vacancy rate might make it easier to rent in lower-poverty or higher-opportunity areas, due to landlords’ greater willingness to accept vouchers. However, we found only a weak association between higher rental vacancy rates and the alignment of voucher-assisted families with children and voucher-affordable units across the 50 largest metro areas.
The number of housing agencies administering a metro area’s voucher program might also explain the differences among metro areas in our analysis. A larger number of agencies can hinder voucher recipients from living where they choose, particularly when lower-poverty or higher-opportunity neighborhoods aren’t evenly distributed among jurisdictions.[35] Las Vegas is the only large metropolitan area in our analysis that has a single agency administering the program for the entire metropolitan area. This may help explain why families using vouchers in the Las Vegas metro area are more likely to live in low-poverty neighborhoods, and less likely to live in high-poverty neighborhoods, relative to the location of voucher-affordable units. However, when looking at all 50 largest metro areas, we again find only a weak association between the number of metro-area voucher agencies and the alignment of families using vouchers and voucher-affordable units.
We did find some broad regional trends among metropolitan areas. Metropolitan areas in the Northeast and Midwest, particularly in the Mid-Atlantic and eastern Midwest states, are more likely to have large differences between the location of families using vouchers and voucher-affordable housing in high- and low-poverty neighborhoods. The Northeast and Midwest have tended to be more racially segregated than the South and West in recent decades, which could be contributing to these differences, but further research is needed to better understand these regional trends.[36] We didn’t find clear regional patterns when looking at high- and low-opportunity neighborhoods.
Local programmatic differences may better explain the variation among metropolitan areas. For example, some metro areas have programs that provide intensive mobility assistance to families that want to move to lower-poverty, higher-opportunity neighborhoods. The Baltimore Housing Mobility Program has helped more than 4,000 households, largely families with children, move to, and remain in, target “opportunity” neighborhoods throughout the metro area.[37] This may help explain why 32 percent of families using vouchers in the Baltimore metro area live in low-poverty neighborhoods and 22 percent live in high-opportunity neighborhoods — shares that are higher than in most large metro areas and roughly in line with the local distribution of voucher-affordable units.
We couldn’t examine other housing agency policies and practices that might affect where families use their vouchers, or the extent of landlord discrimination, due to lack of available data. A new study of landlord discrimination in five cities finds that many landlords don’t accept vouchers and that voucher refusal rates are highest in low-poverty neighborhoods. It also finds, however, that landlords are more likely to accept vouchers in areas with state or local laws prohibiting discrimination against voucher holders and when housing agencies use higher payment standards, thereby increasing the value of the voucher.[38] These areas are ripe for more exploration in future analyses.
Implications for Voucher Program Administration
These data strongly suggest that state and local voucher programs can do significantly more to give voucher-assisted families genuine choice about where they live. Our analysis finds that families with vouchers in most of the 50 largest metro areas live in less opportunity-rich neighborhoods than the local rental market would appear to make possible.
While we largely focus on comparing shares and percentages, it’s important to underscore that the voucher program only serves about 560,000 families with children in the 50 largest metro areas and 870,000 metropolitan families total. These large metro areas have enough rental units to enable a much greater share of families using vouchers to rent in low-poverty and high-opportunity areas. As noted, in each of the 50 largest metro areas, the total number of voucher-affordable rentals in low-poverty neighborhoods alone exceeds the total number of voucher-assisted families in those metro areas. And in 46 of the 50 largest metro areas, the number of voucher-affordable rentals in high-opportunity neighborhoods alone exceeds the total number of voucher-assisted families in those metro areas. In the Louisville metro area, for example, there are about 5,000 families with children using vouchers but nearly 20,000 voucher-affordable units in low-poverty neighborhoods and 11,000 voucher-affordable units in high-opportunity neighborhoods.
Of course, other families compete with voucher holders for these units, and not all voucher-affordable units are the right size for a family with children. However, the small number of voucher-assisted families relative to affordable rental units means that state and local voucher program administrators in all types of metro areas could likely increase access to low-poverty and high-opportunity neighborhoods for families that wish to move. Housing agencies administering the voucher program can use this analysis to better understand their local rental market, set goals for improvement, and implement best practices.
Advance Fair Housing Act Goals
State and local voucher programs should comply with their obligations under the Fair Housing Act, and, in doing so, increase families’ access to low-poverty, high-opportunity neighborhoods as well. In most of the 50 largest metro areas, families of color using vouchers are more likely to be in “minority-concentrated” neighborhoods than other low-income renters of color. Living in a neighborhood with a large population of persons of color is not problematic in and of itself. Indeed, there are high-opportunity, low-poverty neighborhoods that also meet HUD’s criteria for “minority-concentrated.”[39] However, discriminatory public policies, such as redlining, and race-based covenants have created racially segregated metropolitan areas and disproportionately concentrated people of color into high-poverty, low-opportunity neighborhoods. Nearly 80 percent of metropolitan neighborhoods that meet our criteria for high poverty and low opportunity also meet HUD’s definition of “minority-concentrated.”
While HUD recently announced plans to reconsider its 2015 Affirmatively Furthering Fair Housing (AFFH) rule, which would have required localities, including public housing agencies, to submit an assessment of barriers to fair housing and set plans to overcome them, housing agencies remain legally obligated to further fair housing goals. Indeed, agencies that fail to take reasonable steps within their control may be found to have falsely claimed that they are complying with civil rights requirements.[40] Renters of color already face segregation and discrimination in the housing market; the voucher program should not exacerbate or perpetuate these patterns. Instead, agencies should strive to give voucher-assisted families of color meaningful choices about where to live.
Implement a Housing Mobility Program
Given that growing up in high-poverty, low-opportunity areas can hurt children’s chances for long-term success and that people of color are often unduly concentrated in these neighborhoods, housing agencies should try to remove barriers that families — especially families of color — face when trying to gain access to lower-poverty, higher-opportunity neighborhoods, which tend to be predominantly white. In the near term, this could include establishing a regional mobility program that helps interested families use vouchers to move to lower-poverty, higher-opportunity neighborhoods.
Agencies seeking to help interested families move to such neighborhoods could aim to get the share of families using vouchers in those neighborhoods to match (or, in the short term, more closely match) that of voucher-affordable units. This approach may be useful for program administrators in metro areas like Philadelphia or Raleigh, where there are sizable shares of voucher-affordable units in low-poverty, high-opportunity areas but few voucher-assisted families with children live in those neighborhoods. However, in other metro areas, voucher-affordable units are relatively scarce in low-poverty or high-opportunity neighborhoods. In metro areas like Riverside (California) or Orlando, if the voucher program simply matches the local housing market, very few interested families will have the chance to move to lower-poverty, higher-opportunity neighborhoods (see Figures 2 and 7). Agencies in those metro areas should try to do better than the local rental market, as in the Las Vegas metro area (see Figure 2).
In metro areas with little supply of voucher-affordable units in low-poverty, high-opportunity neighborhoods, agencies can set interim goals that include helping more families who wish to move from such neighborhoods to one with more moderate levels of poverty and opportunity to do so. Research suggests that neighborhood poverty rates of 15-20 percent are a tipping point — that is, the point at which social problems associated with neighborhood poverty often begin to appear.[41] Agencies in more constrained housing markets could set an interim goal of helping interested families move to neighborhoods with poverty rates below 15 percent while pursuing strategies that increase the supply of voucher-affordable units in low-poverty, high-opportunity areas.[42]
Expand the Available Supply of Voucher-Affordable Units
Increasing the supply of affordable housing in low-poverty, high-opportunity neighborhoods requires concerted effort across multiple levels of government and various agencies. Housing authorities that operate the voucher program cannot, on their own, solve the problems of inadequate supply of affordable units, their location, or segregation.
However, housing agencies can, on their own, take some steps to increase the availability of voucher-affordable units in low-poverty, high-opportunity neighborhoods through robust landlord recruitment in those neighborhoods and adjusting subsidy levels based on Small Area Fair Market Rents, thereby raising the maximum voucher subsidy in more expensive neighborhoods.[43] SAFMRs increase the number of voucher-affordable units in high-rent zip codes and help families move to higher-opportunity neighborhoods, research shows.[44] In addition, housing agencies could do more to connect families to Low-Income Housing Tax Credit (LIHTC) properties in low-poverty, high-opportunity neighborhoods. Under federal law, LIHTC owners must not discriminate against voucher holders, and agencies should inform families of where these properties are located.[45]
Implications for Public Policymakers
In addition to these best practices for voucher program administrators, federal, state, and local policymakers could also do much more to improve access to lower-poverty, higher-opportunity neighborhoods for families with children in the voucher program, particularly by providing funding or other incentives to support some of the activities described above.
Establish and Fund the Housing Choice Voucher Mobility Demonstration
Congress should establish and fund the House-approved Housing Choice Voucher Mobility Demonstration, which would allow selected public housing agencies to provide robust housing mobility services — including pre- and post-move support (such as financial coaching) for voucher holders who want to move to a higher-opportunity area, outreach to landlords to recruit more of them to participate, and housing search assistance — to help more families that wish to move to higher-opportunity neighborhoods.
Improve and Enforce HUD Policies That Promote Housing Choice
HUD can take steps to encourage housing agencies to help more interested families move to high- opportunity, low-poverty neighborhoods. HUD could do this by rewarding agencies that help families move to high-opportunity areas (by paying these agencies additional administrative fees) and by giving added weight to location outcomes in measuring agency performance.
HUD should also encourage more agencies to implement Small Area Fair Market Rents, which better reflect actual market rents and help ensure that voucher subsidies are high enough for families to rent in neighborhoods with low poverty, low crime, and strong schools. HUD should also enforce requirements that agencies identify units in higher-opportunity, lower-poverty communities willing to rent to voucher holders and encourage or require agencies to give families seeking to make such moves added time to search for housing. Finally, HUD should encourage agencies in the same metropolitan area to unify their program operations, making it easier for families to rent in a wide range of communities across a metro area.[46]
Implement the Affirmatively Furthering Fair Housing Rule
Issued in 2015, the AFFH rule was HUD’s first substantive effort in the 47 years after enactment of the Fair Housing Act to ensure that states and localities receiving HUD funds — as well as public housing agencies — take meaningful steps to address racial segregation and other fair housing problems. Many communities welcomed the rule and have taken steps toward achieving its goals. But in 2018, HUD announced that it intends to reconsider the rule, the Trump Administration’s third action to undermine AFFH. Rather than further delay implementation of this rule, HUD should rescind its recent announcement and enforce the statutory obligation to affirmatively further fair housing.
Expand the Supply of Voucher-Affordable Housing
State and local policymakers can also take steps to improve their local voucher programs on their own, and advocates should encourage them to do so. For example, some communities need to increase the supply of voucher-affordable housing in high-opportunity and low-poverty neighborhoods, as noted above. Working together, the LIHTC and voucher programs can help accomplish this goal: LIHTC can be used to develop new rental housing in these types of neighborhoods, which will usually (though not always) have rents that are accessible to families using vouchers. In addition, federal law prohibits LIHTC owners from discriminating against voucher holders, though states should do more to ensure that the law is enforced.[47] Federal policymakers could help by prohibiting beneficiaries of other federal programs, such as federally guaranteed mortgages, from discriminating against voucher holders.
Invest in Communities Where Families Using Vouchers Already Live
Policymakers must also act to preserve affordable housing in gentrifying communities and improve neighborhoods where families using vouchers already live. As part of a longer-term strategy, they should invest in programs that increase incomes, enhance safety, and improve educational performance in high-poverty, low-opportunity neighborhoods and in communities of color, thereby improving the places where many families using vouchers will continue to want to live.
The interactive data tables, charts, and maps accompanying this analysis have more information on the location of voucher-affordable units and families with children, families with children of color, and all households using vouchers in the 50 largest metro areas.
Appendix 1: Metropolitan Area Tables
| TABLE A-5 | |||||||
|---|---|---|---|---|---|---|---|
| Share of Voucher-Affordable Units, Low-Income Renters of Color, and Voucher-Assisted Families of Color in “Minority-Concentrated” Neighborhoods | |||||||
| Voucher-Affordable Units | Low-Income Renter Households of Color | Voucher-Assisted Families of Color with Children | |||||
| Metropolitan Area | Total Units | % in “Minority-Concentrated” Areas | Total Households | % in “Minority-Concentrated” Areas | Total Units | % in “Minority-Concentrated” Areas | Neighborhoods That Are “Minority-Concentrated” |
| Atlanta-Sandy Springs-Roswell, GA | 303,080 | 46% | 312,230 | 61% | 17,720 | 77% | 32% |
| Austin-Round Rock, TX | 152,620 | 28% | 94,600 | 45% | 3,020 | 62% | 21% |
| Baltimore-Columbia-Towson, MD | 170,140 | 47% | 135,970 | 67% | 10,860 | 60% | 30% |
| Birmingham-Hoover, AL | 65,160 | 48% | 52,410 | 72% | 4,610 | 82% | 32% |
| Boston-Cambridge-Newton, MA-NH | 410,930 | 34% | 184,020 | 63% | 15,250 | 69% | 21% |
| Buffalo-Cheektowaga-Niagara Falls, NY | 79,930 | 37% | 45,310 | 71% | 4,650 | 74% | 24% |
| Charlotte-Concord-Gastonia, NC-SC | 125,240 | 41% | 109,840 | 59% | 6,140 | 57% | 26% |
| Chicago-Naperville-Elgin, IL-IN-WI | 657,560 | 42% | 518,910 | 65% | 32,820 | 79% | 34% |
| Cincinnati, OH-KY-IN | 142,620 | 34% | 73,890 | 67% | 7,320 | 73% | 21% |
| Cleveland-Elyria, OH | 148,600 | 45% | 107,230 | 73% | 8,240 | 75% | 34% |
| Columbus, OH | 132,580 | 31% | 75,210 | 60% | 5,510 | 68% | 21% |
| Dallas-Fort Worth-Arlington, TX | 482,740 | 34% | 379,650 | 54% | 20,100 | 58% | 28% |
| Denver-Aurora-Lakewood, CO | 199,250 | 31% | 110,400 | 53% | 5,510 | 61% | 20% |
| Detroit-Warren-Dearborn, MI | 244,180 | 43% | 186,450 | 72% | 10,230 | 72% | 30% |
| Hartford-West Hartford-East Hartford, CT | 91,990 | 44% | 55,750 | 73% | 5,140 | 72% | 26% |
| Houston-The Woodlands-Sugar Land, TX | 411,470 | 45% | 395,710 | 60% | 14,420 | 65% | 35% |
| Indianapolis-Carmel-Anderson, IN | 117,020 | 34% | 76,190 | 65% | 4,440 | 66% | 25% |
| Jacksonville, FL | 86,160 | 25% | 57,100 | 43% | 4,130 | 64% | 19% |
| Kansas City, MO-KS | 120,950 | 27% | 75,900 | 55% | 5,470 | 59% | 24% |
| Las Vegas-Henderson-Paradise, NV | 171,870 | 21% | 111,860 | 36% | 5,440 | 30% | 17% |
| Los Angeles-Long Beach-Anaheim, CA | 1,391,070 | 34% | 1,083,960 | 52% | 27,570 | 59% | 33% |
| Louisville/Jefferson County, KY-IN | 89,240 | 30% | 45,070 | 56% | 3,670 | 64% | 17% |
| Memphis, TN-MS-AR | 82,490 | 50% | 93,400 | 69% | 6,080 | 79% | 41% |
| Miami-Fort Lauderdale-West Palm Beach, FL | 427,390 | 42% | 413,750 | 56% | 17,110 | 63% | 31% |
| Milwaukee-Waukesha-West Allis, WI | 127,400 | 38% | 86,150 | 75% | 3,620 | 85% | 32% |
| Minneapolis-St. Paul-Bloomington, MN-WI | 218,730 | 25% | 106,830 | 49% | 9,510 | 49% | 16% |
| Nashville-Davidson-Murfreesboro-Franklin, TN | 111,660 | 35% | 63,330 | 61% | 4,470 | 66% | 22% |
| New Orleans-Metairie, LA | 97,870 | 44% | 78,960 | 62% | 13,520 | 81% | 36% |
| New York-Newark-Jersey City, NY-NJ-PA | 2,062,460 | 52% | 1,568,330 | 74% | 66,880 | 79% | 35% |
| Oklahoma City, OK | 79,560 | 31% | 51,670 | 47% | 4,040 | 54% | 21% |
| Orlando-Kissimmee-Sanford, FL | 141,830 | 31% | 110,320 | 48% | 3,250 | 56% | 21% |
| Philadelphia-Camden-Wilmington, PA-NJ-DE-MD | 402,410 | 37% | 273,370 | 66% | 16,540 | 72% | 24% |
| Phoenix-Mesa-Scottsdale, AZ | 254,710 | 33% | 179,000 | 54% | 5,070 | 57% | 23% |
| Pittsburgh, PA | 164,420 | 22% | 55,140 | 57% | 5,380 | 66% | 15% |
| Portland-Vancouver-Hillsboro, OR-WA | 215,860 | 14% | 64,830 | 22% | 3,010 | 27% | 8% |
| Providence-Warwick, RI-MA | 138,940 | 29% | 55,470 | 58% | 3,830 | 56% | 17% |
| Raleigh, NC | 73,220 | 21% | 56,330 | 34% | 2,400 | 53% | 14% |
| Richmond, VA | 70,370 | 40% | 62,260 | 58% | 3,290 | 58% | 26% |
| Riverside-San Bernardino-Ontario, CA | 212,140 | 26% | 200,190 | 35% | 6,090 | 36% | 20% |
| Sacramento--Roseville--Arden-Arcade, CA | 139,760 | 26% | 110,010 | 40% | 4,090 | 63% | 19% |
| Salt Lake City, UT | 52,410 | 19% | 29,090 | 38% | 1,260 | 41% | 14% |
| San Antonio-New Braunfels, TX | 146,470 | 28% | 130,040 | 42% | 6,660 | 61% | 26% |
| San Diego-Carlsbad, CA | 294,640 | 29% | 184,450 | 48% | 7,190 | 64% | 25% |
| San Francisco-Oakland-Hayward, CA | 450,660 | 27% | 295,000 | 42% | 12,840 | 53% | 24% |
| San Jose-Sunnyvale-Santa Clara, CA | 159,310 | 20% | 105,810 | 32% | 3,760 | 48% | 22% |
| Seattle-Tacoma-Bellevue, WA | 283,580 | 21% | 132,570 | 37% | 8,040 | 43% | 14% |
| St. Louis, MO-IL | 161,020 | 35% | 111,320 | 69% | 9,400 | 78% | 25% |
| Tampa-St. Petersburg-Clearwater, FL | 212,340 | 29% | 110,380 | 52% | 8,400 | 61% | 18% |
| Virginia Beach-Norfolk-Newport News, VA-NC | 109,430 | 35% | 91,620 | 49% | 7,250 | 58% | 23% |
| Washington-Arlington-Alexandria, DC-VA-MD-WV | 349,210 | 37% | 283,510 | 57% | 15,200 | 58% | 27% |
| All 50 Largest Metropolitan Areas | 13,034,690 | 37% | 9,390,750 | 58% | 480,430 | 67% | 27% |
| All U.S. Metropolitan Areas | 19,011,290 | 32% | 12,738,090 | 54% | 714,090 | 61% | 23% |
Appendix 2: Methodology and Data Sources
Geographies
Metropolitan areas: We define metropolitan areas using U.S. Census metropolitan statistical areas (MSAs). MSAs consist of the county or counties (or equivalent entities) associated with at least one urbanized area of at least 50,000 people, plus adjacent counties having a high degree of social and economic integration with the core as measured through commuting ties.[48] We use July 2015 Office of Management and Budget MSA delineations.[49] We identified the 50 largest MSAs using 2017 Census Population Estimates Program[50] data. Appendix 3, Table A-6 lists the 50 largest MSAs and provides their 2017 populations.
Neighborhoods: Census tracts are small, relatively permanent geographic subdivisions of a county or equivalent entity; they generally have a population between 1,200 and 8,000 people, with an optimum size of 4,000. We use Census tracts as neighborhood proxies. Where appropriate, we aggregate all Census tracts in a given MSA to calculate metropolitan-level measures.[51] We use Census tract boundaries from the 2010 decennial census and incorporate numbering and other geographic changes from 2011 and 2012. There are 60,520[52] Census tracts in all MSAs and 38,574 Census tracts in the 50 largest MSAs.
Data Sources and Definitions
Households using Housing Choice Vouchers: Data on voucher households with children are from a 2017 dataset from the HUD Office of Policy Development and Research, obtained through a research agreement. This dataset contains demographic and location information collected through HUD Form 50058 through December 2017. Race and ethnicity of voucher households were determined using data on the head of household.
Voucher-affordable rental units: We consider a rental unit to be voucher-affordable if its gross rent is below the prevailing Small Area Fair Market Rent (SAFMR). SAFMRs are set to the 40th percentile of each zip code’s rent distribution. A family with a voucher pays about 30 percent of its income for rent and utilities, and the voucher covers the remainder up to a payment standard set by the state or local housing agency, which is generally within 10 percent of the Fair Market Rent (FMR). All housing agencies in metro areas are permitted to base their vouchers on SAFMRs; those in 24 metro areas are required to do so.
We used data from the following sources to calculate the number of voucher-affordable units in metropolitan Census tracts:
- 2012-2016 American Community Survey,[53] Table B25063, which contains counts of renter-occupied units by their gross rent;
- Fiscal Year 2016 HUD Hypothetical Small Area Fair Market Rents;[54]
- 2017 HUD Tract-to-USPS ZIP Code crosswalk;[55]
- Missouri Census Data Center’s Mable/Geocorr 14 Tract-to-ZIP Code Tabulation Area (ZCTA) crosswalk;[56]
- Missouri Census Data Center’s Mable/Geocorr 14 Tract-to Core Based Statistical Area (CBSA) crosswalk.
We compute Census tract estimates of all rental units with gross rents below the prevailing two-bedroom SAFMR. HUD generates SAFMRs based on the number of bedrooms in a unit. However, the American Community Survey only publishes Census tract counts of all rental units with detailed gross rent values, without specifying the number of bedrooms. Because two-bedroom rental units are the modal rental unit in the nation and because most families with children using vouchers consist of one adult with two children, we use the two-bedroom SAFMR. Consequently, we estimate voucher-affordable rental units as all rental units (independent of bedroom size) in the tract with gross rents below the two-bedroom SAFMR.
To do this, we join zip-code-level SAFMRs to Census tract-level gross rent data using Census tract-to-zip-code correspondence files. Some zip codes span multiple metro areas and so are assigned multiple SAFMRs. To ensure that the correct SAFMRs are always assigned to tracts, metro area codes are first joined to the tract-to-zip-code correspondence files and SAFMRs are then matched to tracts by using combined zip-code-metro-area codes. Gross rent data for Census tracts are compared to a summary of the SAFMRs for all zip codes intersecting with a tract. Rental units are aggregated for all gross rent increment categories below the summarized SAFMR. Linear interpolation is used to compute the number of units below the SAFMR and above the adjacent highest rent increment threshold.
While we think we are the first to use SAFMRs to compute tract-level estimates of voucher-affordable units, others have generated estimates for other geographies or instead employed FMRs. For instance, McClure, Schwartz, and Taghavi (2015)[57] and Schwartz, McClure, and Taghavi (2016)[58] estimate Census tract counts of voucher-affordable rental units using the prevailing two-bedroom FMR. Furthermore, a recent report[59] by NYU’s Furman Center also computes zip-code-level estimates of voucher affordable rental units using SAFMRs.
Poverty Rate: Data on poverty by Census tract are from the 2012-2016 American Community Survey, Table S1701: Poverty Status in the Past 12 Months. High-poverty neighborhoods are Census tracts with poverty rates at or above 30 percent, while low-poverty neighborhoods are Census tracts with poverty rates under 10 percent.
Opportunity: Our opportunity index is a composite measure that considers school quality, poverty, labor market engagement, access to jobs, and access to transit. It is based on five of HUD’s Affirmatively Furthering Fair Housing (AFFH) opportunity indices. Data are from HUD’s AFFH Data,[60] Version AFFHT0004 (last updated November 2017).
Low-opportunity neighborhoods are Census tracts with opportunity index scores in the bottom quintile for all metropolitan tracts. High-opportunity neighborhoods are Census tracts with opportunity index scores in the top quintile for all metropolitan tracts. We do this to ensure consistent definitions of opportunity across metropolitan areas.
We compute a composite opportunity index by averaging the standardized[61] variables of five of HUD’s AFFH opportunity indices: the School Proficiency Index, Low Poverty Index, Labor Market Engagement Index, Transit Trips Index, and Jobs Proximity Index. We exclude a second HUD transportation variable — the Transportation Cost Index — because it’s highly correlated with the Transit Trips Index (r = 0.78). We also exclude the HUD Environmental Health Index due to a high number of missing values.
If a Census tract was missing data for any of the five AFFH indices that make up our composite opportunity index, we coded the opportunity index value as missing. Three metro areas — Kansas City, MO-KS; Birmingham-Hoover, AL; and New Orleans-Metairie, LA — have substantial shares of Census tracts with missing data for the opportunity index. Forty-three percent of Census tracts in the Kansas City metro, 7 percent of Census tracts in the Birmingham metro, and 6 percent of Census tracts in the New Orleans metro area are missing data on the composite opportunity index. The missing data stem primarily from the School Proficiency Index, one of the component parts of the composite index.[62]
“Minority-concentrated” neighborhoods: “Minority-concentrated” neighborhoods are Census tracts where the share of the population that identifies as a person of color is at least 20 percentage points larger than the metropolitan-wide percentage. This method is based on HUD’s official procedure for designating tracts as “areas of minority concentration” in the Rental Assistance Demonstration program.[63] Counts of people by race and ethnicity by Census tract are from the 2012-2016 American Community Survey, Table B03002, Hispanic or Latino Origin by Race. We compute the person-of-color population by subtracting non-Hispanic whites from the total population and then computing the share of the Census tract total population that is not non-Hispanic white.
Low-income renters of color: Data on low-income renter households of color by Census tract are from HUD’s 2011-2015 Comprehensive Housing Affordability Strategy (CHAS)[64] dataset. The CHAS data are custom tabulations of the American Community Survey that Census creates especially for HUD. Low-income renters have household income below 80 percent of the local median income, making them eligible for HUD rental assistance.
Vacancy rate: Data on rental vacancy rates by metropolitan area are from the 2012-2016 American Community Survey, Table DP04: Selected Housing Characteristics.
Region: We categorized metropolitan areas into regions using the Census Bureau’s Census Regions and Census Divisions. There are four regions: Northeast, Midwest, South, and West. Each region is divided into two or more subregions.[65]
Number of housing agencies: Data on the number of housing agencies serving each metropolitan area are from HUD’s 2016 Picture of Subsidized Households[66] dataset.
Neighborhood Measures
We use absolute and relative measures to analyze the location of voucher-affordable units and families with children using vouchers. We use these measures to determine whether units or families are concentrated in high- or low-poverty, high- or low-opportunity, or “minority-concentrated” Census tracts. Absolute and relative measures of voucher concentration[67] are computed for each of the top 50 MSAs and for all U.S. metropolitan areas.
Absolute voucher concentration is the share of voucher households living in high- or low-poverty, high- or low-opportunity, or “minority-concentrated” Census tracts. We exclude households with missing data from the denominator, due to high levels of missing data for the opportunity index in certain metro areas. For instance, absolute concentration in high-poverty neighborhoods would be calculated as follows:
Absolute voucher-affordable unit concentration is the share of voucher-affordable units in high- or low-poverty, high- or low-opportunity, or “minority-concentrated” Census tracts. We exclude units with missing data from the denominator.
Relative voucher concentration is the difference between the shares of metropolitan voucher households and voucher-affordable rental units in high- or low-poverty, high- or low-opportunity, or “minority-concentrated” Census tracts. In other words, it is the difference between absolute voucher concentration and absolute voucher-affordable units.
Appendix 3: Supplemental Data Tables
| TABLE A-6 | ||
|---|---|---|
| 50 Most Populous Metropolitan Statistical Areas, 2017 | ||
| Rank | Metropolitan Statistical Area | 2017 Population Estimate |
| 1 | New York-Newark-Jersey City, NY-NJ-PA | 20,320,900 |
| 2 | Los Angeles-Long Beach-Anaheim, CA | 13,353,900 |
| 3 | Chicago-Naperville-Elgin, IL-IN-WI | 9,533,000 |
| 4 | Dallas-Fort Worth-Arlington, TX | 7,399,700 |
| 5 | Houston-The Woodlands-Sugar Land, TX | 6,892,400 |
| 6 | Washington-Arlington-Alexandria, DC-VA-MD-WV | 6,216,600 |
| 7 | Miami-Fort Lauderdale-West Palm Beach, FL | 6,158,800 |
| 8 | Philadelphia-Camden-Wilmington, PA-NJ-DE-MD | 6,096,100 |
| 9 | Atlanta-Sandy Springs-Roswell, GA | 5,884,700 |
| 10 | Boston-Cambridge-Newton, MA-NH | 4,836,500 |
| 11 | Phoenix-Mesa-Scottsdale, AZ | 4,737,300 |
| 12 | San Francisco-Oakland-Hayward, CA | 4,727,400 |
| 13 | Riverside-San Bernardino-Ontario, CA | 4,580,700 |
| 14 | Detroit-Warren-Dearborn, MI | 4,313,000 |
| 15 | Seattle-Tacoma-Bellevue, WA | 3,867,000 |
| 16 | Minneapolis-St. Paul-Bloomington, MN-WI | 3,600,600 |
| 17 | San Diego-Carlsbad, CA | 3,337,700 |
| 18 | Tampa-St. Petersburg-Clearwater, FL | 3,091,400 |
| 19 | Denver-Aurora-Lakewood, CO | 2,888,200 |
| 20 | Baltimore-Columbia-Towson, MD | 2,808,200 |
| 21 | St. Louis, MO-IL | 2,807,300 |
| 22 | Charlotte-Concord-Gastonia, NC-SC | 2,525,300 |
| 23 | Orlando-Kissimmee-Sanford, FL | 2,509,800 |
| 24 | San Antonio-New Braunfels, TX | 2,474,000 |
| 25 | Portland-Vancouver-Hillsboro, OR-WA | 2,453,200 |
| 26 | Pittsburgh, PA | 2,333,400 |
| 27 | Sacramento--Roseville--Arden-Arcade, CA | 2,324,900 |
| 28 | Las Vegas-Henderson-Paradise, NV | 2,204,100 |
| 29 | Cincinnati, OH-KY-IN | 2,179,100 |
| 30 | Kansas City, MO-KS | 2,128,900 |
| 31 | Austin-Round Rock, TX | 2,115,800 |
| 32 | Columbus, OH | 2,078,700 |
| 33 | Cleveland-Elyria, OH | 2,058,800 |
| 34 | Indianapolis-Carmel-Anderson, IN | 2,028,600 |
| 35 | San Jose-Sunnyvale-Santa Clara, CA | 1,998,500 |
| 36 | Nashville-Davidson--Murfreesboro--Franklin, TN | 1,903,000 |
| 37 | Virginia Beach-Norfolk-Newport News, VA-NC | 1,725,200 |
| 38 | Providence-Warwick, RI-MA | 1,621,100 |
| 39 | Milwaukee-Waukesha-West Allis, WI | 1,576,200 |
| 40 | Jacksonville, FL | 1,505,000 |
| 41 | Oklahoma City, OK | 1,383,700 |
| 42 | Memphis, TN-MS-AR | 1,348,300 |
| 43 | Raleigh, NC | 1,335,100 |
| 44 | Richmond, VA | 1,294,200 |
| 45 | Louisville/Jefferson County, KY-IN | 1,294,000 |
| 46 | New Orleans-Metairie, LA | 1,275,800 |
| 47 | Hartford-West Hartford-East Hartford, CT | 1,210,300 |
| 48 | Salt Lake City, UT | 1,203,100 |
| 49 | Birmingham-Hoover, AL | 1,149,800 |
| 50 | Buffalo-Cheektowaga-Niagara Falls, NY | 1,136,900 |
| TABLE A-7 | ||
|---|---|---|
| Census Tracts Counts by Poverty, Opportunity, and “Minority Concentration” | ||
| Type | All Metropolitan Tracts | 50 Largest Metro Areas |
| Low Poverty | 25,122 | 17,481 |
| High Poverty | 8,402 | 4,930 |
| Low Opportunity | 11,776 | 6,234 |
| High Opportunity | 11,775 | 10,032 |
| “Minority Concentrated” | 13,900 | 10,438 |
| TABLE A-8 | |||
|---|---|---|---|
| Missing Data for Neighborhood Measures | |||
| Total Census Tracts | Tracts with Missing Data | Percent Missing | |
| 50 Largest Metro Areas | |||
| Voucher-affordable units | 38,574 | 207 | 0.54% |
| Poverty Rate | 38,574 | 137 | 0.36% |
| “Minority Concentration” | 38,574 | 81 | 0.21% |
| Opportunity Index | 38,574 | 580 | 1.5% |
| All U.S. Metro Areas | |||
| Voucher-affordable units | 60,520 | 357 | 0.59% |
| Poverty Rate | 60,520 | 241 | 0.4% |
| “Minority Concentration” | 60,520 | 113 | 0.19% |
| Opportunity Index | 60,520 | 1,643 | 2.7% |
| TABLE A-9 | |||
|---|---|---|---|
| Missing Data for Voucher Households | |||
| Total Households | Households with missing data | Percent Missing | |
| 50 Largest Metro Areas | |||
| Missing race or ethnicity | 1,318,194 | 469 | 0.04% |
| Missing Census tract location | 1,318,194 | 47 | 0.004% |
| All U.S. Metro Areas | |||
| Missing race or ethnicity | 1,988,606 | 813 | 0.04% |
| Missing Census tract location | 1,988,606 | 557 | 0.03% |
End Notes
[1]Brian Knudsen is a Senior Research Associate at the Poverty & Race Research Action Council.
[2] In this analysis, voucher-affordable rental units are those with gross rents (rent plus tenant-paid utilities) below the local two-bedroom Small Area Fair Market Rent (SAFMR). Voucher-affordable units may be of any bedroom size, due to data limitations. See the methodology in Appendix 2.
[3] “Metropolitan” or “all metro” areas in this paper refers to all 382 metropolitan areas in the United States.
[4] Our opportunity index is a composite measure that considers school quality, poverty, labor market engagement, access to jobs, and access to transit. It is based on five of HUD’s Affirmatively Furthering Fair Housing (AFFH) opportunity indices. Low-opportunity neighborhoods in this analysis are Census tracts that have opportunity index scores in the bottom quintile (bottom 20 percent) for all metropolitan tracts; high-opportunity neighborhoods have opportunity index scores in the top quintile. For more details, see the methodology in Appendix 2.
[5] Department of Housing and Urban Development, “Affirmatively Furthering Fair Housing; Final Rule,” 80 Fed. Reg. 42272, 42274, July 16, 2015.
[6] The share of people of color in “minority-concentrated” neighborhoods is at least 20 percentage points higher than in the metro area as a whole. This is based on HUD’s official measure of “areas of minority concentration” used in the Rental Assistance Demonstration program. See Appendix 2 for more details.
[7] This paper uses the terms “families with children using vouchers,” “families using vouchers,” “families,” “voucher-assisted families with children,” and “voucher-assisted families” interchangeably. While results presented here pertain only to households with minor children, the interactive web tables and maps include data on all households using vouchers.
[8] View our interactive tables and charts at https://www.cbpp.org/research/housing/interactive-tables-where-voucher-assisted-households-live-in-the-50-largest and map at https://www.cbpp.org/research/housing/interactive-map-where-voucher-households-live-in-the-50-largest-metropolitan-areas. Nick Kasprak developed the web interactives for this report.
[9] For more on the quality of schools near families using vouchers and other forms of federal rental assistance, see Ingrid Gould Ellen and Keren Horn, “Housing and Educational Opportunity: Characteristics of Local Schools Near Families with Federal Housing Assistance,” Poverty & Race Research Action Council, July 2018, https://prrac.org/housing-and-educational-opportunity-characteristics-of-local-schools-near-families-with-federal-housing-assistance/.
[10] Rebecca Casciano and Douglas S. Massey, “Neighborhood disorder and individual economic self-sufficiency: New evidence from a quasi-experimental study,” Social Science Research, February 2012, pp 1-18.
[11] Xavier de Souza Briggs, The Geography of Opportunity: Race and Housing Choice in Metropolitan America, Brookings Institution Press, 2005.
[12] For a synthesis of some of this research, see Barbara Sard, Douglas Rice, Alison Bell, and Alicia Mazzara, “Federal Policy Changes Can Help More Families with Housing Vouchers Live in Higher-Opportunity Areas,” Center on Budget and Policy Priorities, September 4, 2018, https://www.cbpp.org/research/housing/federal-policy-changes-can-help-more-families-with-housing-vouchers-live-in-higher.
[13] Raj Chetty, Nathanial Hendren, and Lawrence Katz, “The Effects of Exposure to Better Neighborhoods on Children: New Evidence from the Moving to Opportunity Experiment,” American Economic Review 106, No. 4, 2016, pp. 855–902.
[14] For a synthesis of some of this research, see Sard et al.
[15] Sard et al.
[16] CBPP analysis of 2017 HUD administrative data.
[17] Historically, HUD has established a single set of Fair Market Rents (FMRs) for units of various sizes in each metro area or rural county. In recent years, however, HUD has tested SAFMRs, which are based on rents in a particular zip code within a metropolitan area. SAFMRs therefore reflect neighborhood rents more accurately than metro-level FMRs. For more, see Center on Budget and Policy Priorities and Poverty & Race Research Action Council, “A Guide to Small Area Fair Market Rents,” May 4, 2018, https://www.cbpp.org/research/housing/a-guide-to-small-area-fair-market-rents-safmrs.
[18] Racism and discriminatory public policies have played a central role in the creation and persistence of high-poverty, low-opportunity neighborhoods, which are home primarily to people of color, particularly African Americans. (These factors also contributed to the creation and persistence of predominantly white, low-poverty neighborhoods that feature well-resourced, high-performing schools.) See, for instance, Richard Rothstein, The Color of Law: A Forgotten History of How Our Government Segregated America, Liveright, 2017.
[19] The Housing Choice Voucher program is administered by about 2,100 state and local housing agencies. Nearly all of the 50 largest metro areas are served by more than one agency. See Barbara Sard and Deborah Thrope, “Consolidating Rental Assistance Administration Would Increase Efficiency and Expand Opportunity,” Center on Budget and Policy Priorities, April 11, 2016, https://www.cbpp.org/research/housing/consolidating-rental-assistance-administration-would-increase-efficiency-and-expand.
[20] CBPP/PRRAC analysis of 2012-2016 American Community Survey (ACS) and 2017 HUD administrative data. Unless otherwise noted, figures in this paper come from CBPP or PRRAC analysis of HUD and ACS data. ACS estimates are subject to survey error and differences may not be statistically significant.
[21] Heather Schwartz, “Housing policy is school policy: Economically integrative housing promotes academic success in Montgomery County, Maryland,” in R.D. Kahlenberg, ed., The Future of School Integration, Century Foundation, 2012; Raj Chetty and Nathaniel Hendren, “The Effects of Neighborhoods on Intergenerational Mobility I: Childhood Exposure Effects and II: County-Level Estimates,” Quarterly Journal of Economics, August 2018, a version of which was released in 2015; Roslyn Arlin Mikelson, “School Integration and K-12 Educational Outcomes: A Quick Synthesis of Social Science Evidence,” National Coalition on School Diversity, March 2015, https://www.gpmlaw.com/portalresource/School_Integration_and_K-12_Educational_Outcomes.pdf.
[22] Sard et al.
[23] As noted, the available data do not allow us to limit the number of voucher-affordable units to those with two or more bedrooms. But even if this limitation causes us to overstate the number of available units in low-poverty neighborhoods, it is still highly likely that there is ample supply available for more voucher-assisted families to live in low-poverty neighborhoods.
[24] The Baltimore metro area has a large and successful housing mobility program that helps interested families move to lower-poverty, higher-opportunity neighborhoods. For more information, see http://www.brhp.org/.
[25] Nationwide, over 723,000 children in families using vouchers live in high-poverty neighborhoods, including 315,000 that live in extreme-poverty neighborhoods, where the poverty rate is 40 percent or higher. For more on the location of all children in the voucher program, see Sard et al.
[26] George Galster, “The mechanism(s) of neighbourhood effects: Theory, evidence, and policy implications,” in Maarten van Ham, et al., eds., Neighbourhood Effects Research: New Perspectives, Springer, 2012, pp. 23-56.
[27] For more on the challenges of measuring neighborhood opportunity, see Elijah Knapp, “The Cartography of Opportunity: Spatial Data Science for Equitable Urban Policy,” Housing Policy Debate, 2017, Vol 27, No. 6.
[28] After we completed our analyses, the Census Bureau published measures of upward economic mobility developed by Raj Chetty, John Friedman, Nathaniel Hendren, Maggie R. Jones, and Sonya R. Porter in their working paper, “The Opportunity Atlas: Mapping the Childhood Roots of Social Mobility,” https://www.census.gov/ces/pdf/opportunity_atlas_paper.pdfhttps://www.census.gov/ces/pdf/opportunity_atlas_paper.pdf. We find that our opportunity index correlates with the Opportunity Atlas data. In the 50 largest metropolitan areas, Census tracts that we define as “high opportunity” tend to be associated in the Opportunity Atlas data with a higher probability of a child born at the 25th income percentile rising to the 80th income percentile as an adult and vice versa for tracts we define as “low opportunity” (overall correlation of .6). Forty-four out of 50 metropolitan areas in our analysis had a moderate to strong correlation with the Opportunity Atlas data (correlation of .5 or greater).
[29] Department of Housing and Urban Development, Affirmatively Furthering Fair Housing: Streamlining and Enhancements, 83 FR 40713 (August 16, 2018). HUD’s suspension of the requirements for local assessments of fair housing has been challenged in court and remains under review as of this writing. National Fair Housing Alliance et al. v. Carson, U.S. District Court for the District of Columbia Civ. Action No. 1:18-cv-01076-BAH.
[30] CBPP/PRRAC analysis of HUD’s 2011-2015 Comprehensive Housing Affordability Strategy data. Low-income renter households earn less than 80 percent of the local median income, making them eligible for a voucher or other HUD rental assistance. Due to data limitations, we cannot further restrict the universe of low-income renters of color to those without any rental assistance or those in families with children.
[31] This disparity may reflect, in part, the different racial and ethnic make-up of voucher recipients across different housing agencies within a metro area. In most of the 50 largest metro areas, white, non-Hispanic families represent a small percentage of all families with children using vouchers. This is particularly true in southern metro areas like Memphis and New Orleans.
[32] We compare voucher-assisted families of color to other low-income renters of color because the voucher is designed to give recipients the same housing purchasing power as low-income households (those earning 80 percent or less of the local median income) that cannot afford prevailing rents without assistance. However, differences between families of color with children using vouchers and all low-income renters of color (many of which do not have children) may explain some of these findings. Voucher recipients have limited time to use their voucher to find an apartment, and constraints on time, money, or transportation can make it more difficult to search widely for housing. We also compared voucher-assisted families of color to very low-income renters of color (those earning less than 50 percent of the local median income) because voucher recipients typically have incomes below 50 percent of the local median. Results of this comparison were similar: 56 percent of very low-income renters of color (most of whom do not receive housing assistance) live in “minority-concentrated” tracts, and in 35 out of the 50 largest metros, the share of families of color using vouchers in “minority-concentrated” neighborhoods exceeds the share of very low-income renters of color overall in those neighborhoods.
[33] In most states and metro areas, landlords can discriminate against voucher recipients by refusing to accept a voucher as a means of payment, a practice known as source of income discrimination. See Mary Cunningham et al., “A Pilot Study of Landlord Acceptance of Housing Choice Vouchers,” Department of Housing and Urban Development, September 2018, https://www.huduser.gov/portal//portal/sites/default/files/pdf/Landlord-Acceptance-of-Housing-Choice-Vouchers.pdf . This practice is outlawed in some states and local jurisdictions, but it is unclear how well these laws are enforced. See Alison Bell, Barbara Sard and Beck Koepnick, “Prohibiting Discrimination Against Renters Using Housing Vouchers Improves Results”, Center on Budget and Policy Priorities, October 10, 2018, https://www.cbpp.org/research/housing/prohibiting-discrimination-against-renters-using-housing-vouchers-improves-results.
[34] Various voucher program policies hinder families’ access to units considered “affordable” in this analysis. See Sard et al.
[35] Barbara Sard and Deborah Thrope, “Consolidating Rental Assistance Administration Would Increase Efficiency and Expand Opportunity,” Center on Budget and Policy Priorities, April 11, 2016, https://www.cbpp.org/research/housing/consolidating-rental-assistance-administration-would-increase-efficiency-and-expand.
[36] John Iceland et al., “Racial and Ethnic Residential Segregation in the United States: 1980-2000”, U.S. Census Bureau, August 2002, https://www.census.gov/content/dam/Census/library/publications/2002/dec/censr-3.pdf.
[37] The Baltimore Housing Mobility Program, currently administered by the Baltimore Regional Housing Partnership, uses a composite definition of opportunity based on three different indices that differ somewhat from the HUD opportunity indices used in this analysis.
[38] Mary Cunningham, et al., “2018, https://www.huduser.gov/portal//portal/sites/default/files/pdf/Landlord-Acceptance-of-Housing-Choice-Vouchers.pdf.
[39] There are 201 high-opportunity, low-poverty metropolitan neighborhoods that meet HUD’s criteria for “minority-concentrated.”
[40] In addition to their obligations under the Fair Housing Act, every public housing agency is required to certify annually that it is carrying out the Act and under civil rights statutes. See section 5A(d)(15) of the U.S. Housing Act, 42 U.S.C. § 1437c(A)(d)(15).
[41] George Galster, “An economic efficiency analysis of deconcentrating poverty populations,” 2002, Journal of Housing Economics 11:303–329; Roberto G. Quercia and George C. Galster, “Threshold Effects and Neighborhood Change,” 2000, Journal of Planning Education and Research 20:146-162.
[42] Families using vouchers are also less likely to be in neighborhoods with poverty rates below 15 percent, relative to affordable units. Twenty-seven percent of metropolitan voucher-assisted families with children live in neighborhoods with poverty rates below 15 percent, compared to 43 percent of metropolitan voucher-affordable units.
[43] For more on how state and local housing agencies can increase the value of the voucher by voluntarily adopting Small Area Fair Market Rents or using SAFMRs as the basis of higher payment standards in some of their neighborhoods, see Center on Budget and Policy Priorities and the Poverty & Race Research Action Council, “A Guide to Small Area Fair Market Rents,” May 4, 2018, https://www.cbpp.org/research/housing/a-guide-to-small-area-fair-market-rents-safmrs.
[44] NYU Furman Center, “How Do Small Area Fair Market Rents Affect the Location and Number of Units Affordable to Voucher Holders?” January 5, 2018, https://furmancenter.org/files/NYUFurmanCenter_SAFMRbrief_5JAN2018_1.pdf; Center on Budget and Policy Priorities and the Poverty & Race Research Action Council, “A Guide to Small Area Fair Market Rents,” May 4, 2018, https://www.cbpp.org/research/housing/a-guide-to-small-area-fair-market-rents-safmrs.
[45] For more details on these policy recommendations, see Will Fischer, “Low-Income Housing Tax Credit Could Do More to Expand Opportunity for Poor Families,” Center on Budget and Policy Priorities, August 2018, https://www.cbpp.org/research/housing/low-income-housing-tax-credit-could-do-more-to-expand-opportunity-for-poor-families.
[46] For more details on these policy recommendations, see Sard et al.
[47] For more details on these policy recommendations, see Will Fischer, “Low-Income Housing Tax Credit Could Do More to Expand Opportunity for Poor Families,” Center on Budget and Policy Priorities, August 2018, https://www.cbpp.org/research/housing/low-income-housing-tax-credit-could-do-more-to-expand-opportunity-for-poor-families.
[48] For this and additional geographic definitions, see: https://www.census.gov/programs-surveys/metro-micro/about/glossary.html.
[49] See here for delineation files: https://www.census.gov/geographies/reference-files/time-series/demo/metro-micro/delineation-files.html.
[50] See here for data files: https://www.census.gov/programs-surveys/popest/data/tables.html. (Accessed 6/27/2018.)
[51] Geographic definitions for census tracts are at: https://www.census.gov/geo/reference/gtc/gtc_ct.html.
[52] This accounts for 83 percent of all tracts nationally, while about 53 percent of all tracts are in the 50 largest MSAs.
[53] Available at: https://www.census.gov/programs-surveys/acs/
[54] Available at: https://www.huduser.gov/portal/datasets/fmr/smallarea/index.html
[55] Available at: https://www.huduser.gov/portal/datasets/usps_crosswalk.html
[56]Available at: http://mcdc.missouri.edu/websas/geocorr14.html
[57] Kirk McClure, Alex F. Schwartz, and Lydia B. Taghavi, “Housing Choice Voucher Location Patterns a Decade Later,” Housing Policy Debate 25, Issue 2, 2015, pp. 215-233.
[58] Alex Schwartz, Kirk McClure and Lydia B. Taghavi, “Vouchers and Neighborhood Distress: The Unrealized Potential for Families With Housing Choice Vouchers to Reside in Neighborhoods With Low Levels of Distress,” Cityscape 18, Number 3, 2016, pp. 207-227.
[59] NYU Furman Center, “How Do Small Area FMRs Affect the Location and Number of Units Affordable to Voucher Holders?” January 5, 2018, https://furmancenter.org/files/NYUFurmanCenter_SAFMRbrief_5JAN2018_1.pdf.
[60] Available at: https://www.hudexchange.info/programs/affh/
[61] Z-scores are computed for all Census tracts in all U.S. MSAs.
[62] There are no school proficiency data for jurisdictions in Kansas, West Virginia, and Puerto Rico because no data were reported for jurisdictions in these states in the Great Schools 2013-14 dataset.
[63] For purposes of the RAD program, HUD considers a site to be in an “area of minority concentration” when either “(i) the percentage of persons of a particular racial or ethnic minority within the area of the site is at least 20 percentage points higher than the percentage of that minority group in the housing market area as a whole or (ii) the total percentage of minority persons within the area of the site is at least 20 points higher than the total percentage of minorities in the housing market area as a whole.” HUD, “Rental Assistance Demonstration (RAD) Notice Regarding Fair Housing and Civil Rights Requirements and Relocation Requirements Applicable to RAD First Component – Public Housing Conversions,” PIH 2016-17 (HA), section 5.4(B)(1), https://www.hud.gov/sites/documents/16-17HSGN_16-17PIHN.PDF.
[64] Available at: https://www.huduser.gov/portal/datasets/cp.html
[65] For the full list, see https://www2.census.gov/geo/pdfs/maps-data/maps/reference/us_regdiv.pdf.
[66] Available at: https://www.huduser.gov/portal/datasets/assthsg.html.
[67] Similar concentration measures were often employed in previous research, e.g. Schwartz, McClure, and Taghavi (2016). This report applies these concentration formulae to MSAs.
Más de los autores

Areas of Expertise
