State Taxes Have a Negligible Impact on Americans' Interstate Moves
Differences in tax levels among states have little to no effect on whether and where people move, contrary to claims by some conservative economists and elected officials. For decades, Americans have been moving away from the Northeast, the industrial Midwest, and the Great Plains to most of the southern and southwestern states, regardless of overall tax levels or the presence of an income tax in any of these states. They’ve moved in large part for employment opportunities in the Sunbelt states and, secondarily, for less expensive housing, and, for many retirees, a warmer, snow-free climate.
Accordingly, policymakers in states like Kansas, Michigan, Nebraska, Ohio, and Wisconsin that have already cut or are considering cutting their income taxes should harbor no illusions that such a move will stem — let alone reverse — their states’ longstanding net out-migration trends. To the contrary; if deep tax cuts result in significant deterioration in education, public safety, parks, roads, and other critical services and infrastructure, these states will render themselves less — not more — desirable places to live and raise a family.
To be sure, some individuals relocate because they think their taxes are too high or take state and local tax levels into account in deciding where to live. Nonetheless, there is overwhelming evidence that those cases are sufficiently rare that they should not drive state tax policy formulation. For states, the implications are two-fold:
- First, policymakers in most relatively high-tax states still have considerable room to increase income taxes on the affluent before they should worry about the potential effects on migration.
- Second, and more important in the current policy environment, states should not cut their income taxes with the expectation that they will thereby significantly slow — let alone reverse — the flow of residents leaving their state. Indeed, the opposite may well be true. Such cuts are more likely to reduce than enhance a state’s attractiveness as a place to live by leading to deterioration in the quality of critical public services.
Several anti-tax advocates have been especially visible and vociferous in advocating state personal income tax cuts, arguing that personal income taxes are leading individuals and families to relocate from the 41 states that levy them (and particularly from those that levy them at somewhat higher rates) to the nine states that don’t have income taxes. They assert that large numbers of people are consciously “voting with their feet” — leaving high income tax states for low- or no-income-tax states in large part because they want to retain more of their wages and salaries rather than pay them in state and local taxes. Some also claim that primarily highly educated, high-income individuals are fleeing states with relatively high and progressive income tax structures in favor of states without income taxes.
The available data, however, fail to support claims that much interstate migration is driven by high-income people — or anyone else — consciously choosing low-tax locations. A careful look at Census and IRS data on interstate migration, and a review of academic studies, find that:
- Relatively few Americans relocate from state to state, and a miniscule share of them report that they moved because of taxes. More than two-thirds of Americans born in the United States — 69 percent — still reside in the state in which they were born. Only about 1.5 to 2 percent of U.S. residents relocate across state lines each year, and the rate seems to be declining. And of that 1.5 to 2 percent who make an interstate move, the vast majority cite new, transferred, or lost jobs or family-related reasons (like needing to care for an ailing relative) — not the “other” category that would encompass lower taxes.
- People who do move are nearly as likely to move from low-tax states to high-tax states as in the other direction — in some cases, more likely. In the past two decades, more households moved from no-income-tax Florida to Georgia, North Carolina, and nine other states with income taxes than moved to Florida from these states. Even in Northeastern and Great Lakes states that do levy income taxes and that have consistently experienced net out-migration in recent years, most of the people moving out are replaced by people moving in. New York experienced the highest net out-migration of any state for the 1993-2011 period for which the IRS has data, but even there, households moving in from other states replaced two-thirds of those that moved out (and the rest were replaced by international in-migration and new births, with the result that New York’s population is still growing at a moderate rate).
- Additional analysis of state-to-state migration patterns reveal trends that confound the taxes-drive-migration thesis. Almost as many people moved to income-tax-levying Arizona as to no-income-tax Texas between 1993 and 2011, even though Texas is a much larger state with many more jobs for a potential in-mover to fill. No-income-tax Nevada attracted 37 percent fewer households than Arizona did, even though the states are next-door neighbors and have similar climates. Florida, a state without an income tax, lost households to 15 states during this same period, 11 of them states levying income taxes. Net in-migration of households to North Carolina was more than double that of its neighboring no-income-tax state of Tennessee even though North Carolina had the highest income taxes of any Sunbelt state throughout this period.
- Primarily low- and moderate-income households, not high-income households, are migrating to states without income taxes. For example, of the people moving from New York to Florida between 2008 and 2012, more than three times as many had incomes below $50,000 as above $100,000, and these distributions are similar to the overall state population. If income taxes were a major reason that more people move from California to Texas than vice versa, one would expect much greater representation of high incomes among the former than the latter; but, the reverse is true.
- Climate is a major driver of interstate migration; people — especially retirees — continue to move from cold, snowy states to Sunbelt states regardless of the tax levels in either the origin or destination state. No-income-tax Florida had the highest net in-migration of any state from 1993-2011 and Texas came in second, but income-tax-levying Arizona and relatively high-income-tax North Carolina were close behind. Frigid South Dakota and Alaska both experienced net out-migration even though neither levies an income tax, and no-income-tax New Hampshire had net in-migration of just 16,000 households over those 18 years, as 373,000 moved out. Many of these Frostbelt-to-Sunbelt migrants are retirees; 45 percent of all the people who moved from New York to Florida over the past five years were 55 or older, and the shares were as high or higher for those moving to Florida from Illinois, Massachusetts, Michigan, and New Jersey. Florida’s no-income-tax status may appeal to affluent people from Northern states, but the overwhelming evidence shows that those states would have lost all or nearly all of those retirees for climate reasons alone and that trying to retain them by cutting income taxes would have been futile.
- Reductions in housing costs, not taxes, are what save families the most money when they move from states like New York and California to states like Texas and Florida. Taxes are much less consequential than housing costs for most families making many of the specific state-to-state moves that conservative economists attribute to taxes. For example, a typical family with a $75,000 income selling its home in Los Angeles in 2010 and buying one in Las Vegas or Houston would have saved more than two-and-a-half times as much in mortgage payments as they would have saved in state and local taxes. The same family moving from New York City to Miami would have saved more than three times as much in housing costs as in state and local taxes.
- The vast majority of academic research using sophisticated statistical techniques concludes that differences in state tax systems and levels do not have a significant impact on interstate migration. Seven economists (or groups of economists) have published studies on state taxes and migration in peer-reviewed economics journals since 2000. Six of the seven studies concluded that taxes do not drive interstate moves. Eight additional studies on the impact of state taxes on migration that were not published in academic journals have been released in the same period; six of the eight found either that state income taxes had no effect on migration or that the effect was small or inconsistent. One study concluded, for example, that “[T]he effect of the new tax bracket [for taxpayers earning more than $500,000] is negligible overall. Even among the top 0.1 percent of income earners, the new tax did not appreciably increase out-migration.” Another found: “The results from all analyses overwhelmingly find no credible effect of state income tax breaks on elderly migration.”
Rate of Interstate Migration Is Small and Declining
First, the basics: interstate migration rates are relatively modest.
- As Figure 1 shows, annual state-to-state migration since 1980-81 has ranged between 1.4 percent and 3.2 percent of the total U.S. population. It averaged just 2.2 percent annually during that period.[1] Even this small percentage, 2.2 percent, overstates the real impact of interstate migration on state populations and economies. In every state in every year, the vast majority of state residents moving to another state are replaced by people moving from another state. (This phenomenon is discussed later in this paper.) From 2000 to 2009, not a single state lost population due to people moving to other states, or for any other reason. Some states’ populations grew faster than others, but mostly due to newly born children and immigrants from other countries, not net interstate migration.[2]Image
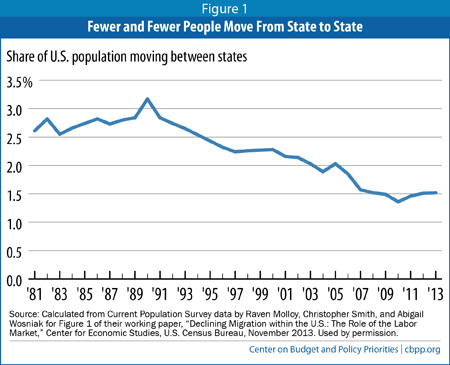
- The rate of interstate migration has been falling since 1990, as Figure 1 also shows. It has averaged just 1.6 percent annually in the past 10 years.
- In fact, the great majority of Americans never leave their home state. As of 2010, fully 69 percent of Americans born in the United States resided in the state in which they were born.[3]
Statistical Research and Surveys Show That Jobs and Family Are Top Reasons for Interstate Moves
Demographers and economists have been using sophisticated statistical techniques for decades in order to understand the reasons people move from state to state. These studies generally reach conclusions about people’s reasons for moving by examining the objective characteristics of the movers themselves — age, education, family composition, and income levels, for example — and of the origin and destination locations (unemployment rates, wage levels, and housing costs).[4] A general consensus has emerged from this research that most short-distance moves are motivated by a desire for better housing (cheaper, higher quality, closer to work, transition from renter to owner, location in a preferred neighborhood), while long-distance moves are more likely to be job-related as people are laid-off, transferred or simply decide to look for a higher-paying job elsewhere. A 2009 study, for example, found that interstate differences in unemployment rates and income levels had roughly twice as great an impact on interstate migration as interstate differences in housing affordability.[5]
Survey data that have become available in recent years generally confirm the findings of statistical research on migration. Each year since 1998, the federal government has surveyed people who move, asking them the main reason they moved. The two most common reasons cited for an interstate move in the most recent survey were “new job or job transfer” and “other family reason.” These reasons were offered by 32 percent and 23 percent of interstate movers, respectively — or 55 percent in total.[6]
The survey does not explicitly offer respondents the option of answering “Wanting to reduce the amount of state and local taxes I pay.” Nonetheless, people for whom that is the main reason for a move could choose another category the survey offers, such as “other housing reason” or, simply, “other reason.” Only 13 percent of people who changed their state of residence between 2012 and 2013 chose those two answers, however.[7] Moreover, it is highly unlikely that that entire 13 percent had state and local taxes in mind when answering that way; there are many other reasons why people would answer “other” or “other housing.” For example, people might want to live near the ocean or within a specific school district.
The Faulty Claim That Taxes Significantly Affect Migration: A Closer Look at the Data
Notwithstanding the large body of research and the survey results attributing most interstate migration to job- and family-related factors, a growing number of conservative analysts and elected officials are pointing the finger at state and local taxes as a significant driver of interstate moves. Rich States, Poor States, by well-known conservative economists Arthur Laffer and Stephen Moore, and How Money Walks, by lobbyist Travis Brown, argue that state personal income taxes lead individuals and families to relocate from the 41 states that levy them to the 9 states — Alaska, Florida, Nevada, New Hampshire, South Dakota, Tennessee, Texas, Washington, and Wyoming — that don’t.[8]
Laffer, Moore, and Brown argue that people “vote with their feet.”[9] That is, they claim that people are leaving high-income-tax states for low- or no-income-tax states in large part because they want to be able to retain more of their wages rather than pay them to state and local governments. They also imply (and in some places argue explicitly) that it is high-income people who are migrating in search of lower taxes; in making state-to-state comparisons of income tax levels, the key piece of evidence that they nearly always focus on is the state personal income tax rates that apply to the highest-income residents of a state.
And they claim these effects are enormously important. Laffer and Moore assert that while “taxes and other government policies are not all that matters to migration... they certainly matter in a significant way.[10]” Brown goes much further. “Taxes matter. A lot” (emphasis in the original), he writes. He does admit that he lacks “definitive proof that taxes, either state personal income or overall tax burden, are the number one reason money migrates.” [11] But he nonetheless published and is promoting a book devoted to arguing that taxes drive interstate migration and policymakers should sit up and take notice.
Based on their claims about why people migrate, Laffer, Moore, and Brown promise that states experiencing out-migration can stem that trend by cutting their personal income taxes, and that states with relatively high income taxes are doomed to suffer continued out-migration if they fail to do so.[12]
To buttress their claims, Laffer, Moore, and Brown cite data from the Internal Revenue Service that shows state-to-state migration by households based on their tax returns, as well as separate migration data from the U.S. Census Bureau. But they are selective in which data they present.
As we detail in the following sections, a fuller look at both IRS and Census data shows that people do not appear to be moving from state to state in response to the presence or absence of high income tax rates or any income tax at all. The raw data — confirmed by a series of careful academic studies — show that for the vast majority of people — including the vast majority of the rich — tax levels are a minor consideration or completely irrelevant. Even if some individuals relocate because they think their taxes are too high, or take state and local tax levels into account in deciding where to live, those cases are sufficiently rare that they should not drive state tax policy decisions.
Economies of Lower-Tax States Do Not Outperform Higher-Tax States
In addition to arguing that state income tax differences are a major driver of conscious migration decisions — the primary focus of this report — Laffer and Moore claim that states without an income tax attract many people from states with relatively high income taxes because their low taxes consistently cause their economies to grow faster and provide better employment opportunities for new arrivals. Several recent studies have decisively rebutted this claim:
Peter Fisher, “Grading Places: What Do the Business Climate Rankings Really Tell Us?” Good Jobs First, May 2013 (Chapter 2).
- When states were ranked according to their top personal income tax rates in 2007, there was no correlation between that ranking and their ranking among states in 2007-2011 growth in economic output, jobs, per capita income, median family income, or median annual wages.
Michael Leachman, Michael Mazerov, Vincent Palacio, and Chris Mai, “State Personal Income Tax Cuts: A Poor Strategy for Economic Growth,” Center on Budget and Policy Priorities, March 2013.
- Of the six states that enacted large state personal income tax cuts from 2000-07, the economies of three grew more slowly than the nation’s in the subsequent years and the economies of three grew more quickly. All of the latter three were major oil-producing states that benefitted from sharp increases in oil prices in the years after they implemented their tax cuts.
- States with the biggest 1990s tax cuts — all of which included substantial personal income tax cuts — grew jobs during the next economic cycle at an average rate one-third that of states that were more cautious in cutting taxes. The tax cutting states also had slower overall economic growth; in none of them did personal income grow faster than inflation during the next economic cycle.
- Six out of eight studies published in academic journals after 2000 examining the effect of state personal income taxes on state economic performance found no adverse impact.
Institute for Taxation and Economic Policy, “States with ‘High Rate’ Income Taxes Are Still Outperforming No-Tax States,” February 2013.
- From 2002-2011 the (inflation-adjusted) per-capita economic output of the nine states without a personal income tax grew an average of 5.2 percent while per-capita output grew 8.2 percent in the nine states with the highest income taxes (as measured by Laffer and Moore).
- Over the same period, real median household income fell 4.4 percent in the 9 no-income-tax states but a slightly lower 4.2 percent in the high-income-tax states.
- The annual unemployment rate averaged 6.0 percent in the no-income-tax states and 6.1 percent in the high-income-tax states.
People Move From Low-Income-Tax States to High-Income-Tax States With Surprising Frequency
To understand whether (as Laffer, Moore, and Brown claim) interstate tax differences play a big role in interstate migration, or whether instead (as other research has found) jobs, housing, family and so on are the major factors, it is useful to look carefully at all of the available migration data from the U.S. Census Bureau and the Internal Revenue Service. We need to look at both “gross” interstate migration flows — the separate flows into and out of each state — and “net” migration — the difference between the number of people moving in and the number of people moving out.
| Table 1 Majority of Households Leaving States Experiencing Out-migration Are Replaced by Households Moving In (1993-2011) |
|||
| Households Moving In |
Households Moving Out |
Share of Departing Households Replaced by New Arrivals |
|
| New York | 2,255,985 | 3,305,256 | 68.3% |
| Michigan | 997,761 | 1,357,506 | 73.5% |
| Illinois | 1,687,220 | 2,124,874 | 79.4% |
| Ohio | 1,349,461 | 1,681,673 | 80.2% |
| New Jersey | 1,371,140 | 1,700,408 | 80.6% |
| Connecticut | 623,463 | 758,947 | 82.1% |
| California | 3,738,367 | 4,505,949 | 83.0% |
| Louisiana | 665,534 | 788,215 | 84.4% |
| Rhode Island | 220,320 | 259,339 | 85.0% |
| Massachusetts | 1,107,443 | 1,286,269 | 86.1% |
| Iowa | 500,053 | 572,818 | 87.3% |
| North Dakota | 164,649 | 186,815 | 88.1% |
| Pennsylvania | 1,629,841 | 1,844,709 | 88.4% |
| Nebraska | 347,195 | 388,386 | 89.4% |
| Kansas | 638,916 | 697,917 | 91.5% |
| Hawaii | 382,115 | 412,721 | 92.6% |
| Wisconsin | 749,225 | 805,864 | 93.0% |
| District of Columbia | 401,834 | 427,268 | 94.0% |
| Indiana | 985,162 | 1,043,919 | 94.4% |
| Alaska | 255,755 | 266,638 | 95.9% |
| Minnesota | 767,414 | 799,198 | 96.0% |
| Vermont | 166,313 | 173,188 | 96.0% |
| Maryland | 1,290,089 | 1,326,004 | 97.3% |
| South Dakota | 195,024 | 200,118 | 97.5% |
| West Virginia | 322,357 | 328,992 | 98.0% |
| Mississippi | 522,109 | 528,788 | 98.7% |
| Source: Internal Revenue Service interstate migration data | |||
The distinction between net and gross is important. If the number of people moving from State A to State B is almost as big as the number of people moving from State B to State A, it greatly weakens the argument that there is a powerful force drawing people from one state to the other. It suggests instead that there are multiple forces pushing in both directions.
As it turns out, net migration in most states is indeed quite small compared with total or gross migration. Take, at the extreme, New York, with the nation’s third-largest number of out-migrants over 1993-2011; New York also had the nation’s fourth-largest number of in-migrants over that period.[13] As Table 1 shows, for every three households that left New York for another state, two were replaced by households moving in from other states. (Others were replaced by newly-formed households — say, recent college graduates — or international immigrants; New York’s total population actually grew modestly over this period.) New York is at the end of the spectrum; more typical is Nebraska, where nine out of ten households leaving for other states were replaced by households moving in. And in all of these states, as in New York, the out-migrants were replaced by newly formed households and/or foreign immigrants; no states lost population overall during this period.
If interstate differences in state income tax levels were the major driver of interstate migration, it is unlikely that a quarter million households would have migrated from no-tax Florida to New York in this period and that another quarter million would have migrated from no-tax Texas to California. People who wanted or needed to leave Florida or Texas would have had 49 other states to choose from, including eight others with no income taxes distributed across the country.[14]
The fact that a substantial majority of households moving out of states experiencing net out-migration were replaced by households moving in is a strong piece of evidence that income tax differences among states are not major drivers of migration patterns.
Many Specific State-to-State Migration Flows Are Inconsistent With Claims About the Impact of Taxes
Laffer, Moore, and Brown gloss over much of the detail on specific migration data about individual states. These data reveal patterns that are at odds with Laffer, Moore, and Brown’s claim that the absence of an income tax is a powerful migration magnet.
Consider the following facts about migration to the nine no-income tax states. (Again, all data cited cover 1993-2011, the entire period for which complete IRS data are available.)
- People move in and out of Texas in ways that suggest they don’t care about the state’s lack of an income tax. If Texas’ lack of an income tax were a major factor for migrants, one would expect that it would get far more in-migrants than states that have income taxes, lose few migrants to states with income taxes, and have little net migration either way with other no-income-tax states.
Yet none of those is the case. Arizona and North Carolina (both of which have income taxes) had almost as much net in-migration as Texas did. Yet both states are much smaller than Texas, with far fewer jobs for potential in-movers to fill. Five states with income taxes actually attracted more migrants from Texas than they sent to Texas.[15] Florida, with no income tax, sent more migrants to Texas than 46 other states. While Laffer, Moore, and Brown make much of Texas as a magnet for migrants from some states, they make no attempt to explain any of these apparent contradictions to the migration hypothesis.[16] Nor can they; these facts clearly illustrate the far more complex and nuanced story that jobs, housing and family matter far more than taxes. - Many people left no-income-tax Florida for states levying income taxes. Florida famously attracts a lot of interstate migrants — in fact, more than any other state. (As discussed below, this is mostly due to its longstanding status as a retirement destination, attributable in turn to its low housing costs and warm climate.) What’s often lost, however, is how many people leave the Sunshine State each year.
From 1993 to 2011, Florida lost households on net to 15 states, 11 of which levy an income tax. Georgia has an income tax, but almost 70,000 more households moved out of Florida to Georgia than moved the other way. Similarly, North Carolina is the Sunbelt state that had the highest top state individual income tax rate throughout this period, but some 53,000 more households moved from Florida to North Carolina than moved the other way.
Although Florida and Texas attract the most attention for their migration patterns, none of the other seven no-income-tax states are consistently experiencing net in-migration from other states, either. - Nevada had far less in-migration than Arizona, one of its income-taxing neighbors. Nevada attracted 37 percent fewer households (net) from other states than its next-door neighbor Arizona, which has a similar climate and levies an income tax. (As noted above, Arizona experienced the third-largest net in-migration of households from 1993-2011, after Florida and Texas.)
- New Hampshire lost migrants to income-taxing Maine and had little net in-migration. Overall, New Hampshire lost almost as many households to other states as it gained. Its lack of an income tax did not prevent some 373,000 households from moving out from 1993-2011, only slightly fewer than the 389,000 who moved in. All of New Hampshire’s net in-migration was attributable to in-migration from Massachusetts, mostly from the Boston metropolitan area.[17] More than a quarter of the workers in such households continue to work in Massachusetts, and their migration is not driven by the absence of an income tax in New Hampshire since they would still pay income taxes on their wages and salaries to Massachusetts.[18] Finally, Maine, which imposes the ninth-highest top income tax rate of any state, experienced net in-migration from New Hampshire from 1993-2011.
- Tennessee attracted far fewer migrants than did neighboring North Carolina. Net in-migration of households to North Carolina was more than double that of its neighboring state of Tennessee — this despite the fact that North Carolina levied the highest income tax rates in the Southeast throughout the period. Tennessee also lost almost 4,900 households to income-tax-levying Georgia.[19]
- Washington attracted fewer migrants from its chief source — California — than income-taxing Oregon did. Some 105,000 households moved from California to income-tax-levying Oregon between 1993 and 2011; that is almost a third more than the 79,000 households (net) that moved to no-income-tax Washington. The greater flow to Oregon than to Washington casts even greater doubt on the “voting with their feet” thesis when one takes into account what is likely a strong employment pipeline between the many Internet-related firms in California’s Silicon Valley and the high-tech cluster in the Seattle area centered around Microsoft and Amazon. Given this relationship one might reasonably have expected much larger net migration from California to Washington than from California to Oregon. Washington also lost households on net to its income-tax-levying neighbor Idaho.
- Wyoming’s net in-migration was miniscule. For the 18-year period as a whole, some 205,000 households moved into Wyoming, but 204,000 moved out. Moreover, Wyoming lost households via migration to its neighboring states of Colorado, Idaho, Montana, and Utah — all of which levy income taxes. This strongly suggests that what little net in-migration Wyoming enjoyed was attributable to the new popularity of the Rocky Mountain West in general rather than the state’s lack of an income tax.
- Finally, Alaska and South Dakota experienced net out-migration from 1993-2011. Virtually all cold, snowy states saw households leave over this period, as we will discuss below. Alaska and South Dakota’s inclusion in that group despite their not levying income taxes is further evidence that climate has had far more to do with recent patterns of in- and out-migration than have state and local taxes.
In sum, the detailed IRS data on state-to-state migration flows further undermine the case that the absence of a state income tax is a major attraction for people leaving their current state of residence.
Claims About Education and Wealth Levels Among Interstate Movers Don’t Hold Up
The detailed data also show deep flaws in Laffer and Moore’s related assertion that the people relocating from relatively high-tax states to relatively low-tax ones tend to have high incomes and high levels of education. In fact, such people are not leading the charge across state lines in most cases, and where they are, a large share of them are already retired or nearing retirement and therefore unlikely to start businesses and create jobs in their new home states.
Laffer and Moore assert that "when flight occurs away from an area, it is always the highest achievers and those with the most wealth, capital, and entrepreneurial drive who tend to ‘get out of Dodge’ first, leaving the middle class, and then eventually only the poor and disadvantaged, behind."[20] They seek to connect data on the incomes of interstate migrants to states’ top marginal income tax rates — the highest rate of tax paid on incomes exceeding a certain level, which disproportionately (and in some states only) affects the wealthy. In sum, Laffer and Moore are implying that most of the people “voting with their feet” and leaving high-tax states for low-tax ones are those likely to be subject to the highest tax rates in effect.[21] But once again, a fuller look at the data fails to support this impression.
National Data
People with more education and more income are, indeed, more apt to move state-to-state than people with less education and income — but not by much, and certainly not to the extent that one might imagine if they were in hot pursuit of low income taxes. According to the Census Bureau’s Current Population Survey, 6.7 percent of people living in households with incomes above $100,000 made one or more interstate moves between 2005 and 2010, compared to 6.0 percent of people from households with incomes between $50,000 and $75,000.[22] According to the Bureau’s American Community Survey, 1.9 percent of households with incomes between $50,000 and $75,000 made an interstate move each year on average during the 2008-12 period, compared to 2.0 percent of households with incomes above $75,000.[23] In other words, data for the U.S. as a whole indicate that the highest income groups are only somewhat more likely to make an interstate move than middle-income groups are. And, of course, these are nationwide data for all interstate moves, including many from states with relatively low income taxes to states with relatively high ones.
State-specific Census Data
American Community Survey (ACS) data permit an analysis of the incomes, education levels, and other characteristics of people who move between specific states.[24] They confirm that people moving from states with income taxes to those that lack them typically are neither particularly high-income nor particularly highly educated. (See Table 2.) Specifically, the ACS data show that:
- Primarily low- and moderate-income households, not high-income households, are migrating to states without income taxes, and they are doing so roughly in proportion to their overall shares of the population. For example, of the people who migrated from California to Nevada between 2008 and 2012, those with household incomes below $50,000 outnumbered those with incomes above $100,000 by a 4-to-1 margin. Of the people moving from New York to Florida, more than three times as many had incomes below $50,000 as above $100,000. The share of households in each income group who left California and New York did not skew toward the wealthy; in both states households with incomes below $50,000 outnumbered those with incomes above $100,000 by a 4-to-1 margin in the overall state population.
- The data in Table 2 also do not indicate a consistent tendency for upper-income households to migrate to no-income-tax states. The share of New York-to-Arizona migrants with incomes above $100,000 is the same as the share of New York-to-Florida migrants even though Arizona levies an income tax and Florida does not. A higher share of New Jersey-to-North Carolina migrants had high incomes than did New Jersey-to-Florida migrants even though North Carolina has an income tax.
- Nor are the people leaving “high-tax” states for “low-tax” states disproportionately highly educated professionals. For example, 32 percent of the households moving from New York to Florida were headed by someone who had at least a bachelor’s degree, and 25 percent of the households moving from California to Nevada did. As with income, these figures are roughly in line with the overall population; 32 percent of the U.S. population over age 25 has a bachelor’s degree or above. And for the most part, they’re in line with migration to income-taxing states.
| Table 2 Most Movers From States With Income Taxes to States Without Them Are Not High Income/Education |
||||
| Migration From | To | Share of migrants with incomes below $50,000 |
Share of migrants with incomes above $100,000 |
Share of migrants with at least a bachelor’s degree |
| California | Arizona | 64% | 16% | 31% |
| Nevada* | 61 | 14 | 25 | |
| Oregon | 61 | 15 | 41 | |
| Texas* | 55 | 21 | 39 | |
| Washington* | 51 | 19 | 37 | |
| Illinois | Arizona | 49 | 19 | 40 |
| Florida* | 51 | 20 | 41 | |
| Texas* | 51 | 20 | 50 | |
| Massachusetts | Florida* | 52 | 20 | 41 |
| New Hampshire* | 44 | 21 | 44 | |
| Michigan | Florida* | 59 | 12 | 27 |
| Tennessee* | 58 | 15 | 39 | |
| New Jersey | Florida* | 48 | 21 | 38 |
| North Carolina | 51 | 24 | 47 | |
| New York | Arizona | 47 | 17 | 42 |
| Florida* | 59 | 17 | 32 | |
| Georgia | 58 | 15 | 37 | |
| North Carolina | 57 | 15 | 45 | |
| South Carolina | 62 | 8 | 32 | |
| Texas* | California | 43 | 30 | 50 |
| All states with income taxes | All states without income taxes | 48 | 22 | 29 |
| Source: CBPP tabulations of American Community Survey data, 5-yr data for 2008-2012. Values shown subject to sampling error; not all differences between states may be statistically significant. Asterisk indicates state without income tax. | ||||
If income taxes were a major reason that more people move from California to Texas than vice versa, one would expect much greater representation of high incomes among the California-to-Texas migrants than among the Texas-to-California migrants. As it turns out, though, the reverse is true: only 21 percent of the California-to-Texas migrants have incomes over $100,000, compared with 30 percent of the Texas-to-California migrants. Similarly, fully 50 percent of the households who moved from Texas to California between 2008 and 2012 were headed by someone with at least a bachelor’s degree, compared with 39 percent of people who moved from California to Texas.
In short, if income taxes were causing interstate migration from states like California to states like Nevada and Texas, such migration would be most prevalent among the wealthy — yet what we see is the reverse. The Census data confirm that the interstate movement of high-income, high-education individuals is not well-related to the presence or absence of state income taxes.
Several other researchers have used the ACS data to evaluate whether high income taxes drive out-migration by the affluent and concluded that they do not. A study by Princeton University researchers found that California, New York, New Jersey, and Massachusetts all are experiencing a large net outflow of poor people, but a much smaller or zero net outflow of high-income earners. Despite the states’ relatively high tax rates, “these are the states where poor people are more likely to leave, and rich people are more likely to stay,” the researchers noted.[25]
California (as the earlier quote illustrates) is arguably Laffer and Moore’s poster child for high income taxes and high levels of out-migration, and it does have some of the highest taxes on high-income people in the nation. Yet a 2013 analysis of ACS data found net in-migration among the highest income group:
Even though California’s richer residents face high tax rates, lower-income households are more likely to leave. From 2005 to 2011, California lost 158 people with household incomes under $20,000 for every 100 who arrived. . . California actually gained a hair more people in the $200,000+ range than it lost (99 out per 100 in). The rich aren’t leaving California, but the poor and middle class are.[26]
| Table 3 Household Adjusted Gross Income of Interstate Movers and Non-Movers, States That Experienced Net Out-migration, 1993-2011 |
|||
| Avg AGI Non-movers |
Avg AGI Out-movers |
Avg AGI In-movers |
|
| Alaska | $65,640 | $47,000 | $40,984 |
| California | 66,433 | 56,194 | 53,834 |
| Connecticut | 82,575 | 78,208 | 81,007 |
| D. of Columbia | 67,930 | 60,120 | 53,114 |
| Hawaii | 55,956 | 42,981 | 44,121 |
| Illinois | 66,316 | 61,108 | 54,837 |
| Indiana | 56,724 | 49,741 | 47,541 |
| Iowa | 55,967 | 46,572 | 44,456 |
| Kansas | 58,973 | 49,781 | 47,993 |
| Louisiana | 50,041 | 44,166 | 41,280 |
| Maryland | 71,281 | 60,238 | 54,656 |
| Massachusetts | 73,969 | 62,486 | 60,027 |
| Michigan | 60,998 | 53,388 | 52,099 |
| Minnesota | 66,261 | 56,506 | 51,786 |
| Mississippi | 44,427 | 38,626 | 40,342 |
| Nebraska | 56,724 | 47,195 | 44,031 |
| New Jersey | 77,997 | 71,644 | 69,748 |
| New York | 66,015 | 62,130 | 54,483 |
| North Dakota | 52,873 | 40,069 | 37,024 |
| Ohio | 54,895 | 55,019 | 51,124 |
| Pennsylvania | 59,833 | 56,663 | 57,270 |
| Rhode Island | 60,567 | 54,166 | 53,937 |
| South Dakota | 51,785 | 39,952 | 45,115 |
| Vermont | 54,707 | 43,934 | 51,420 |
| West Virginia | 47,506 | 40,953 | 40,961 |
| Wisconsin | 60,315 | 51,814 | 51,689 |
State-specific IRS Data
The IRS migration data permit calculations of the average income levels of households remaining in a particular state, moving in, or moving out. Tables 3 and 4 provide those calculations for the states experiencing net out-migration and net in-migration, respectively.[27] They reveal the following:
- Most people moving across state lines states aren’t rich. Table 3 shows that the average household leaving one of the states that experienced net out-migration was solidly middle class. That was true even for the state with the highest average income per out-migrating household, Connecticut. There, the average leaving household had about $78,000 in income — upper-middle-class to be sure, but hardly rich.
- People leaving states don’t have much higher incomes than those moving in. Table 3 shows that the gaps in average income between the households that moved into most of these states and those that moved out ranged between small and trivial, typically within 10 percent. For example, the income differential between out-movers and in-movers in California — which imposes the highest top income tax rate of any state — was only 4.4 percent.” [28]
- In 23 out of the 24 income tax states that had a net loss of residents from 1993-2011, households who stayed in the state had higher incomes than those that left. Table 3 shows that in all but one of the states with income taxes that experienced net out migration over the 1993-2011 period, the average incomes of the households that stayed in the state exceeded those of the households that moved (in or out).[29] This also contradicts Laffer and Moore’s claim that high taxes on the rich are driving them out of these states. Rather, the pattern suggests that the people moving across state lines tend to be low- and moderate-income households seeking a higher standard of living through higher wages and/or a lower cost of living — many of them young people in an early stage of their careers.[30]
- Net in-migration states generally show the same income patterns as the net out-migration states. Table 4 provides these same comparisons for the 25 states that experienced net in-migration over the 1993-2011 period. The patterns are generally the same as those of the net out-migration states; the average income levels of the in-movers are middle-class, not affluent, and the differentials between them and the income levels of the out-movers are modest in most cases.
| Table 4 Household Adjusted Gross Income, Net In-migration States, 1993-2011 |
|||
| Avg AGI Non-movers |
Avg AGI Out-movers |
Avg AGI In-movers |
|
| Alabama | $51,481 | $44,845 | $46,024 |
| Arizona | 57,886 | 46,677 | 52,757 |
| Arkansas | 47,387 | 39,971 | 42,286 |
| Colorado | 65,543 | 51,023 | 53,679 |
| Delaware | 64,470 | 59,292 | 56,197 |
| Florida* | 55,638 | 45,958 | 61,357 |
| Georgia | 58,036 | 51,456 | 49,371 |
| Idaho | 52,662 | 40,204 | 46,107 |
| Kentucky | 51,467 | 45,059 | 43,662 |
| Maine | 52,257 | 44,254 | 51,376 |
| Missouri | 56,353 | 50,425 | 47,039 |
| Montana | 47,773 | 36,407 | 44,548 |
| Nevada* | 60,976 | 44,756 | 52,575 |
| New Hampshire* | 66,916 | 53,742 | 61,628 |
| New Mexico | 47,920 | 43,249 | 44,471 |
| North Carolina | 55,120 | 47,356 | 50,884 |
| Oklahoma | 50,602 | 43,192 | 40,763 |
| Oregon | 57,883 | 45,498 | 46,841 |
| South Carolina | 50,813 | 43,762 | 52,212 |
| Tennessee* | 52,720 | 46,233 | 47,619 |
| Texas* | 56,559 | 52,409 | 53,097 |
| Utah | 58,678 | 46,179 | 47,862 |
| Virginia | 67,477 | 58,195 | 55,540 |
| Washington* | 65,241 | 49,436 | 52,580 |
| Wyoming* | 59,953 | 41,410 | 50,173 |
| * States without income taxes | |||
- No-income-tax Florida is drawing a disproportionate share of higher-income taxpayers, but so are several other states with relatively high income taxes. For a few of the states in Table 4 experiencing net in-migration, the gaps in the average incomes of households moving in and those leaving are somewhat larger than those shown for the net out-migration states. This is especially evident in Florida, where the average income of the in-movers exceeds that of the out-movers by one-third. This provides some evidence that Florida may indeed be attracting a disproportionate share of high-income retirees. The same pattern may also be happening to a lesser extent in a few other no-income-tax states like Wyoming, Nevada, and New Hampshire. However, the same phenomenon of higher incomes for in-movers than out-movers is apparent with respect to several other states that impose (often relatively high) income taxes — Montana, South Carolina, Maine, and Idaho. This leads us to conclude that the data are showing that affluent people are more likely to be able to afford to move to another state after they retire, and that they do so largely independently of whether there is an income tax in their desired destination state.
- Texas’ and Tennessee’s experiences are inconsistent with the claim that the lack of an income tax is a major draw for the wealthy. In two no-income-tax states with high net in-migration during the 1993-2011 period — Texas and Tennessee — there is virtually no difference in the average income levels of in-movers and out-movers. With respect to these two states, in other words, there is essentially no evidence that their lack of an income tax is serving as a draw to affluent residents of income tax-levying states. And if the lack of an income tax isn’t drawing high earners, it is even less likely to be a draw for households with more modest incomes.
In sum, IRS data provide little evidence that high-income households are significantly more likely to “vote with their feet” in favor of no-income-tax states or that such households represent a large share of interstate movers.
Climate Is a Major Influence on Interstate Moves
The IRS data reveal a very strong Snowbelt-to-Sunbelt migration pattern that is substantially independent of the taxes in effect in either the origin or destination state. This suggests that a warm (or at least largely snow-free) climate may be more important than low or no income taxes in driving migration to states such as Florida, Nevada, Tennessee, and Texas.[31]
Table 5 shows that from 1993 to 2011 there has been net out-migration from the cold-weather states of Illinois, Michigan, New Jersey, New York, Ohio, and Pennsylvania to nearly all of the Sunbelt states, regardless of whether the latter impose income taxes. It is true that no-income-tax Florida has been the top Sunbelt destination for households leaving all six states. But the second choice for all of them has been Arizona or North Carolina — both of which levy income taxes — not the other Sunbelt non-income tax states of Nevada, Tennessee, and Texas. North Carolina, which had the highest top income tax rate among the Sunbelt states throughout this period, was the second most popular Sunbelt migration destination for four of the six states.
Neither is the amount of out-migration from Snowbelt states closely related to their income tax rates. For example, slightly more households moved from Pennsylvania to Florida (82,713) than from Ohio to Florida (81,348) from 1993 to 2011 despite the fact that Pennsylvania’s top income tax rate was only one-third as high as Ohio’s throughout the period. Illinois, Massachusetts, and Michigan had similar numbers of out-migrants to Florida despite widely varying income tax rates averaging 3.0 percent, 5.6 percent, and 4.3 percent respectively over this period.[32]
| Table 5 People Are Leaving “Snowbelt” States for Sunbelt States Regardless of Whether the Latter Impose Income Taxes |
||||||||||||||
| (x indicates that state shown in left column is one of the top ten sources of net in migration to state shown in top row) | ||||||||||||||
| AL | AZ | AR | FL* | GA | LA | MS | NV* | NM | NC | OK | SC | TN* | TX* | |
| Illinois | X | X | X | X | X | X | X | X | X | X | X | X | ||
| Michigan | X | X | X | X | X | X | X | X | X | X | X | X | X | X |
| New Jersey | X | X | X | X | X | X | X | X | X | X | X | |||
| New York | X | X | X | X | X | X | X | X | X | X | X | X | X | |
| Ohio | X | X | X | X | X | X | X | X | X | X | X | X | ||
| Pennsylvania | X | X | X | X | X | X | X | X | X | X | ||||
| * States without income taxes | ||||||||||||||
The specific state-to-state migration data show another powerful regional trend: net out-migration from virtually all of the Great Plains states. Among them, only Missouri and Oklahoma have experienced net in-migration; more households moved out than moved in in Kansas, Iowa, Minnesota, Nebraska, North Dakota, and South Dakota.[33] This pattern has occurred despite a fairly wide range of both income tax and overall tax levels, including the absence of a personal income tax in South Dakota.
Florida: A Unique Situation
Florida’s migration patterns deserve a more detailed discussion. The IRS data reveal that between 1993 and 2011 Florida attracted more interstate migrants, on net, than any other state — nearly 1.8 million people. Data from the Census Bureau’s American Community Survey substantiate what common sense would suggest: migration to Florida is substantially driven by people retiring there, drawn by the state’s year-round warm weather (and the outdoor recreation opportunities that affords), the enormous infrastructure of businesses that has grown up over decades catering to the needs of this population, and the self-perpetuating cycle of people choosing to retire there because many of their friends do.
Table 6 shows just how heavily Florida’s in-migration is driven by retirees or people approaching retirement. Nationwide, only 13 percent of all interstate movers are 55 or over. But 45 percent of all the people who moved from New York to Florida in the past five years were 55 or older, and the shares were as high or higher for in-migrants from Illinois, Massachusetts, Michigan, and New Jersey. Data on the employment status of in-migrants tell essentially the same story: 44 percent of the migrants to Florida from New Jersey said they were not in the labor force, and this share ranged up to 49 percent for migrants from Massachusetts. (Someone who is retired and not seeking work is “not in the labor force” for reporting purposes, and it is likely that the vast majority of in-migrants to Florida reporting such an employment status are, in fact, retirees.)
| Table 6 Florida Is Unusually Attractive to Retirees, but Other No-Income-Tax States Aren’t Age and Employment Status of Interstate Migrants, 2008-2012, Select States |
|||
| Migration From | To | Share of migrants age 55 and older | Share of migrants not in the labor force |
| Ntl. Average | 13% | ||
| Illinois | Florida* | 45% | 45% |
| Massachusetts | Florida* | 55 | 49 |
| Michigan | Florida* | 50 | 42 |
| New Jersey | Florida* | 46 | 44 |
| New York | Florida* | 45 | 46 |
| California | Arizona | 25 | 30 |
| California | Nevada* | 27 | 29 |
| California | Texas* | 16 | 19 |
| California | Oregon | 28 | 32 |
| California | Washington* | 22 | 25 |
| Illinois | Arizona | 35 | 43 |
| Illinois | Florida* | 45 | 45 |
| Illinois | Texas* | 17 | 16 |
| New Jersey | Florida* | 46 | 44 |
| New Jersey | North Carolina | 38 | 31 |
| New York | Florida* | 45 | 46 |
| New York | South Carolina | 38 | 40 |
| Michigan | North Carolina | 22 | 25 |
| Michigan | Tennessee* | 31 | 31 |
| Massachusetts | New Hampshire* | 19 | 22 |
| Source: CBPP tabulations of American Community Survey data, 5-yr data for 2008-2012. Values shown subject to sampling error; not all differences between states may be statistically significant. States without income taxes indicated with asterisk. Specific state-to-state pairs shown in the table were chosen to illustrate retirement movements frequently attributed to differences in income tax policies. Alaska, South Dakota, and Wyoming are not major retirement destinations and thus are omitted from this table. | |||
In other words, it is retirees that are driving migration to Florida. Florida’s climate and retirement-oriented infrastructure are unique, but its lack of an income tax is not. To see whether the lack of an income tax is particularly attractive to retirees more generally, we can examine other state-to-state migration patterns.
As it turns out, other states that are common destinations for older migrants seem to draw them regardless of whether they have an income tax. Retirement-age migrants make up approximately the same share of Californians moving to income-tax levying Oregon and Arizona as they make up of retirement-age migrants to no-income-tax Nevada and Washington. The same is true with respect to migrants from Michigan to income-tax levying North Carolina and no-income-tax Tennessee.
And while retirees drive Florida’s in-migration from the North to a unique degree, they are also driving migration to states in the South that do have an income tax. Illinois-to-Arizona and New Jersey-to-North Carolina migrants are nearly as likely to be 55 and older as are migrants from Illinois and New Jersey to Florida. Some 38 percent of the people who migrated from New York to South Carolina were over 55 even with South Carolina’s top income tax rate of 7.0 percent.
Finally, the data suggest that the absence of an income tax in Texas and New Hampshire has not made either of those states particularly attractive for retirees from the states that otherwise are significant sources of in-migration for them.
In any event, the policy significance of retiree migration patterns is unclear. There is reason to doubt that attracting (or retaining) retirees is a particularly strong strategy for strengthening a state’s economy, as the jobs that they create may tend to be low-skill service-sector jobs.[34]
But what is clear is that retirees and other people are likely to continue to move from the Snowbelt to the Sunbelt. As we will discuss below, moving to Florida, Nevada, and Texas from many Snowbelt states (as well as from California) would result in housing cost savings that greatly exceed the combined state and local tax savings. Given the powerful and long-standing migration from the Northeast, Great Lakes, and Plains states to the Sunbelt — including to states that have income taxes as well as to those that don’t — elected officials in cold and snowy states like Kansas, Ohio, and Wisconsin who have approved deep income tax cuts in the name of improving their economies should harbor no illusions that this is likely to stem — let alone reverse — their states’ longstanding net out-migration trends.[35]
Movers From “High-Tax” to “Low-Tax” States Often Save More in Housing Costs Than in Taxes
As discussed above, surveys of movers and numerous statistical studies confirm that the jobs and income side of the household ledger has a much larger effect on interstate migration decisions than the expense side does. Nonetheless, differences in the cost of living likely affect to some degree families’ decisions about where to live. Taxes are a cost of living, but they aren’t the only cost of living that varies from place to place, and as it turns out they are not the most important one.
| Table 7 Savings in Mortgage Costs Are Larger Than Savings in Housing Costs for Many Interstate Moves Change In Mortgage Costs Vs. Change In Direct State/Local Taxes, 2010, for Typical $75,000 Household |
|||
| A family’s move from the largest city in: | . . . to the largest city in: | Would change its mortgage payment by: | . . . but would change its direct household taxes by: |
| California | Oregon | -$9,994 | -$898 |
| Idaho | -12,145 | -1,787 | |
| Arizona | -12,210 | -2,561 | |
| Texas | -14,307 | -3,516 | |
| Colorado | -9,133 | -2,257 | |
| Nevada | -9,521 | -3,638 | |
| Washington | -3064 | -2,531 | |
| Connecticut | Florida | -7,511 | -9,120 |
| Illinois | Tennessee | -5,806 | -2,624 |
| Texas | -5,112 | -2,642 | |
| Arizona | -3,015 | -1,687 | |
| Florida | -1,313 | -1,283 | |
| Colorado | 62 | -1,383 | |
| Indiana | Texas | -383 | -2,645 |
| Maine | Florida | -823 | -2,311 |
| Massachusetts | Florida | -8,966 | -1,686 |
| New Hampshire | -7,327 | -2,570 | |
| Michigan | Texas | 777 | -4,314 |
| Arizona | 2,874 | -3,359 | |
| Minnesota | Texas | -4,268 | -3,101 |
| Missouri | Texas | -647 | -3,718 |
| New Jersey | Virginia | -4,622 | -1,681 |
| Texas | -7,469 | -3,275 | |
| Florida | -3,670 | -1,916 | |
| New York | North Carolina | -9,436 | -378 |
| South Carolina | -10,683 | -1,051 | |
| Virginia | -8,472 | -2,051 | |
| Florida | -7,520 | -2,286 | |
| Texas | -11,319 | -3,645 | |
| North Carolina | Texas | -1,883 | -3,267 |
| Ohio | Tennessee | -1,596 | -4,016 |
| Texas | -902 | -4,034 | |
| Pennsylvania | North Carolina | -2,562 | -1,923 |
| Florida | -646 | -3,831 | |
| Texas | -4,445 | -5,190 | |
| Virginia | -1,598 | -3,596 | |
| Wisconsin | Texas | -88 | -3,498 |
| Source: See text for assumptions and methodology. See Appendix 1 for more detailed results. | |||
Housing cost differentials between states are often much bigger than tax differentials and thus a much more plausible factor to the extent that relocating households are considering costs at all. As Table 7 shows, we’ve calculated the change in annual state and local tax and mortgage payments that a typical family with a $75,000 income might have realized in 2010 by moving from the largest city in one state to the largest city in another.[36] Our analysis found that savings in housing costs exceed state and local tax savings in many of the state-to-state migration flows that Laffer, Moore, and Brown strongly attribute to tax differentials.[37]
Our analysis finds as follows:
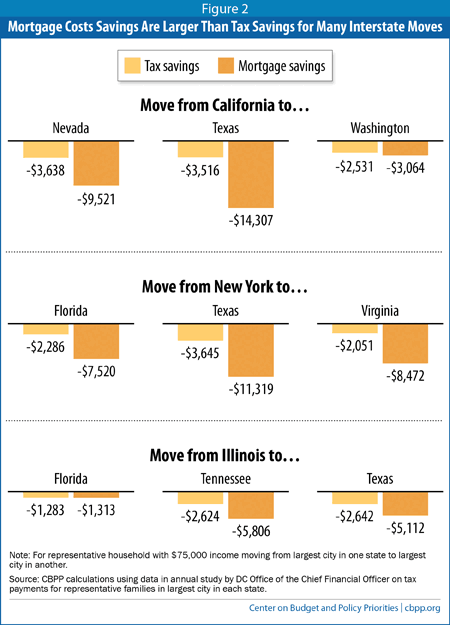
- Someone who leaves Los Angeles for the largest city in seven of the eight top destination states will save anywhere from twice as much to 11 times as much in mortgage costs as they will in state and local taxes.[38] Laffer and Moore often point to no-income-tax Nevada and Texas as places where Californians are fleeing to escape the state’s high taxes, but, as Figure 2 shows, if a Los Angeles family had moved to Las Vegas or Houston its mortgage savings would have been 2.6 times and 4.1 times its state and local tax savings, respectively.[39]Image
- The same is true for New York. In this case, however, the mortgage savings for someone moving to all five of its major destination states would have been even larger — at least three times the state and local tax savings.
- The same is true for Massachusetts, where moves from Boston to the largest cities in New Hampshire and Florida (neither of which levies an income tax) would have yielded mortgage savings 2.9 and 5.3 times the state and local tax savings.
- The same is true in Illinois, Minnesota, and New Jersey. A move from Chicago or Newark to Houston or Miami would have resulted in greater mortgage savings than tax savings. A move from Minneapolis to Houston would have resulted in mortgage savings greater than tax savings as well.
- In Michigan, Ohio, Pennsylvania, and Wisconsin, potential tax savings could play a greater role in out-migration than potential housing cost savings. Housing costs in Detroit, Columbus, and Milwaukee are so low that only very small mortgage savings at best can be had in any major destination state; accordingly, tax savings dominate.
Most Academic Studies Find That State and Local Taxes Are Not a Major Factor in Interstate Migration Decisions
A number of sophisticated statistical studies of the impact of state and local taxes on interstate migration of individuals and households have been conducted over the last 25 years or so. Taken as a whole, the research strongly refutes the claim that state and local taxes have a significant impact on migration.[40]
Seven economists (or groups of economists) have published studies on state taxes and migration in peer-reviewed economics journals since 2000. Six of the seven concluded that taxes were not a major driver of interstate moves. For example:
- Mark/McGuire/Papke (2000): “Taxes on individuals (personal income, sales, and residential property taxes) . . . are not estimated to be important influences on residential [location] choice [within the Washington, DC metropolitan area].”
- Coomes/Hoyt (2008): “[T]he annual effect of [income] tax differentials on state tax bases is small. In most high-tax states, the effect is likely to be only a few hundred potential taxpayers lost each year.”
- Leigh (2008): “[O]verall, more redistributive state taxes do not appear to have a substantial impact on the composition or volume of interstate migration.”
- Guis (2011): “[A]lthough taxes have a statistically-significant effect on the migration decision, the overall impact of taxes on this decision is minimal.”
- Young/Varner (2011): “[T]he effect of the new tax bracket [for taxpayers earning more than $500,000] is negligible overall. Even among the top 0.1 percent of income earners, the new tax did not appreciably increase out-migration.”
- Conway/Rork (2012): “The results from all analyses overwhelmingly find no credible effect of state income tax breaks on elderly migration.”
The seventh study concluded that “[C]onsumer-voters appear to be attracted by lower state income tax burdens and lower property tax burdens, whereas they appear to be attracted to higher per pupil public primary and secondary outlays.”[41] The author’s dual findings hardly suggest that cutting taxes is a good strategy for attracting people to a state. K-12 education represents almost one-fifth of total state and local expenditures, and any significant cuts in state or local taxes are likely to force cuts in that spending.
Eight additional studies on the impact of state taxes on migration that were not published in academic journals have been released since 2000. Six of the eight find either that state income taxes have no effect or that the effect is small and/or inconsistent. For example:
- Wallace (2002): “We find that in a number of cases, income tax differentials are reflected in wages. [That is, wages tend to be higher in higher-income tax states so that the wage-earner achieves a comparable after-tax wage.] This . . . would explain why state income tax variables themselves do not explain migration in previous studies.”
- Bakija/Slemrod (2004): “[O]ur evidence is consistent with the idea that some rich individuals flee states that tax them relatively heavily, although it may reflect other modes of tax avoidance as well. . . . [T]he estimated amounts of . . . revenue loss from the flight are not large relative to the revenue collected by the taxes. . . .”
- Gurley-Calvez/Harper (2006): “High income filers are . . . less likely to exit states with higher income tax rates. . . .”
- Thompson (2011): “If anything, higher state income taxes are shown to decrease the numbers of people leaving a state. Taxes do appear to influence the choice of which state to live in once a person has decided to move, but the impact is modest.”
- Dodds (2012): “These results do not imply that migration is not affected by [after-tax] income differences. They do imply that the income differences from a large change in state taxes are not large enough to produce significant changes in migration.”
- Young/Varner (2012): “Migration is a very small component of changes in the number of millionaires in California. While the millionaire population sees a typical year-to-year fluctuation of more than 10,000 people, net migration [of millionaires] sees a typical year-to-year fluctuation of 50 to 120 people. At the most, migration accounts for 1.2 percent of the annual changes in the millionaire population.”
The authors of the remaining two studies do consider their results to indicate that high income taxes spur out-migration and discourage in-migration:
- Vedder (2003): “The analysis above establishes a rather strong and persuasive case that high taxation leads to out-migration.”
- Cohen/Lai/Steindel (2012): “[Our] results appear to indicate a meaningful association between state income taxes and domestic [interstate] migration.”
Conclusion
Contrary to the claims of some conservative economists, there is little evidence that interstate differences in state and local tax levels are significant drivers of interstate migration. Less than 3 percent of Americans move across state lines in an average year, despite significant and persistent interstate differences in tax levels. Economists and demographers have known for decades that those who do move are primarily seeking more plentiful and higher-paying jobs — with cheaper housing, a desired physical and cultural environment, and proximity to family and friends being important secondary considerations. There is no evidence that any more than a tiny minority of people making an interstate move are deliberately “voting with their feet” in favor of a state that levies lower taxes. Internal Revenue Service data reveal that tens of thousands of people move each year from lower-tax states into higher-tax states, or choose to move to one state when another with even lower taxes is right next door.
Such conservatives seek to paint a misleading picture of high-income, highly-educated professionals and business owners fleeing states that levy relatively high and progressive personal income taxes to states that don’t. If this were true, Silicon Valley wouldn’t be in California and Wall Street wouldn’t be in New York, and neither would attract hordes of bright college graduates each year. In fact, Census data reveal that the overwhelming majority of people moving to the no-income-tax states are low- and moderate income, not high-income; a disproportionate share are retirees for whom cheaper housing and warmer climates are the principal attractions.
None of this is to say that no one ever leaves a state because they’ve decided their taxes are too high or that relatively low taxes aren’t sometimes a factor attracting people to certain states. The absence of an income tax in Florida may be a factor in attracting relatively affluent retirees to that state, for example. But most people participating in the major migration flows from relatively high-tax Snowbelt states — plus California — to most of the non-income-tax states also realize housing cost savings several times larger than their tax savings. Accordingly, even where the absence of an income tax may be a factor attracting someone to a state, it is almost by definition a secondary one.
The lessons for policymakers are clear. First, policymakers in states that levy income taxes and that have been experiencing steady net out-migration of their residents for decades should harbor no illusions that the income tax cuts that several have enacted — and others are considering — will reverse this trend. Their departing residents are not “voting with their feet” for lower taxes. Their young people are leaving in search of better job opportunities and (in the case of the Plains states) the amenities of big-city living; their senior citizens are cashing in their housing wealth for smaller living quarters in warmer, or at least relatively snow-free, climes. These trends do indeed present economic challenges, and solutions are not easy to find. It is abundantly clear, however, that deep income tax cuts are not a cost-effective strategy. They are more likely to reduce than enhance a state’s attractiveness as a place to live by leading to deterioration in the quality of critical public services.
Second, policymakers in most relatively high tax states have considerable room to increase income taxes on the affluent before potential effects on migration figure in the decision. If elected officials perceive a need for additional revenue or are looking for a way to finance modest tax cuts for low- and middle-income families, adding a new top bracket for millionaires — as Maryland, New Jersey, New York, and Oregon have done recently — is a viable option that will not be undermined by increased out-migration.
Working-age residents moving away from a state is far more likely to be a symptom of a faltering state economy than the cause. States experiencing (net) out-migration need to focus their efforts on cost-effective economic development and job-creation strategies that can provide more income-earning opportunities for their current residents across the entire range of skill levels. And, of course, they need to maintain and enhance their investments in public safety, roads, bridges, public transit, parks, and education to ensure that they are places where businesses can find the skilled employees they need and where any employees those businesses are recruiting can be sure that their children will attend high-quality schools in safe, pleasant neighborhoods.
In the final analysis, these are the approaches most likely to ensure that states can continue to retain and attract highly skilled, healthy, productive citizens and help create a vibrant economy that offers them the promise of a high standard of living. To implement them, states need adequate revenues, ideally raised in a fair manner with the affluent paying their share. Income tax cuts aimed at solving a non-existent “tax flight” problem will be self-defeating for states.
| Appendix 1 Savings in Mortgage Costs Are Larger Than Savings in Housing Costs for Many Interstate Moves Change in Mortgage Costs Vs. Change in State/Local Taxes, 2010, for Typical $75,000 Household |
||||||||||
| Move From | Move To | Taxes in Origin |
Taxes in Dest. |
Mortgage in Origin |
Mortgage in Dest. |
Change in Taxes |
Change in Mortgage |
Change in Mortgage ÷ Change in Taxes |
||
| Los Angeles | CA | Portland | OR | $7,704 | $6,806 | $20,549 | $10,555 | -$898 | -$9,994 | 11.1 |
| Boise | ID | 7,704 | 5,917 | 20,549 | 8,404 | -1,787 | -12,145 | 6.8 | ||
| Phoenix | AZ | 7,704 | 5,143 | 20,549 | 8,339 | -2,561 | -12,210 | 4.8 | ||
| Houston | TX | 7,704 | 4,188 | 20,549 | 6,242 | -3,516 | -14,307 | 4.1 | ||
| Denver | CO | 7,704 | 5,447 | 20,549 | 11,416 | -2,257 | -9,133 | 4.0 | ||
| Las Vegas | NV | 7,704 | 4,066 | 20,549 | 11,028 | -3,638 | -9,521 | 2.6 | ||
| Seattle | WA | 7,704 | 5,173 | 20,549 | 17,485 | -2,531 | -3064 | 1.2 | ||
| Bridgeport | CT | Miami | FL | 14,667 | 5,547 | 17,552 | 10,041 | -9,120 | -7,511 | 0.8 |
| Chicago | IL | Memphis | TN | 6,830 | 4,206 | 11,354 | 5,548 | -2,624 | -5,806 | 2.2 |
| Houston | TX | 6,830 | 4,188 | 11,354 | 6,242 | -2,642 | -5,112 | 1.9 | ||
| Phoenix | AZ | 6,830 | 5,143 | 11,354 | 8,339 | -1,687 | -3,015 | 1.8 | ||
| Miami | FL | 6,830 | 5,547 | 11,354 | 10,041 | -1,283 | -1,313 | 1.0 | ||
| Denver | CO | 6,830 | 5,447 | 11,354 | 11,416 | -1,383 | 62 | 0.0 | ||
| Indianapolis | IN | Houston | TX | 6,833 | 4,188 | 6,625 | 6,242 | -2,645 | -383 | 0.1 |
| Portland | ME | Miami | FL | 7,858 | 5,547 | 10,864 | 10,041 | -2,311 | -823 | 0.4 |
| Boston | MA | Miami | FL | 7,233 | 5,547 | 19,007 | 10,041 | -1,686 | -8,966 | 5.3 |
| Manchester | NH | 7,233 | 4,663 | 19,007 | 11,680 | -2,570 | -7,327 | 2.9 | ||
| Detroit | MI | Houston | TX | 8,502 | 4,188 | 5,465 | 6,242 | -4,314 | 777 | -0.2 |
| Phoenix | AZ | 8.502 | 5,143 | 5,465 | 8,339 | -3,359 | 2,874 | -0.9 | ||
| Minneapolis | MN | Houston | TX | 7,289 | 4,188 | 10,510 | 6,242 | -3,101 | -4,268 | 1.4 |
| Kansas City | MO | Houston | TX | 7,906 | 4,188 | 6,889 | 6,242 | -3,718 | -647 | 0.2 |
| Newark | NJ | Virginia Beach | VA | 7,463 | 5,782 | 13,711 | 9,089 | -1,681 | -4,622 | 2.7 |
| Houston | TX | 7,463 | 4,188 | 13,711 | 6,242 | -3,275 | -7,469 | 2.3 | ||
| Miami | FL | 7,463 | 5,547 | 13,711 | 10,041 | -1,916 | -3,670 | 1.9 | ||
| New York | NY | Charlotte | NC | 7,833 | 7,455 | 17,561 | 8,125 | -378 | -9,436 | 25.0 |
| Columbia | SC | 7,833 | 6,782 | 17,561 | 6,878 | -1,051 | -10,683 | 10.2 | ||
| Virginia Beach | VA | 7,833 | 5,782 | 17,561 | 9,089 | -2,051 | -8,472 | 4.1 | ||
| Miami | FL | 7,833 | 5,547 | 17,561 | 10,041 | -2,286 | -7,520 | 3.3 | ||
| Houston | TX | 7,833 | 4,188 | 17,561 | 6,242 | -3,645 | -11,319 | 3.1 | ||
| Charlotte | NC | Houston | TX | 7,455 | 4,188 | 8,125 | 6,242 | -3,267 | -1,883 | 0.6 |
| Columbus | OH | Memphis | TN | 8,222 | 4,206 | 7,144 | 5,548 | -4,016 | -1,596 | 0.4 |
| Houston | TX | 8,222 | 4,188 | 7,144 | 6,242 | -4,034 | -902 | 0.2 | ||
| Philadelphia | PA | Charlotte | NC | 9,378 | 7,455 | 10,687 | 8,125 | -1,923 | -2,562 | 1.3 |
| Miami | FL | 9,378 | 5,547 | 10,687 | 10,041 | -3,831 | -646 | 0.2 | ||
| Houston | TX | 9,378 | 4,188 | 10,687 | 6,242 | -5,190 | -4,445 | 0.9 | ||
| Virginia Beach | VA | 9,378 | 5,782 | 10,687 | 9,089 | -3,596 | -1,598 | 0.4 | ||
| Milwaukee | WI | Houston | TX | 7,686 | 4,188 | 6,330 | 6,242 | -3,498 | -88 | 0.0 |
Appendix 2
Recent Academic Research on the Impact of State Taxes on Interstate Migration Journal Articles
The following seven post-1999 studies were published in peer-reviewed academic journals. They are listed in order of publication date.
- Mark/McGuire/Papke.[42] This 2000 paper did not look at migration directly, but rather at the impact of interstate tax differentials in the Washington, D.C., metropolitan area on where households chose to live. It concluded: “Taxes on individuals (personal income, sales, and residential property taxes) . . . are not estimated to be important influences on residential [location] choice.”
- Coomes/Hoyt. [43] This 2008 study examined whether interstate movers who move into a metropolitan area that spans one or more states are more likely to move into the state with the lowest income tax rate. The study found that they were, but only if the differences in income tax rates were relatively large. Although the study did find statistically significant impacts of income tax differentials on the choice of location, the authors noted that:
Multistate MSAs [metropolitan areas] present arguably the greatest opportunity for choosing a low-tax state [because no significant sacrifice in employment options is necessary], but collectively account for only around 600,000 in-movers annually. Since only around five percent of US households move between counties each year, and state income tax rates exert but one influence on choice of state, the magnitude of the annual effect of [income] tax rate differentials on state tax bases is small. In most high-tax states, the effect is likely to be only a few hundred potential taxpayers lost each year.
The authors observed that “in those MSAs with large differences in state income tax rates, the impacts [on location choice] could be substantial,” but also pointed out that:
In evaluating these impacts it is important to consider other policy differences — several of the multistate MSAs with the greatest state income tax differences. . . have large offsetting state sales tax differences, which we find also exert an important influence on migrants.
- Leigh.[44] This 2008 study primarily focused on evaluating the validity of a well-known 1998 article co-authored by prominent economist Martin Feldstein. The Feldstein article found that the possibility of out-migration in reaction to progressive state taxation forces employers to pay high-skilled workers higher wages to a degree that fully offsets the redistributive effects of the taxes. As part of his analysis, Leigh directly examined the impact of interstate differences in state income taxes on interstate migration. His statistical results led him to the conclusion that “[O]verall, more redistributive state taxes do not appear to have a substantial impact on the composition or volume of interstate migration.”
- Cebula.[45] This study looked at the correlation between the states’ rates of net in-migration from 2000 to 2007 and their income tax, property tax, and education spending levels, after adjusting for (holding constant) interstate differences in employment growth, cost of living, and climate. It found that higher state income taxes were associated with lower rates of net in-migration and that this relationship was statistically significant. However, the author made no attempt to evaluate the magnitude of the correlation or its economic significance. The study also found that higher levels of state and local spending on K-12 education reduce out-migration and increase in-migration. Thus, if a state cuts its income tax and reacts to the reduction in revenue by cutting spending on education, the education cuts will partially offset the positive migration effects of the tax cut.
- Guis.[46] A study published in 2011 focused on the impact of interstate differences in income tax levels on the migration of people between the ages of 19 and 43. The author concluded that “although taxes have a statistically-significant effect on the migration decision, the overall impact of taxes on this decision is minimal.”
- Young/Varner (New Jersey).[47] New Jersey enacted a new tax bracket applicable to taxpayers with taxable incomes above $500,000 in 2004. The tax rate levied on this bracket was 8.97 percent, 2.6 percentage points (40 percent) higher than the previous top rate. Because the tax rate increase was so large, because it was focused on high-income people allegedly most likely to move in response, and because so much of New Jersey’s population lives within a short distance of Pennsylvania, New York, and Connecticut, this tax increase provided a good test of the likely maximum migration response to state income tax increases. Sociologists Cristobal Young and Charles Varner were given access to all New Jersey tax returns filed by interstate movers in the four years before and the four years after the tax increase. In a 2011 study, they compared the rate of net out-migration for taxpayers with incomes above $500,000 and other high-income households with incomes of $200,000-$500,000. They found that while the rate of (net) out-migration did increase slightly for those taxpayers falling within the new bracket (5.1 per thousand), it also increased by a roughly comparable amount (4.6 per thousand) for the other high-income group. Moreover, the 0.5 per thousand difference was not statistically significant. They found somewhat larger out-migration effects for millionaires who earn all their income from investments (that is, those not tied to local jobs), millionaires over age 65, and the super-rich, but some of these effects were not statistically significant. They concluded: “the effect of the new tax bracket is negligible overall. Even among the top 0.1 percent of income earners, the new tax did not appreciably increase out-migration.” Finally, after assuming that none of the millionaire lawyers, investment bankers, and corporate CEOs who would be induced to migrate out of New Jersey from the tax increase would be replaced in their positions, Young/Varner estimated that the annual loss of income tax revenue attributable to the small amount of induced out-migration would offset less than 2 percent of the roughly $1 billion annual revenue gain from the rate increase.[48]
- Conway. Since 1998, University of New Hampshire economist Karen Smith Conway has co-authored several papers examining the impact of state and local spending and taxes on the interstate migration patterns of the elderly; she is unquestionably the leading academic expert on this issue.[49] Overall, her research finds evidence that the absence of income and estate taxes may have a weak effect on the states to which elderly people choose to move, but that the presence of these taxes does not drive elderly people out of the states levying them. Even these relationships, however, are often not statistically significant or uniform across various possible measures of tax levels. For example, her 2001 paper finds:
[T]wo key taxes — death taxes and personal income taxes — are only consistently important [in explaining migration] for one of the three tax sets [i.e. measures of taxes]. . . . The complexity and variety of personal income tax systems make it unlikely that a single measure, like tax share or effort index, would adequately capture their effect. . . . Our results suggest that states may enjoy some limited success in using their policies to attract the elderly. . . . Low welfare spending, low death and personal income taxes, and exemptions for pension income all make a state a more desirable destination; however, the results for the specific taxes are sensitive to how they are measured. Taken together, our analyses suggest state fiscal policy may affect elderly migration, but not as definitively as several past studies suggest.
Her 2006 study concludes:
Our research casts doubt on the view that the elderly react to state EIG [estate, inheritance, and gift] tax policies in making their migration decisions. In fact, using two different analyses, we find some evidence that the causality may instead run in the opposite direction — states that experience high elderly in-migration may be more likely to subsequently eliminate or reduce their incremental EIG taxes. . . . Contrasting our results with those of Bakija and Slemrod (2004), who find evidence that the very rich elderly are discouraged by high EIG taxes, leads to an interesting conclusion. It is entirely possible that the residence choice of the very rich elderly is affected by EIG taxes, whereas the overall level of elderly migration is not. . . . These [rich] individuals are also the ones with the most to gain from moving and perhaps the easiest method of doing so (especially those with multiple homes) — simply switching their legal domicile [i.e., not actually moving].
Conway’s 2012 study is the most rigorous and sophisticated, using data from four consecutive national censuses (2007 through 2000), two different measures of migration, four different sets of tax measures, and different subsets of the elderly (high-income versus low-income, young versus old, healthy versus disabled).[50] It focuses again on the impact of state EIG taxes as well as on the specific provisions of state income taxes affecting the elderly, such as extra exemptions and exclusions from taxation of social security and pension income. Conway summarizes the study and its findings as follows:
Our research investigates whether little examined, yet much debated, elderly income tax breaks — such as exemptions for retirement income — have an effect on elderly interstate migration behavior. . . . The results from all analyses overwhelmingly find no credible effect of state income tax breaks on elderly migration. . . . Past research has shown (and we confirm) that elderly state income tax breaks and EIG taxes have both varied a great deal across states and over time, while elderly migration patterns have remained largely the same. . . . Put simply, state tax policies toward the elderly have changed substantially while elderly migration patterns have not. . . . Our results, as well as the consistently low rate of elderly interstate migration, should give pause to those who justify offering state tax breaks to the elderly as an effective way to attract and retain the elderly. [Emphasis added.]
Working Papers
The eight working papers listed below include statistical analyses of the impact of state taxes on interstate migration. All were released after 1999. None were published in academic journals.
- Wallace.[51] This 2002 paper sought to explain why “state income taxes . . . have largely been found to have little impact on migration in previous studies.” It found evidence that higher income taxes prevailing in northeastern and western states are offset in the form of somewhat higher wages, reducing the incentive to move to states with lower income taxes: “We find that in a number of cases, income tax differentials are reflected in wages. This capitalization would explain why state income tax variables themselves do not explain migration in previous studies.”
- Vedder.[52] The author looked at the correlation between the net number of people moving into or out of a state from 1990-1999 and overall state/local tax levels, after adjusting for interstate differences in climate, per capita income levels, and rate of income growth over the period. He found that higher tax levels were associated with higher net out-migration. Vedder concluded: “The analysis above establishes a rather strong and persuasive case that high taxation leads to out-migration.” It should be noted, however, that the statistical analysis found that higher state economic growth also led to outmigration — a result contrary to the findings of numerous other studies and one that casts doubt on the validity of the entire analysis.[53]
- Bakija/Slemrod.[54] The only statistical study Laffer and Moore cite was published in 2004 by leading public finance economists Jon Bakija and Joel Slemrod. It focuses on the location of people rich enough to have to file a federal estate tax return. It does not look at their migration directly, but rather at the correlation between state and local tax levels and the states from which federal estate tax returns are filed. The study finds that interstate differences in estate and sales tax levels actually have a greater impact on the state of residence of the rich than state income and local property taxes do; one of the two methodologies used in the paper casts doubt on whether income and property taxes have any impact on migration at all.[55] The authors write that “our evidence is consistent with the idea that some rich individuals flee states that tax them relatively heavily, although it may reflect other modes of tax avoidance as well.” (This would include spending a majority of a year at a vacation home in order to claim legal residence in the state in which it is located.) They also conclude that “the estimated amounts of . . . revenue loss from the flight are not large relative to the revenue collected by the taxes. . . .” Consistent with the findings of this 2004 study, Slemrod recently wrote in a critique of Laffer’s position: “What differentiates [the rate of growth in per-capita income in] the two sets of states [non-income-tax states and high-income tax states] is population growth, and I don’t think the income tax policy differences were instrumental in driving this.”[56]
- Gurley-Calvez/Harper.[57] This 2006 study used household-specific data to identify interstate migration and to calculate specific state income tax liabilities for the households in the sample. The study examines whether high state income taxes drive high-income households to leave the states levying them. Contrary to the assertions of Laffer, Moore, and Brown, the study actually found that “High-income filers are . . . less likely to exit states with higher income tax rates. . . .” [Emphasis added.] The authors posit that “this result reflects a preference for one tax collection method over another. For instance, people might generally prefer paying income taxes to property taxes.”
- Thompson.[58] This study examined the influence of average income tax rates and total state/local “own-source” revenues on the rates of out-migration and net migration, after adjusting for (holding constant) interstate differences in housing affordability, unemployment rates, per capita incomes, education spending, and several other factors. It found that “if anything, higher state income taxes are shown to decrease the numbers of people leaving a state” — either because they substituted for other taxes more likely to have that effect or because they enabled income tax rates on more mobile, highly-educated young workers to be kept low. The study found that “Taxes do appear to influence the choice of which state to live in once a person has decided to move, but the impact is modest.” It also concluded that “if states use the revenues from higher taxes to create jobs, reduce unemployment, and reduce property crime, the small negative impacts from taxes [on migration] can be easily overcome” by the attractive effects of the new jobs and lower crime rate.
- Dodds.[59] This study examined the impact on migration trends in and out of Montana in the five years before and the five years after a large income tax cut that went into effect in 2005. The tax cut averaged $10,000 for taxpayers with over $250,000 in income but less than $50 on average for taxpayers with less than $100,000 in income. As with the Young/Varner studies, the author had complete access to all Montana income tax returns. Contrary to the expectations of tax cut proponents, out-migration of high-income taxpayers actually increased after the tax cut, and at a faster rate than out-migration of lower-income taxpayers that received little tax savings. In-migration of high-income households did increase after the tax cut, but it also increased for the low-income households that did not benefit significantly. Montana experienced net in-migration after the tax cut averaging 2000 households annually, but only about 40 of them were households with incomes above $250,000. The author concluded:
These results do not imply that migration is not affected by [after-tax] income differences. They do imply that the income differences from a large change in state taxes are not large enough to produce significant changes in migration.
- Cohen/Lai/Steindel.[60] This report uses the IRS migration data for the 1992-2009 period to examine the impact of interstate differences in income tax rates, unemployment rates, and housing costs on interstate moves.[61] It finds that interstate income tax differentials have a statistically significant impact on migration rates, but that these effects diminish significantly as the distance between the states increases.[62] Given that most of the focus of people like Laffer, Moore, and Brown is on long-distance moves — such as from California to Texas and from New York to Florida — the results can hardly be viewed as strong support for their argument. Admittedly, the authors themselves interpret their findings as indicating “a meaningful association between state income taxes and domestic [interstate] migration.” However, their estimate of the impact of the New Jersey tax increase was 2,500-4,000 households per year, at a time when outmigration was averaging 22,000 households per year. Even under the unrealistic assumption that none of the jobs of the leavers were filled, they also concede that the income tax loss from the out-migration was only about 12 percent of the initial revenue gain.
- Young/Varner (California).[63] Young and Varner also obtained access to California tax returns and used these data to evaluate whether a 1996 tax cut for high-income taxpayers reduced their rate of out-migration and whether a 2005 tax increase boosted it. They found:
Migration is a very small component of changes in the number of millionaires in California. While the millionaire population sees a typical year-to-year fluctuation of more than 10,000 people, net migration sees a typical year-to-year fluctuation of 50 to 120 people. At the most, migration accounts for 1.2 percent of the annual changes in the millionaire population.”
With respect to the 1996 tax cut, Young/Varner found that the highest-income taxpayers, who received the largest tax cut, moved into a net in-migration status in the first two years following it, but at a slower rate than did the low- and moderate-income households whose taxes weren’t reduced. With respect to the 2005 tax increase (a new bracket for incomes above $1 million with a rate one percentage point higher than the previous top rate), Young/Varner found that the rate of out-migration actually fell slightly among those who had to pay the higher taxes.
End Notes
[1] Current Population Survey data calculated by Raven Molloy, Christopher Smith, and Abigail Wozniak for Figure 1 of their working paper, “Declining Migration within the U.S.: The Role of the Labor Market,” Center for Economic Studies, U.S. Census Bureau, November 2013; (http://www2.census.gov/ces/wp/2013/CES-WP-13-53.pdf). Used by permission. In an earlier paper, the same authors observed that “[I]nternal U.S. migration seems to have reached an inflection point around 1980.” “Internal Migration in the United States,” Journal of Economic Perspectives, Summer 2011.
[2] Cumulative Estimates of the Components of Resident Population Change for the United States, Regions, States, and Puerto Rico: April 1, 2000 to July 1, 2009 (NST-EST2009-04); https://www.census.gov/popest/data/state/totals/2009/tables/NST-EST2009-04.xls.
[3] Calculated from data presented in Ping Ren, “Lifetime Mobility in the United States: 2010,” U.S. Census Bureau, November 2011. An unknown number of these households had lived outside their state of birth at some point and returned to it, but that indicates that family and cultural ties are a strong influence on location choices — which is exactly the point.
[4] Prominent surveys of the literature on the causes of interstate migration include: George I. Treyz, Dan S. Rickman, Gary L. Hunt, and Michael J. Greenwood, “The Dynamics of U.S. Internal Migration,” The Review of Economics and Statistics, May 1993; Michael J. Greenwood, “Internal Migration in Developed Countries,” in M.R. Rosenzweig and O. Stark, eds., Handbook of Population and Family Economics (Amsterdam: Elsevier, 1997); William F. Frey, “Internal Migration,” in Paul Demeny and Geoffrey McNicoll, eds., International Encyclopedia of Population, New York: Macmillan, 2003. Several more recent papers have attempted to explain the recent slowdown in interstate migration. See, for example: Raven Molly, Christopher L. Smith, and Abigail Wozniak, “Declining Migration within the U.S.: The Role of the Labor Market,” U.S. Census Bureau, Center for Economic Studies Working Paper, November 2013; and, Greg Kaplan and Sam Schulhofer-Wohl, “Understanding the Long-Run Decline in Interstate Migration,” Federal Reserve Bank of Minneapolis Working Paper 697, February 2013.
[5] Alicia Sasser, “Voting with Their Feet? Local Economic Conditions and Migration Patterns in New England,” New England Public Policy Center Working Paper 09-1, 2009, p. 11. (Notwithstanding the title, the study looks at the correlation between economic conditions, housing affordability, and interstate migration in the 48 contiguous states, not just New England.)
[6] Calculated from the 2013 Annual Social and Economic Supplement to the Census Bureau’s Current Population Survey. Job and family considerations have been the major factors driving interstate moves throughout the period in which the Census Bureau has been surveying movers. See: Raven Molloy, Christopher L. Smith, and Abigail Wozniak, “Declining Migration within the U.S.: The Role of the Labor Market,” U.S. Census Bureau, Center for Economic Studies Working Paper, November 2013, Figure 3.
[7] 2013 Current Population Survey.
[8] Arthur B. Laffer and Stephen Moore, Rich States, Poor States: ALEC/Laffer State Economic Competitiveness Index, published by the American Legislative Exchange Council, seven editions, 2007-2014.
Travis H. Brown, How Money Walks: How $2 Trillion Moved Between the States, and Why It Matters, Second Edition, 2013.
Laffer, Moore, and Brown (together with Rex Sinquefield) recently co-authored a book bringing their analyses together. See An Inquiry into the Nature and Causes of the Wealth of States, John Wiley & Sons, Inc., April 2014.
New Hampshire and Tennessee have limited personal income taxes that apply to interest and dividends but not to wages, salaries, pensions, or small business profits.
[9] “For three decades now Americans have been voting with their feet against the high taxes and debilitating policies of the Northeast — creating a massive brain drain from the region.” Rich States, Poor States, first edition, 2007, p. 16.
“People are moving out of high-tax states and into states with low or no personal income taxes, so they get to keep more of their income and have a greater say in how they spend it. They are voting with their feet.” How Money Walks, p. 40.
[10] Rich States, Poor States, 6th Edition, May 2013, p. 43.
[11] How Money Walks, p. 238. Emphasis in original.
[12] Laffer/Moore: “In this study we have identified 16 policy variables that have a proven impact on the migration of capital — both investment capital and human capital — into and out of states. . . The 16 factors [include] . . .
- Highest marginal personal income tax rate [with high rates being economically harmful] . . .
- Progressivity of the personal income tax system [with progressive rates being harmful] . . .
[I]f state legislators will make it a priority to improve on each of these performance measures, they will be rewarded with faster growth and more jobs in their states . . .” (Rich States, Poor States, first edition, 2007, p. 22.)
Brown: “You want to attract people? Your tax policies must be pro-growth. And that means that state taxes, particularly personal income taxes, must be low. The lower (or non-existent) they are, the more growth.” “Some states — like Florida and Texas — got it right, while some states — like California and New York — got it wrong (and continue to get it wrong).” (How Money Walks, pp. 241, 237.)
[13] We have chosen this time period throughout this report because it is the entire period for which complete Internal Revenue Service migration data are available, including both the number of households moving and their incomes.
The IRS interstate migration data report year-to-year changes in the filing address of tax returns filed using the same Social Security number. Since households consisting of a married couple (with or without children) usually file one joint return, and since unmarried persons also file one tax return, a tax return is a reasonable proxy for a household. The Tax Foundation has developed a useful tool for obtaining and manipulating the IRS migration data. It is available at http://interactive.taxfoundation.org/migration/.
[14] Someone who wants to live in a no-income-tax state in the Northeast can choose New Hampshire; in the Southeast, Florida and Tennessee; in the Northern Plains, South Dakota; in the Southern Plains, Texas; in the Northern Rockies, Wyoming; in the Southwest, Nevada; and in the Pacific Northwest, Washington and Alaska.
[15] The five were Arizona, Colorado, the District of Columbia, Georgia, and Oregon.
[16] Laffer and Moore devoted a chapter of the 2009 edition of Rich States, Poor States to touting Texas’ economic performance vis-à-vis California’s. They wrote: “The insiders in Sacramento don’t need to look to the original Thirteen Colonies to see small government in action. In fact, we direct their attention only three states to the east. Not only does Texas lack a highly progressive income tax — it doesn’t have one at all! . . . [T]he Texas success story illustrates everything we have been recommending for California all these years.”
[17] Kenneth M. Johnson, “The Changing Faces of New Hampshire: Recent Demographic Trends in the Granite State, Carsey Institute, University of New Hampshire, 2007, p. 21.
[18] Robert Nakosteen, Michael Goodman, and Dana Ansel, “MASS.migration,” Massachusetts Institute for a New Commonwealth, December 2003, p. 21.
[19] Of course, Tennessee lacks North Carolina’s and Georgia’s Atlantic coastline, but, once again, that is the point. In the real world, lifestyle amenities are overwhelmingly likely to trump potential tax savings as a residential location determinant.
[20] Rich States, Poor States, first edition, 2007, pp. 15, 21.
[21] Brown disavows any claim that high-income people make up the bulk of those leaving states in response to high income taxes: “Does this mean that all the people who migrated are millionaires who are just trying to keep more of their money? No. As we saw, the AGIs [adjusted gross incomes] per person [relocating to low- or no-income-tax states] are fairly modest.” (How Money Walks, p. 63). Nonetheless, Brown’s analysis is inconsistent with his disclaimer; he makes the same mistake Laffer and Moore do. How Money Walks seeks to demonstrate a strong correlation between interstate differences in income tax levels and total net migration. Yet when Brown compares state income tax levels, he always looks at the top income tax rate that exists in the state even though in many states only a small minority of households would be subject to that rate and therefore might have their decisions regarding whether to leave that state even hypothetically affected by it. To demonstrate a correlation between total net migration and income tax levels, Brown would have to look at the income tax liability or effective income tax rate of the average income household in each state, not high-income households. But he does not do this.
[22] David K. Ihrke and Carol S. Faber, “Geographical Mobility: 2005 to 2010,” U.S. Census Bureau, December 2012, Table 2.
[23] “Geographic Mobility by Selected Characteristics in the United States,” ACS Table S0701, 2008-2012 ACS 5-Year Estimates.
[24] Through 2000, the Census Bureau’s decennial long-form survey asked respondents if they were living in a different location from where they had been five years earlier. The annual ACS, which was substituted for the Census long form in 2005, changes the time frame on that question to one year earlier. Accordingly, the data are no longer compatible, and no analysis of the income, education, and employment characteristics of households moving between specific states spanning these two periods is any longer possible. That is why the discussion in this report of the migration-related information that can be drawn from the ACS is limited to the most recent five-year period for which ACS data are available, 2008-2012.
[25] Cristobal Young, Charles Varner, and Douglas S. Massey, “Trends in New Jersey Migration: Housing, Employment, and Taxation,” Woodrow Wilson School, September 2008, pp. 22, 24.
[26] Jed Kolko, “Jobs Aren’t Leaving California for Texas, but People Are,” Forbes, February 12, 2013; http://www.forbes.com/sites/trulia/2013/02/12/jobs-arent-leaving-california-for-texas-but-people-are/. Emphasis added.
[27] Tables 3 and 4 were generated using the Tax Foundation tool described in Note 13. They report Adjusted Gross Income data that the Tax Foundation has adjusted for inflation to put each year’s data in constant 2010 dollars. They cover the entire time interval for which the IRS has reported income data for migrating taxpayers, 1993 to 2011.
[28] Table 3 also shows that in five states levying income taxes that experienced net out-migration the households who moved in actually had higher incomes than those that moved out — a fact pattern again inconsistent with Laffer and Moore’s argument.
[29] The only exception to this was Ohio, where the households that left the state had a trivially-higher average income level than those that remained. Alaska and South Dakota had net out-migration but do not levy income taxes.
[30] Nationally, 11.6 percent of people between the ages of 25 and 29 moved across state lines at least once between 2005 and 2010. This is by far the highest interstate migration rate of any age cohort. David K. Ihrke and Carol S. Faber, “Geographical Mobility: 2005 to 2010,” U.S. Census Bureau, December 2012.
[31] A 2008 survey conducted by the Pew Research Center found that “When it comes to places to live, Americans like it hot. By nearly two-to-one, the public says it prefers a hotter place to live over one with a colder climate.” See Pew Social and Demographic Trends, “Most Like It Hot,” March 18, 2009; www.pewsocialtrends.org/2009/03/18/most-like-it-hot/. Careful statistical research also finds that cold winter weather is a major driver of out-migration. See, for example, Martin Shields, Stephan J. Goetz, and Quiyan Wang, “Out-Migration from the Northeast U.S.: The Relative Roles of Economic and Amenity Differentials,” in Gary Paul Green, Steven C. Dellar, and David W. Marcouiller, Eds., Amenities and Rural Development, 2005.
[32] The migration figures in this paragraph come from the IRS data. Historical tax rate data come from the Federation of Tax Administrators.
[33] North Dakota has experienced significant net in-migration in the past few years due to its booming energy sector. This, in turn, can be traced to the relatively recent development of “fracking” technology.
[34] See: Jim Dewey and Dave Denslow, “Baby Boom Retirees and Florida’s Job Structure,” April 3, 2012. (“Retirees and the local workers who produce goods and services for them drive up housing prices and thus crowd out workers that produce for export beyond the local area. . . . Absent urgent and aggressive policy intervention, Florida’s workers that retire over the next 20 years are likely to be replaced by less educated and less skilled workers less suited to the knowledge economy, and the gap between Florida’s average job skill and the national average is likely to widen substantially.”)
[35] The powerful migration patterns of people aged 50-74 away from most Snowbelt states and to many Sunbelt locations over the past two decades is illustrated dramatically in Kenneth M. Johnson, Richelle Winkler, and Luke T. Rogers, “Age and Lifecycle Patterns Driving U.S. Migration Shifts,” Carsey Institute Issue Brief No. 62, Spring 2013. See Figure 4. Available at http://www.netmigration.wisc.edu/IB-Johnson-Migration-US-Counties-web.pdf.
[36] The source of the tax payment data in Table 7 is the 2010 edition of an annual District of Columbia study that calculates the income, property, sales, and car tax liability of the same hypothetical family profile at different income levels in the largest city in each state. It is available at http://cfo.dc.gov/sites/default/files/dc/sites/ocfo/publication/attachments/ocfo_10study.pdf. The mortgage payment calculation assumes that the $75,000 family bought the home whose value was used in the DC study as the basis for the local property tax calculation. (These home values vary by city and by income level of the family.) There were two exceptions. The home value for Philadelphia from a National Association of Realtors annual survey of median sales prices was substituted for Philadelphia because the value in the DC study diverged sharply from it and seemed implausibly low. The Realtors’ study was also used to select a home value for Miami. The DC study treats Jacksonville as the largest city in Florida, a fluke resulting from Jacksonville’s merger with its surrounding county. (The Realtors’ survey is available at http://www.realtor.org/sites/default/files/reports/2013/embargoes/hai-5-9-frggkltio/metro-home-prices-q1-2013-single-family-2013-05-09.pdf ). Property taxes for Miami were recalculated based on this home value and the actual rates in effect there in 2010. Finally, the mortgage calculation assumes a 30-year mortgage for 80 percent of the selling price at an annual interest rate of 4.69 percent (annual average interest rate for 2010 as reported by Freddie Mac Primary Mortgage Market Survey).
[37] In general, Appendix 1 reports the results shown in Table 7 for all state-to-state pairs for which the IRS migration data show at least 1000 household moves between 2009 and 2010 tax filings. Even though they did not reach the 1,000 households threshold, a few additional state-to-state pairs were included in both Appendix 1 and Table 7 because they often figure in the debate regarding the impact of income taxes on migration (for example, migration from Massachusetts to no-income tax New Hampshire). Conversely, some state-to-state pairs were omitted because they represent migration from one relatively high-tax state to another (for example, New York to California), one non-income-tax state to another (for example, Nevada to Texas), a lower-tax state to a higher tax state, or because increased housing costs exceeded tax savings, rendering any migration attributable to factors other than a reduced cost of living.
[38] In the eighth location, Seattle, the mortgage savings are still modestly larger than the tax savings.
[39] Many experts have pointed to high housing costs as the principle driver of California’s post-1990 out-migration, noting that it is middle-class families, not the affluent, who have been most likely to move: “California continues to show net domestic out-migration, which began in the 1990s. A significant portion of that population loss has been attributed to the high cost of living in coastal California. . . . As the [housing] bubble began to burst, however, domestic outmigration away from areas stretching from San Francisco to San Diego, where high housing prices fueled “middle-class flight” to the interior West, has now retrenched. . . During the middle of the decade, younger couples and singles with moderate education levels dominated the groups leaving California for lower-cost housing and job opportunities in surrounding states.” Frey, pp. 9-10. See also: Jed Kolko, “Jobs Aren’t Leaving California for Texas, but People Are,” Forbes, February 12, 2013.
[40] Complete citations to the studies and additional detail about their methodologies and findings may be found in Appendix 2 of this report. Notes to the appendix also indicate that a few additional journal and non-journal studies are not listed here because their results can reasonably be viewed as “trumped” by the findings of the studies that are listed.
[41] Richard J. Cebula, “Migration and the Tiebout-Tullock Hypothesis Revisited,” American Journal of Economics and Sociology, 2009.
[42] Stephen T. Mark, Therese J. McGuire, and Leslie E. Papke, “The Influence of Taxes on Employment and Population Growth: Evidence from the Washington, D.C. Metropolitan Area,” National Tax Journal, 2000.
[43] Paul A. Coomes and William H. Hoyt, “Income Taxes and the Destination of Movers to Multistate MSAs,” Journal of Urban Economics, 2008.
[44] Andrew Leigh, “Do Redistributive State Taxes Reduce Inequality?” National Tax Journal, March 2008.
[45] Richard J. Cebula, “Migration and the Tiebout-Tullock Hypothesis Revisited,” American Journal of Economics and Sociology, 2009. The author subsequently updated his analysis with two additional years of data and reached similar conclusions. See: “The Effect of State and Local Taxes and Spending on Migration,” State Tax Notes, June 28, 2010.
[46] Mark Gius, “The Effect of Income Taxes on Interstate Migration: An Analysis by Age and Race,” Annals of Regional Science, 2011.
[47] Cristobal Young and Charles Varner, “Millionaire Migration and State Taxation of Top Incomes: Evidence from a Natural Experiment,” National Tax Journal, June 2011.
[48] Young and Varner’s methodology has been criticized for effectively assuming that members of their two comparison groups (over $500,000 and $200,000-$500,000) who were living outside New Jersey and were potential in-migrants to the state were equally distributed among the other states and faced the same relative economic incentives to move (or not move) to New Jersey. That criticism has some validity, but it would not affect Young and Varner’s basic conclusion that any revenue leakage from any net out-migration resulting from the tax increase would represent a small fraction of the revenue gain. In a 2008 paper using the same income tax data, Young and Varner looked at out-migration and in-migration separately. Even when they assumed that all of the decline in in-migration in the $500,000+ income group in 2004-2006 was attributable to the tax increase (even though it had started prior to it), they concluded that the revenue leakage from migration comprised less than five percent of the initial revenue gain. See: Cristobal Young, Charles Varner, and Douglas S. Massey, “Trends in New Jersey Migration: Housing, Employment, and Taxation,” Woodrow Wilson School of Public Affairs, September 2008, p. 34.
[49] Karen Smith Conway and Andrew J. Houtenville, “Do the Elderly ‘Vote with Their Feet?’” Public Choice, 1998; Conway and Houtenville, “Elderly Migration and State Fiscal Policy: Evidence from the 1990 Census Migration Flows,” National Tax Journal, 2001; Conway and Houtenville, “Out with the Old, in with the Old: A Closer Look at Younger Versus Older Elderly Migration,” Social Science Quarterly, 2003; Conway and Jonathan C. Rork, “State ‘Death’ Taxes and Elderly Migration: The Chicken or the Egg?” National Tax Journal, 2006; Conway and Rork, “No Country for Old Men (Or Women): Do State Tax Policies Drive Away the Elderly?” National Tax Journal, 2012.
[50] Conway cites four post-2000 papers that conduct a statistical analysis of the impact of state and local taxes on interstate migration of the elderly. (See: Lewis Gale and Will Carrington Heath, “Elderly Internal Migration in the United States Revisited,” Public Finance Review, 2000; William Duncombe, Mark Robbins, and Douglas Wolf, “Retire to Where? A Discrete Choice Model of Residential Location,” International Journal of Population Geography, 2001; Duncombe/Robbins/Wolf, “Place Characteristics and Residential Location Choice Among the Retirement-Age Population,” Journals of Gerontology, Series B, 2003; Ali Sina Onder and Herwig Schlunk, “State Taxes, Tax Exemptions and What They Reveal about Elderly Migration,” Vanderbilt University Working Paper, 2009.) These studies examine elderly migration data over a much more limited time frame than does the 2012 Conway study and with a much narrower range of statistical models. Accordingly, to the extent that they conflict, the latter study’s findings can reasonably be considered definitive.
[51] Sally Wallace, “The Effect of State Income Tax Structure on Interstate Migration,” Andrew Young School of Policy Studies (Georgia State University) Fiscal Research Program Report No. 79, December 2002.
[52] Richard Vedder, “Taxation and Migration,” The Taxpayer’s Network, June 2003.
[53] Among the other readily-identifiable flaws in this study was a failure to adjust for (that is, hold constant) interstate differences in housing costs and the number of persons in migrating households. Moreover, the measure of taxes included taxes paid by businesses, which are likely to be invisible to households and therefore unlikely to influence their migration decisions.
[54] Jon Bakija and Joel Slemrod, “Do the Rich Flee from High State Taxes? Evidence from Federal Estate Tax Returns?” National Bureau of Economic Research Working Paper 10645, July 2004.
[55] “[C]ompared to the conditional logit [statistical methodology], the income tax effect [under the linear regression methodology] becomes a bit smaller. . . and the property tax effect becomes much larger. . . but the standard errors increase so much that we can no longer be confident in these particular results.” P. 30.
[56] “State Tax Cuts: Is Arthur Laffer All Wet?” August 2, 2013, http://www.pbs.org/newshour/rundown/2013/08/state-tax-cuts-is-arthur-laffer-all-wet.html.
[57] Tami Gurley-Calvez and Katherine Harper, “Do Taxes Affect Interstate Location Decisions for High-Income Households?” Proceedings of the 99th Annual Conference on Taxation of the National Tax Association, 2006.
[58] Jeffrey Thompson, “The Impact of Taxes on Migration in New England,” Political Economy Research Institute (University of Massachusetts), April 2011. Notwithstanding the title of this report, the statistical analysis examined migration between all 48 contiguous states. Thompson subsequently performed a similar statistical analysis with similar findings. It was included in the following publication: Amy Hanauer and Tim Krueger, “The Tax Flight Myth: People Move for Jobs, Housing, Family — Not Taxes,” Policy Matters Ohio, 2013.
[59] Dan Dodds, Senior Economist, Montana Department of Revenue, “State Income Taxes and Interstate Migration: Results of a Natural Experiment in Montana,” July 2012.
[60] Roger Cohen, Andrew Lai, and Charles Steindel, “Tax Flight Has Tangible Effects on Income Tax Revenue,” State Tax Notes, February 20, 2012.
[61] Another study done around the same time also uses the IRS data and a similar methodology. See: Antony Davies and John Pulito, “Tax Rates and Migration,” Mercatus Center (George Mason University) Working Paper 11-31, August 2011. This paper is markedly inferior to the Cohen/Lai/Steindel paper, however, because it uses only four years of IRS data and fails to control for interstate differences in housing costs.
[62] It also needs to be pointed out that in the version of this paper originally released (available at www.state.nj.us/treasury/csef/OCE-Migration-Study.pdf), the effect of income tax differentials on migration was of borderline statistical significance. The more recent State Tax Notes version of the paper shows higher statistical significance after the authors added an additional year of data and a control variable never used to the author’s knowledge in any other migration study (the foreclosure rate in the destination state).
[63] Charles Varner and Cristobal Young, “Millionaire Migration in California: The Impact of Top Rates,” unpublished, 2012; http://www.stanford.edu/group/scspi/_media/working_papers/Varner-Young_Millionaire_Migration_in_CA.pdf.
More from the Authors