Tax Foundation Figures Do Not Represent Typical Households' Tax Burdens
Figures May Mislead Policymakers, Journalists, and the Public
To project the day when “the nation as a whole has earned enough money to pay its total tax bill for [the] year,”[1] the Tax Foundation calculates the average tax rate by measuring tax revenues as a share of the economy (similar to estimates of total revenues as a share of Gross Domestic Product, or GDP).
In a progressive tax system like that of the United States, only upper-income households on average pay federal tax at rates that are equal to or above federal revenues as a share of the economy. Estimates from the nonpartisan Urban-Brookings Tax Policy Center show that low- and middle-income households (about 80 percent of all households) will pay a smaller share of their income in federal taxes this year than the Tax Foundation’s average tax rate.
The Tax Foundation acknowledges this issue in a methodology paper accompanying its report, noting that its estimates reflect the “average tax burden for the economy as a whole, rather than for specific subgroups of taxpayers.”[2] Consequently, those who report on Tax Freedom Day as if it represents the day until which the typical American must work to pay his or her taxes are misinterpreting these figures and inadvertently fostering misimpressions about the taxes that most Americans pay.
Moreover, the Tax Foundation suggests that people spend part of the year working for the government and part of it working for themselves, becoming “free” only when they get to work for themselves. In reality, taxes pay for services that benefit us every day and are central to our idea of freedom. Few Americans would likely feel more “free” if Tax Freedom Day came earlier in the year because the federal government stopped providing for national security, ensuring homeland security, conducting food safety inspections, or testing prescription drugs.
Finally, the report’s estimates of state and local tax burdens suffer from a number of serious methodological flaws (see box below).
Tax Foundation’s Federal Tax Rate Estimates Driven by High-Income Taxpayers
The Tax Foundation’s Tax Freedom Day calculation relies on an estimate of what it labels the total effective tax rate: total tax receipts as a share of total national income.[3] That estimate includes an estimate of the total federal effective tax rate.
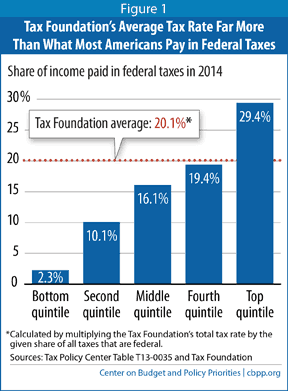
The Tax Foundation estimates that in 2014, the federal effective tax rate will be 20.1 percent. But as Figure 1 shows, the nonpartisan Urban-Brookings Tax Policy Center (TPC) estimates that households in each of the bottom four quintiles of the income scale will on average pay less than 20.1 percent of their income in federal taxes in 2014.[4] Only households in the top quintile will face, on average, a higher rate.[5] The TPC estimates suggest that roughly 80 percent of U.S. households pay a smaller share of their incomes in federal taxes than the overall federal effective tax rate.[6]
Data from the Congressional Budget Office (CBO, Congress’ official scorekeeper) paint a very similar picture to the TPC estimates. The CBO data, based on actual tax returns, are available through 2010. In 2010, the Tax Foundation’s Tax Freedom Day materials suggested that the average federal tax rate was 17.2 percent, but CBO data for 2010 suggest that more than 80 percent of U.S. households paid less than 17.2 percent of their incomes in federal taxes that year.[7]
The following example shows how the Tax Foundation’s methodology can overstate the tax burdens of the typical family. Suppose four families with incomes of $50,000 each pay $2,500 in taxes (5 percent of their income) while one wealthy family with income of $300,000 pays $90,000 in taxes (30 percent of its income). Total income among these five families is $500,000, and the total amount paid in taxes is $100,000. Thus, 20 percent of the total income of the five families goes to pay taxes. But it would be highly misleading to conclude that 20 percent is the typical tax burden for families in this group.
Tax Foundation’s Average Figures Can Be Misleading
To be sure, an average figure like the one that the Tax Foundation has calculated can yield useful information. Revenues measured as a share of the economy or as a share of national income is the most reliable metric for comparing revenue levels over time or across countries. The problem occurs when the tax burden figure that the Tax Foundation calculates is taken to represent the tax burden of the typical American worker.
For example, in 2006, the Wall Street Journal wrote, “The Tax Foundation reports that the average American works 116 days of the year to pay their tax bill (emphasis added).”[8] In 2011, CNNMoney reported that, “Americans will spend an average of 28% of their income to pay federal, state and local taxes this year . . . That means you will need to work 102 days — more than three months — just to earn enough to pay your tax bill. So on April 12 you will be free of your 2011 tax burden.”[9]
Already in 2014, DailyFinancewrote an article titled “3 Months Into 2014, You’re Likely Still Working for the Tax Man,” which describes Tax Freedom Day as “how many working days it takes for the average American worker to earn enough to pay all his federal, state and local taxes…”[10] Most people reading these articles would likely assume that the figures cited apply to the average or typical family. Yet that is not the case.
Tax Foundation’s State-by-State Estimates Are Seriously Flawed
The Tax Foundation’s proclamations of state Tax Freedom Days are meaningless because the report’s state-by-state estimates are flawed. They are not useful for discussing the level of taxes paid by typical households or for assessing the tax choices made by a given state’s policymakers, for at least four reasons.
- They overstate middle-class tax levels. About two-thirds of the taxes in the Tax Foundation calculations are federal taxes. The amount of federal tax paid by the residents of a state thus has a large impact on that state’s Tax Freedom Day. Since, as this analysis explains, the Tax Foundation methodology substantially overstates the federal tax burden of middle-class families, the Tax Freedom Day figures for each state also substantially exaggerate the tax burdens of middle-class families in that state.
- They reflect state affluence rather than state taxes. Because the federal income tax system is progressive, states with greater numbers of high-income residents pay more federal taxes than states with fewer high-income residents. As the Tax Foundation acknowledges, “This means higher-income states celebrate Tax Freedom Day later.” Yet by trumpeting state-level Tax Freedom Days that differ across the states, the Tax Foundation presentation is likely to lead to the misimpression that state and local policies account for the differences, when that is not the case.
- They include taxes paid in other states. The Tax Foundation uses a procedure to allocate state corporate, severance, and tourism taxes based on the residence of the consumers who purchase products that businesses sell (adjusted for taxes that tourists pay). This is likely to lead to further misimpressions about the impact of a state’s tax policies on the tax burdens its residents face. For example, when Alaska collects taxes from oil companies based on companies’ revenue and profits from Alaskan oil, the Tax Foundation does not count those taxes as part of Alaska’s revenue. Rather, it adds those taxes to the tax calculation in the states where oil is consumed. Maine residents, for example, consume a significant amount of fuel and so get allocated a large share of these Alaska taxes. Yet state legislators in Maine cannot have much impact on the level of taxes that Alaska or other oil-producing states levy on oil.
- They rely heavily on estimates, projections, and imputations from years-old data. While the Tax Foundation uses Congressional Budget Office (CBO) data to project total federal tax collections, there is no equivalent of the CBO for state and local governments. Rather, the Tax Foundation uses its own proprietary (non-public) model to estimate taxes that will be collected during the year in tens of thousands of state and local jurisdictions around the country. This model is based in part on data that are several years old. If the estimates turn out to be even slightly wrong, the rankings are likely to be completely askew, since — as the Tax Foundation itself indicated in a separate report last week — “state-local tax burdens are very close to one another and slight changes in taxes or income can translate to seemingly dramatic shifts in rank.”
- This has happened at least once. The Tax Foundation’s 2002 report claimed that tax burdens had risen in 38 states since 2000, but subsequent Census Bureau data for 2002 showed that tax burdens had risen in only four states and fallen in most of the rest.
For all these reasons, the Tax Foundation’s proclamations of state Tax Freedom Days are misleading and do little to inform legitimate debates over state and local taxes and the services they support.
*See Nicholas Johnson, Iris Lav, and Joseph Llobrera, “Tax Foundation Estimates of State and Local Tax Burdens Are Not Reliable,” Center on Budget and Policy Priorities, March 27, 2007.
Tax Foundation’s Treatment of Budget Deficit Is Even More Problematic
The Tax Foundation also presents an alternative “deficit-inclusive” Tax Freedom Day, which it measures by calculating total federal, state, and local tax receipts plus the federal budget deficit as a share of total national income. This measure is also highly misleading. It implies that each year’s deficit can simply be added on to the amount that taxpayers pay in taxes that year as a representation of the burden of government. But that is not the case.
When the federal government runs a deficit in a given year, the obligation to pay off the debt incurred in that year is spread out over many future years — years in which the total income of the nation will surely be higher than today. By adding the amount of the deficit to current taxes and measuring them relative to current incomes, the Tax Foundation seriously overstates the actual tax level today.
The effect of deficits on the long-term budget outlook and future generations is a legitimate source of concern and deserves serious consideration. But the budgetary well-being of future generations requires the debt to decline as a share of the nation’s income when economic times are normal — not to balance the budget in every year, as the Tax Foundation approach would imply.[11]
A Further Problem with “Tax Freedom Day”
The Tax Freedom Day concept also suffers from a deeper flaw. It suggests that the year can be divided into days that Americans spend working to pay federal, state, and local taxes and days they spend working for themselves so they can pay for goods such as food, clothing, housing, transportation, and medical care. Yet taxpayers derive substantial benefits from the taxes that they pay.
As the Tax Foundation itself acknowledged in its 2007 report, government revenues fund health and medical care for elderly and low-income Americans, as well as a significant fraction of the medical research that generates valuable health care innovations for Americans of all ages and income levels. Government revenues also fund Social Security payments that enable people who are elderly or have disabilities to pay for food, clothing, and housing. Moreover, government revenues are needed to build and maintain the roads and bridges that families use every day. Government revenues also fund the educational system, justice system, and other basic infrastructure, without which many Americans would not be able to earn the incomes they do.
Of course, there are important debates to be had about the appropriate size of government. But the Tax Foundation’s implication that Americans derive no benefit whatsoever from the goods and services that government provides does not further those debates. Rather, these debates require careful consideration of the merits of trading public for private goods and services, recognizing that both can generate value for American households.
End Notes
[1] Kyle Pomerleau, Lyman Stone, “Tax Freedom Day® is April 21, Three Days Later Than Last Year,” Tax Foundation, April 7, 2014, http://taxfoundation.org/article/tax-freedom-day-2014-april-21-three-days-later-last-year.
[2] See Tax Foundation Staff, “Tax Freedom Day: A Description of Its Calculation and Answers to Some Methodological Questions,” Tax Foundation Working Paper No. 3, March 2008.
[3] As its measure of national income, the Tax Foundation uses Net National Product (NNP). The Tax Foundation’s estimate of the federal effective tax rate for 2014 can be derived from its estimates of the total effective tax rate and the share of total tax receipts flowing to the federal government. Specifically, the Tax Foundation reports on page 1 of its analysis that the total effective tax rate for 2014 will be 30.2 percent. It also estimates that the total tax burden of $4.5 trillion is composed of $3 trillion in federal taxes and $1.5 trillion in state and local taxes. Multiplying the ratio of federal to total taxes ($3 trillion/$4.5 trillion) by the total effective tax rate (30.2 percent) yields a federal effective tax rate of 20.1 percent.
[4] The Tax Foundation’s estimates also differ from TPC’s in that the income measure the Tax Foundation uses (Net National Product) is different than the TPC measure (“cash income”) used in Figure 1. However, the TPC estimate of total federal taxes divided by total cash income is relatively close to the Tax Foundation’s: 22.7 percent, as compared with the Tax Foundation’s 20.1 percent.
[5] TPC estimates that a filing unit needed cash income of more than $111,091 in 2014 to be in the top income quintile. See Tax Policy Center Table T13-0035.
[6] Of course, the figure for each quintile is an average for that segment of the population. Thus, some households, mostly in the fourth quintile, probably pay a larger share of their income in federal taxes than the Tax Foundation’s reported average. But many households in the top quintile likely pay less, since the top quintile average is pulled up by households at the very top of the income scale.
[7] Congressional Budget Office, “The Distribution of Household Income and Federal Taxes, 2010,” December 4, 2013, http://www.cbo.gov/publication/44604; and Tax Freedom Day 2014: Data Tables, Tax Foundation, April 7, 2014, http://taxfoundation.org/article/tax-freedom-day-2014-data-tables. The implied estimate for the effective federal tax rate can be obtained by dividing the “Federal Tax Freedom Day (Days Worker)” by the number of days in the year: 62.9 days divided by 365 equals 17.2 percent.
[8] Tara Siegel Bernard, “Taxing Thought: All Pay to April 26 Goes to Uncle Sam,” Wall Street Journal, April 19, 2006.
[9] Blake Ellis, “Your tax bill: 3 months of work,” CNNMoney.com, March 31, 2011, http://money.cnn.com/2011/03/31/pf/taxes/tax_freedom_day/index.htm.
[10] Dan Caplinger, “3 Months Into 2014, You’re Likely Still Working for the Tax Man,” DailyFinance, March 31, 2014, http://www.dailyfinance.com/2014/03/31/tax-freedom-day/.
[11] See Richard Kogan and William Chen, “Projected Ten-Year Deficits Have Shrunk by Nearly $5 Trillion Since 2010, Mostly Due to Legislative Changes, Recent Spending Cuts Outweigh Tax Increases 3 to 1,” Center on Budget and Policy Priorities, March 19, 2014, https://www.cbpp.org/cms/index.cfm?fa=view&id=4106; and Joel Friedman and Robert Greenstein, “Commentary: Why Balancing the Budget by the End of the Decade Is Not the Right Goal,” Center on Budget and Policy Priorities, March 20, 2013, https://www.cbpp.org/cms/?fa=view&id=3935.
More from the Authors

Areas of Expertise