How Much Deficit Reduction Is Needed Over the Coming Decade?
Total Amount and Path of Savings Are Both Important
Policymakers could stabilize the debt (so it stops rising as a percent of the economy) over the latter part of the decade with about $900 billion in further deficit savings, according to the Center’s updated calculations, which are based on the new, more optimistic budget projections the Congressional Budget Office (CBO) released in May.
In February 2013, we estimated that $1.5 trillion in deficit savings would stabilize the debt over the next ten years, but CBO’s May projections lowered deficits over that period by hundreds of billions of dollars and consequently lowered the estimated size of the debt at the end of the ten-year period (in 2023) by $900 billion.[1] As a result, we now project that $1.5 trillion in deficit reduction over the coming decade would not only stabilize the debt but cause it to start declining modestly as a percent of the economy, as measured by gross domestic product, or GDP. Looking back further, current budget projections are considerably less daunting than they were a few years ago, as a result of CBO’s less pessimistic economic and technical assumptions and the spending and tax legislation that the President and Congress have enacted over the past 2½ years.
In this analysis, we also find that, in addition to the amount of deficit reduction to achieve over the coming decade, the timing of that deficit reduction is important. In particular, the amount of deficit reduction occurring during the latter part of the decade — and thus the resulting trajectory of the debt-to-GDP ratio at the end of the decade — is a key factor for assessing how various deficit-reduction policies will affect the outlook over the longer term, when the nation’s fiscal challenges will be greater.
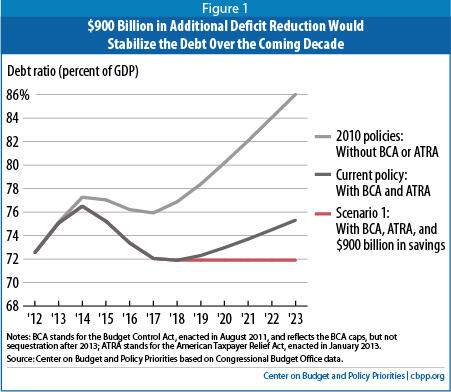
If policymakers do not change current policies, the debt ratio will fall to 72 percent of GDP by 2018. After 2018, the debt ratio will start rising again because of the ongoing retirement of the baby-boom generation and the long-term pressure of health care cost growth (even after accounting for the recent slowdown). The debt ratio would exceed 75 percent of GDP by 2023 and continue rising gradually after that.
We estimate that $900 billion in deficit reduction that starts in 2019 could halt the rise of debt through the end of the decade, stabilizing the debt ratio at 72 percent of GDP. Stabilizing the debt ratio is the minimum appropriate fiscal policy during normal economic times because an ever-rising debt ratio is ultimately unsustainable. When times are good, the debt ratio should decline, to reduce the share of the budget devoted to interest on the debt and to allow for necessary debt increases during recessions, wars, and other crises. Although stabilizing the debt is the minimum goal, the improved fiscal outlook may make a more ambitious goal more attainable — one that includes temporary measures to strengthen job creation now while also taking sufficient steps to place the debt ratio on a downward path in the latter years of the decade.
In this paper, we examine five scenarios of possible deficit-reduction amounts and paths that policymakers could follow:
- The $900 billion in deficit reduction that starts in 2019 (cited above) represents Scenario 1. It does not reflect specific policy proposals but, instead, is a mechanical calculation of the amount of deficit reduction needed to keep the debt ratio, for the 2019-2023 period, at precisely the level it will attain in 2018 under current policies.
- Scenario 2 assumes a continuation of sequestration through its scheduled end in 2021 and the further savings through 2023 and beyond that would result from a lower starting level of discretionary funding in 2021.
- Scenario 3 assumes the President and Congress replace sequestration with the same amount of policy savings as sequestration over the next decade. It would phase in those savings more gradually — and reduce deficits more by the end of the decade — than sequestration; but it would phase in the savings less gradually than Scenario 1, which defers deficit reduction until 2019.
- Scenario 4 assumes the same $1.327 trillion in policy savings (and about $200 billion in associated interest savings) that we assumed for the 2014-2023 period in February when we modeled $1.5 trillion in deficit reduction — but it applies those policy savings, for that same 10-year period, to our updated current-policy baseline. That would put the debt ratio on a declining path, falling to 69 percent of GDP by 2023.
- Scenario 5 begins with the same $1.327 trillion in policy savings as Scenario 4, but adds an up-front $250 billion jobs package to strengthen the economy now while offsetting that $250 billion with an equivalent amount of additional policy savings over the remainder of the decade. That would not only strengthen the economy in the short term but also would produce more total deficit reduction and a better long-run debt trajectory beyond the first decade.
Based on those scenarios, we reach two sets of conclusions:
- Our estimate that $900 billion in deficit reduction could stabilize the debt ratio in the decade’s final years assumes sequestration does not continue beyond 2013. If, instead, policymakers maintain it, it will generate another $1.1 trillion in savings, producing a debt ratio of 71 percent in 2023. Yet the debt ratio will still start rising at the end of the decade, partly because sequestration savings fade over time. As a result, it would be far better — for budget policy, for the economy, and for the long-term debt trajectory — to replace sequestration with a balanced package of savings that phases in more slowly initially and more rapidly in the latter years of the decade. The debt trajectory during the latter part of the decade will generally be more important for the nation’s long-term fiscal health than the amount of deficit reduction over the next ten years.
-
For any given amount of net 10-year deficit reduction, policymakers would be well-advised to include an up-front jobs package to help address the current high rates of unemployment and under-employment. By offsetting the cost of the jobs package over the decade, policymakers also could ensure that the gross 10-year deficit reduction would be greater and the debt ratio would have a better long-term trajectory.
For instance, while a $1.5 trillion ten-year deficit-reduction package would shrink the debt to 69 percent of GDP by 2023, the debt ratio would fall more rapidly in 2023 and produce better results in later decades if the package included $250 billion in temporary, up-front job-creation measures, offset by $250 billion in permanent revenue increases and program savings that continued to reduce the deficit beyond the next ten years.
With the debt ratio falling over the next few years under current policies, additional deficit reduction that is more back-loaded — and thereby targeted to reduce the deficit more in the final years of the decade, when the economy is expected to be stronger and when the debt ratio is projected to start rising again under current policies — would have a greater positive impact on the nation’s long-term fiscal outlook.
Scenario 1: Enact $900 Billion in Deficit Savings to Stabilize the Debt Ratio
The two rounds of deficit reduction that Congress and the President have enacted since the fall of 2010, when the Bowles-Simpson report and Rivlin-Domenici task force outlined deficit-reduction proposals, have considerably brightened the budget picture. The Budget Control Act of 2011 (BCA) established statutory limits, or caps, on the level of discretionary (non-entitlement) funding. The fiscal cliff bill (the American Taxpayer Relief Act, or ATRA) increased revenues, with the increases targeted almost entirely on the well-off. Together, these bills have reduced cumulative deficits over the 2014-2023 period by $2.8 trillion. (See Box 1.)
Our February analysis showed that $1.5 trillion in additional deficit reduction would stabilize the debt at 73 percent of GDP. Figure 1 reflects our new finding that policymakers can stabilize the debt ratio with $900 billion in budget savings, starting in 2019. The new, $900 billion scenario has several advantages over our February scenario: (1) because the required savings are smaller, they may be more politically acceptable; (2) because the savings do not need to take effect until 2019, the deficit reduction will not impede the current too-slow recovery; and (3) even with a smaller amount of ten-year deficit reduction, the debt would stabilize at a slightly lower level — 72 percent of GDP instead of 73 percent.
Box 1: Deficit Reduction Enacted to Date
Table 1 shows that two rounds of deficit reduction — the BCA’s cuts in annual discretionary appropriations and ATRA’s revenue increases and other changes — have reduced projected deficits by $2.8 trillion over 2014-2023.
| Table 1 Deficit Reduction Enacted to Date Cumulative totals, 2014-2023, in billions | |||
| Policy savings | Interest savings | Total deficit reduction | |
| Discretionary savings from cuts in 2011 funding and caps imposed by the BCA | 1,576 | 340 | 1,915 |
| Savings from ATRA | 732 | 119 | 851 |
| Total | 2,308 | 458 | 2,767 |
| Source: CBPP based on Congressional Budget Office and Joint Committee on Taxation data. | |||
In addition, improvements in economic and technical factors have knocked another $2 trillion off projected deficits for the coming decade, relative to CBO’s August 2010 projections. Most of this improvement comes from slower actual and projected growth of health care costs and from lower interest rates. Combined with the $2.8 trillion in deficit reduction resulting from the BCA and ATRA, the budget picture over the 2014-2023 budget period is now $4.7 trillion brighter than in the fall of 2010, when Bowles-Simpson and the Rivlin-Domenici panel issued their reports. This is the fundamental reason why the $4 trillion or more in ten-year deficit reduction that many advocated a few years ago is no longer a compelling goal.
Not counting interest savings, about 70 percent of the deficit reduction achieved to date has come from program cuts; the remaining 30 percent has come from revenue increases. Table 2 shows how these ratios would change if the additional policy savings in Scenarios 1, 3, 4, and 5 are split 50-50 between program cuts and revenue increases (Scenario 2, the continuation of sequestration, is entirely program cuts). In all five scenarios, at least three-fifths of the policy savings from the combination of discretionary cuts, ATRA, and the additional deficit reduction would come from program cuts.
| Table 2 Ratios of Program Cuts to Revenue Increases; Savings to Date Plus Five Scenarios (in billions of dollars) | ||||
| Program cuts | Revenue increases | Total policy savings | Share from program cuts | |
| To date: discretionary cuts and ATRA (Table 1) | 1,605 | 703 | 2,308 | 70% |
| Plus Scenario 1 with 50-50 cuts and revenues | 2,004 | 1,103 | 3,107 | 65% |
| Plus Scenario 2 (sequestration) | 2,545 | 703 | 3,249 | 78% |
| Plus Scenario 3 with 50-50 cuts and revenues | 2,075 | 1,174 | 3,249 | 64% |
| Plus Scenario 4 or 5 with 50-50 cuts and revenues | 2,269 | 1,367 | 3,636 | 62% |
| *Note: Excludes the 2014-2023 effects of 2013’s sequestration. If they had been included, the share from program cuts would be 79%. | ||||
In calculating the savings needed to stabilize the debt ratio over the coming decade, we used CBO’s new projections and made several adjustments that most other budget analysts also make to reflect the continuation of current policies. On net, these adjustments increase cumulative deficits over the next ten years by almost $500 billion. (Appendix 1 explains our baseline adjustments and displays their year-by-year results. Appendix 2 gives the year-by-year policy savings, interest savings, and total savings associated with this and our other scenarios.)
Scenarios 2 and 3: Allow Sequestration to Remain in Effect or Replace it With a Better Package
As Scenario 1 shows, $900 billion in additional deficit reduction starting in 2019 would stabilize the debt ratio for the rest of the decade.
The larger the amount of deficit reduction over the decade, the lower the debt ratio at the end of the decade, in 2023. But, assuming that the deficit-reduction policies are permanent, the trajectory of debt in the years leading up to 2023 — and by implication in the years and decades after 2023 — is as or more important than the amount of deficit reduction over the decade and the level of the debt in 2023. A backloaded ten-year package (one that shrinks deficits by larger amounts in the final years) is preferable to a somewhat larger, front-loaded package that produces greater deficit reduction now but leads to higher deficits than the backloaded package in the final years. While the smaller package would produce a modestly higher debt ratio at the end of the decade, it would place the budget on a trajectory to produce lower debt ratios in years after that.
Figure 2 illustrates this point by showing two other possible paths of deficit reduction:
- Scenario 2 assumes that sequestration continues through 2021 as scheduled. (Our current-policy baseline assumes that sequestration is cancelled from 2014 on.)
- Scenario 3 assumes that Congress enacts the same amount of policy savings as sequestration would achieve, but phases those savings in more gradually. As a result, Scenario 3 reduces the deficit more in 2023 than sequestration does.Image
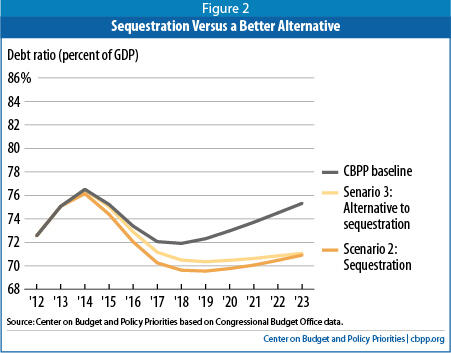
Scenario 2 involves $941 billion of spending reductions from program cuts due to sequestration and the resulting $200 billion in interest savings, for a total of more than $1.1 trillion in deficit reduction over the decade. Yet the debt ratio, after falling initially, would rise from 2019 on.
There are many policy reasons to replace the sequestration meat-axe with a more balanced and precisely honed alternative, or even to abandon it entirely. But the fact that an alternative with the same amount of policy savings will produce a better trajectory of debt over the long term is a compelling, additional reason.
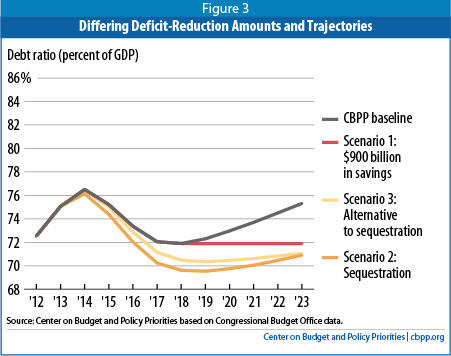
Figure 3 provides further evidence that the trajectory of debt is at least as important as the total savings. As it shows, the debt ratio is stable at the end of the decade under Scenario 1 but is rising under Scenarios 2 and 3. Scenario 1 consequently produces a lower long-term debt ratio than Scenarios 2 or 3, even though it provides less ten-year deficit reduction (about $900 billion, versus $1.1 trillion for the other scenarios) and results in a slightly higher debt ratio in 2023 (72 percent, versus 71 percent for the other scenarios). The reason is that Scenario 1’s deficit reduction is more backloaded and reduces the deficit by more in the final years of the decade (for example, by $236 billion in 2023) than either sequestration or its same-sized alternative.
Scenario 4: Enact $1.5 Trillion in Deficit Reduction to Put the Debt Ratio on a Declining Path
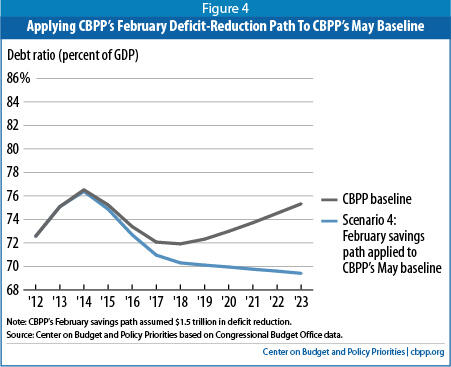
In Scenario 4, we take the identical $1.327 trillion in policy savings in the same years that we assumed in February but apply those savings to our updated current-policy baseline. As Figure 4 shows, this scenario would put the debt ratio on a declining path.
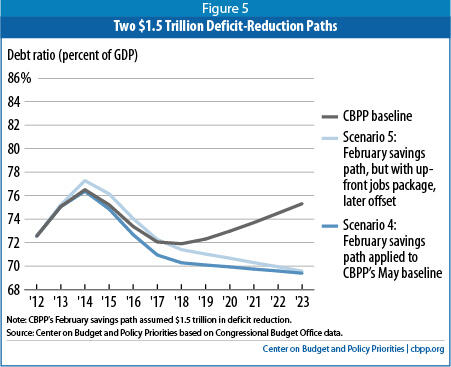
Scenario 5: Enact $1.5 Trillion in Deficit Reduction While Providing a Short-Term Jobs Package
A deficit-reduction plan that includes an up-front jobs package, with its cost offset later in the decade, has a double benefit. It immediately helps the economy and those still suffering from the slow pace of job creation, just when that help is most needed. And the larger and more back-loaded gross savings, carried forward into the future, will produce a better long-run debt trajectory.
Scenario 5 illustrates this point by using the same $1.327 trillion in total ten-year policy savings (and $1.5 trillion in total deficit reduction) as Scenario 4 but adding an up-front $250 billion jobs package and an offsetting $250 billion in extra policy savings over the rest of the decade. Figure 5, which compares these two results, shows once again that the trajectory of debt is as or more important than the total amount of deficit reduction. Because Scenario 5 produces a steeper decline in the debt ratio at the end of the decade, it would generate more long-term deficit reduction.
Is Stabilizing the Debt Ratio the Right Target?
This paper’s discussion of five deficit-reduction scenarios leads to the obvious question: what is the best path? The answer is not clear, although continuing sequestration (Scenario 3) is clearly the worst of the scenarios examined here.
This analysis emphasizes that the trajectory of debt in the final years of the decade is likely more important than the total amount of deficit reduction over the decade. Stabilizing the debt-to-GDP ratio over the coming decade — so the debt doesn’t grow faster than the economy — is still a good minimum goal. Achieving that goal would require shrinking annual deficits to about 2.7 percent of GDP by the end of the decade.
What would this mean for the longer-term picture? Our February 2013 analysis stated that even if policymakers stabilize the debt ratio for the decade ahead, they will still have to enact substantial additional deficit reduction for the long term to deal with pressures from the aging of the population and continued increases in health care costs. It’s now no longer clear whether that conclusion, which was consistent with virtually all recent long-term budget projections (including ours), remains correct.
The more manageable long-term picture — caused in part by the enactment of the Affordable Care Act in 2010, the BCA in 2011, and ATRA in 2013, and in part by the very significant improvement in CBO’s economic and technical assumptions over the last few years — makes a different conclusion possible.[2] If policymakers adhere to the current policy path we use in this analysis (and outline in Appendix 2) and enact enough deficit reduction to stabilize or reduce the debt ratio in the coming decade, the budget may approximate debt stability over subsequent decades as well. Of course, that result depends upon baseline forecasts for future decades, which carry a high degree of uncertainty, and it would entail stabilizing the debt at or above 70 percent of GDP, whereas a downward trajectory is preferable during normal economic times.
Specifically, under our baseline assumptions, enactment of permanent savings consistent with Scenario 1 (the back-loaded $900 billion package) would produce a debt ratio that is steady at 72 percent of GDP through the end of this decade, rises slightly until peaking at about 75 percent in the early 2030s, and then declines slowly. Scenario 4’s more aggressive ($1.5 trillion) deficit-reduction package would produce a debt ratio that is stable at about 70 percent through the middle 2030s before starting to decline.[3]
Given this change in the projections, some might want to declare victory over unsustainable debt right now. We believe this would be a mistake, for three reasons.
First, any such “victory” would come only after enacting one of these deficit-reduction scenarios. In the current political environment, reaching any budgetary compromise in Congress will be difficult.
Second, even adhering to current policy may be challenging. For example, while current policy as we define it assumes that sequestration will be cancelled going forward, it still requires adhering to the BCA caps, which will not rise by enough to cover inflation relative to the enacted 2012 funding levels, much less cover population growth.[4] Many analysts worry that the BCA discretionary funding caps will ultimately provide insufficient public investment in education, infrastructure, and scientific research — as well as an inadequate safety net with growing waiting lists for such services as child care and Section 8 housing. (We share these concerns.) In addition, as discussed in Appendices 1 and 3, our current-policy baseline assumes that the “normal tax extenders” will expire on schedule; policymakers could elect to extend these tax cuts without offsetting the cost.
Third, as we said earlier, stabilizing the debt ratio over the decade is a sound but minimum goal. All else being equal, reducing the debt ratio is preferable. (See Box 2.) And while reducing the debt ratio is not essential over the coming decade, the case for reducing it over multiple decades is notably stronger, if only because a major crisis is more likely sometime in the next 30 years than the next ten.
For each of these reasons, we believe it remains necessary for policymakers both to avoid backsliding relative to current policy and to strive to enact a balanced plan that permanently raises revenues and reduces program costs enough to at least stabilize the debt ratio over the decade.
Box 2: Why the Debt Ratio Matters
A falling debt ratio means that national income (GDP) is growing faster than debt, which represents an improvement in the government’s fiscal position — just as a family’s financial position improves when its income rises faster than its debt. Policymakers can achieve a declining debt ratio as long as annual deficits are sufficiently small; a balanced budget is not necessary (though it could be advisable in some circumstances).
Generally, the debt ratio should rise only during hard times or major emergencies and should decline during good times. That enables the government to combat recessions through tax cuts and spending increases (and to address human misery during bad times), while creating a presumption against policies that significantly increase the debt during good times.
The debt ratio cannot rise forever. If it did, national saving available for private investment would shrink as a greater share of national saving is diverted to government borrowing, ultimately impairing productivity growth and, in turn, living standards. Alternatively, if inflows of foreign capital offset the shortfall in domestic capital, the profits from that investment will go abroad; either way, U.S. living standards would ultimately suffer. In a crisis, international credit markets might refuse to lend to the U.S. public or private sectors at a reasonable price.
These problems would occur if the debt ratio became too high. While no one knows what “too high” means for the United States, a debt ratio that rises in both good times and bad will become increasingly problematic. That’s why the minimum appropriate budget policy is to ensure that the debt ratio does not rise during normal economic times.
Achieving $900 billion in additional deficit savings would stabilize the debt at 72 percent of GDP by 2018. Some prefer a lower debt ratio, such as 60 percent of GDP, a goal that the European Union and the International Monetary Fund adopted some years ago. No economic evidence supports this or any other specific target, and IMF staff have made clear that the 60 percent criterion is an arbitrary one and that the current pace of U.S. deficit reduction is too rapid and is impeding economic growth. The critical goal now is to stabilize the debt in the coming decade without hindering recovery from the worst recession since the Great Depression.
All else being equal, a lower debt-to-GDP ratio is preferred. It reduces interest costs (allowing more of the budget to be devoted to actual programs) and gives policymakers more flexibility in economic and financial crises. Of course, all else is never equal. Achieving the additional deficit reduction needed would require deeper spending cuts, higher revenues, or both. That could be problematic if policymakers made unsound choices and underinvested in areas such as education, infrastructure, and research (which can boost future productivity) or enacted measures that subjected vulnerable members of society to greater hardship.
Weighing all these factors, we conclude that enacting a deficit-reduction package that stabilizes, or if possible starts to reduce, the debt over the coming decade — without harming the recovery, further squeezing needed long-term investments in economic growth, or increasing poverty or exacerbating inequality of incomes, wealth, and opportunity — would be an important accomplishment.
Moreover, some argue we should go further — that putting the debt ratio on a declining rather than stable path for the coming decade would offer insurance against the risk that the CBO projections turn out to be too optimistic. This argument merits consideration.
The CBO economic forecast is not inherently “rosy.” History has shown that CBO’s economic assumptions, upon which our projections are based (we do not make economic projections of our own), are as likely to be too pessimistic as too optimistic. CBO’s projections show a slow but relatively steady recovery from the Great Recession, with the economy not fully recovering until 2017, followed by a period of steady but not robust growth. The actual pattern of growth that ensues will, of course, show more variability and could be either weaker or stronger on average over the period than CBO is projecting. The point is that CBO tries to make a projection that is not biased in one direction or the other, and historically its projections have not exhibited such a bias.
Yet, while CBO’s economic projections are as likely to be too pessimistic as too optimistic, there is still a significant chance the projections could prove too optimistic. The notion of seeking somewhat more deficit reduction than appears needed to stabilize the debt ratio under the CBO forecast thus has appeal.
Enacting larger deficit reduction now would require deeperprogram cuts, larger revenue increases, or both. At issue here is the quality of these policy choices. One concern is that enacting steeper deficit reduction now could lead policymakers to make decisions, particularly in the health care area, where desired solutions currently are elusive and where knowledge about effective ways to slow health care cost growth is likely to be greater in coming years.
To be sure, policymakers can enact measures now, as part of a balanced deficit-reduction package, that would achieve significant Medicare savings for the decade ahead without jeopardizing the quality of care or access to care. But rushing now to enact cuts substantially deeper than that in federal health spending could shift costs to states, individuals, and private employers and harm some of the most vulnerable members of society, while failing to address the underlying causes of the growth in costs across the health care system. Indeed, analysts have found that some proposals to enact large cuts in Medicare or other health programs would actually increase total U.S. health care costs — hardly a desirable outcome.
There are major unknowns in the health care arena, and policymakers should approach that area with appropriate caution. The growth of both public and private health costs has slowed appreciably in the past few years, but experts do not agree on how much of this slowdown is likely to continue over the long term. The answer affects the size of the long-term fiscal problem and the magnitude of the measures that will be needed to further slow health-care cost growth, beyond the smaller steps that can be taken now. More fundamentally, we currently lack needed information on how to slow health cost growth substantially without reducing health care quality or impeding access to necessary care. Demonstration projects and other experiments to find ways to do so are now starting and should generate important lessons. By later in the decade, we will know more about what works and what doesn’t, and whether we can build upon and spread the changes already starting to occur to slow health cost growth.
Weighing these various factors, we conclude that the $900 billion needed to stabilize the debt ratio for the coming decade at 72 percent of GDP, based on the new CBO projections, should be regarded as the minimum deficit-reduction goal for the coming decade, with this deficit reduction occurring in the years after the economy has more fully recovered.
We also conclude that a deficit package that includes an up-front jobs package, with its costs offset later in the decade, is better still, producing better economic outcomes in the short run and more deficit reduction in the long run. Former OMB and CBO director Peter Orszag and noted economist and former Federal Reserve vice chair Alan Blinder, among others, have recommended such a course.
Finally, putting the debt ratio on a modest downward path after the economy has recovered would bring additional advantages, if policymakers can achieve it without slowing the recovery, shortchanging important investments for the future, increasing poverty and inequality, or sacrificing health care quality. Unfortunately, this seems a tall order in the current political environment.
Appendix 1:
Current Policy and Current Law
CBO’s current-law baseline includes some features that make it less than optimal as a starting place for analyzing budget proposals.[5] To cite just one example, it assumes that Afghanistan war costs will continue in all future years at their current level, increased to cover inflation. For this and other reasons, in past years we and other groups such as the Bowles-Simpson fiscal commission, the Bipartisan Policy Center, the Committee for a Responsible Federal Budget (CRFB), the Concord Coalition, and the Committee for Economic Development have designed alternatives to CBO’s current-law baseline, variously called “current policy,” “plausible,” or “realistic” baselines. CBO itself has issued an “alternative fiscal scenario” and the Administration has issued an “adjusted baseline.” (Appendix 3 discusses alternative approaches to defining a current-policy baseline.)
We make five adjustments to CBO’s current-law baseline to produce our current-policy baseline, as Table 3 shows. The current-policy baseline we derive is virtually identical in concept to the one we used last year to analyze budget plans and is identical to the baseline used by CRFB, which terms it a “realistic baseline.”[6] The Committee for American Progress (CAP) also uses this ten-year baseline. The rationale behind these five adjustments and their year-by-year effects are shown in Appendix 1 of our recent long-term budget analysis.[7]
| Table 3 Adjustments to CBO’s Current-Law Baseline To Produce CBPP’s Current-Policy Baseline (Dollars in billions) | |
| 10-year total, 2014-2023 | |
| Deficits, CBO’s current-law baseline (May 14, 2013) | 6,340 |
| Phase down war costs to about one-third of current level | -526 |
| Do not assume the “supercommittee sequestration” occurs in 2014 or beyond | +941 |
| Do not continue “Sandy emergency” funding enacted in HR 1 | -291 |
| Continue relief from the Medicare SGR at a freeze level | +139 |
| Continue costs of ARRA refundable tax credits after 2017 | +140 |
| Subtotal, policy adjustments | +402 |
| Debt service on the policy adjustments | +96 |
| Resulting deficits, CBPP’s current-policy baseline | 6,836 |
| Source: Center on Budget and Policy Priorities based on Congressional Budget Office data. | |
Because all figures, including the starting baseline, are taken from CBO’s May report, our current-policy baseline uses CBO’s economic and technical budget assumptions.
| Table 4 Revenues, Outlays, Deficit, and Debt in CBPP’s Current-Policy Baseline Dollars in billions | ||||||||||||
| 2013 | 2014 | 2015 | 2016 | 2017 | 2018 | 2019 | 2020 | 2021 | 2022 | 2023 | 10-yr total | |
| Revenues | 2,813 | 3,042 | 3,399 | 3,606 | 3,779 | 3,941 | 4,097 | 4,273 | 4,487 | 4,726 | 4,954 | 40,303 |
| Outlays | ||||||||||||
| Discretionary | 1,213 | 1,200 | 1,216 | 1,224 | 1,236 | 1,250 | 1,278 | 1,302 | 1,329 | 1,365 | 1,393 | 12,793 |
| Mandatory | 2,020 | 2,216 | 2,354 | 2,547 | 2,660 | 2,764 | 2,943 | 3,105 | 3,279 | 3,514 | 3,656 | 29,036 |
| Interest | 223 | 237 | 265 | 315 | 403 | 505 | 583 | 657 | 718 | 782 | 843 | 5,310 |
| Total outlays | 3,455 | 3,653 | 3,835 | 4,086 | 4,300 | 4,520 | 4,804 | 5,064 | 5,326 | 5,661 | 5,892 | 47,140 |
| Deficit | 642 | 611 | 436 | 480 | 521 | 579 | 707 | 791 | 838 | 935 | 938 | 6,836 |
| Debt held by public | 12,036 | 12,736 | 13,235 | 13,824 | 14,419 | 15,060 | 15,829 | 16,680 | 17,575 | 18,571 | 19,566 | |
| Debt net of financial assets | 11,031 | 11,616 | 12,033 | 12,492 | 13,989 | 13,544 | 14,227 | 14,993 | 15,807 | 16,715 | 17,626 | |
| Source: Center on Budget and Policy Priorities based on Congressional Budget Office data. | ||||||||||||
| Table 5 Revenues, Outlays, Deficit, and Debt in CBPP’s Current-Policy Baseline Percent of GDP | |||||||||||
| 2013 | 2014 | 2015 | 2016 | 2017 | 2018 | 2019 | 2020 | 2021 | 2022 | 2023 | |
| Revenues | 17.5 | 18.3 | 19.3 | 19.2 | 18.9 | 18.8 | 18.7 | 18.7 | 18.8 | 19.0 | 19.1 |
| Outlays | |||||||||||
| Discretionary | 7.6 | 7.2 | 6.9 | 6.5 | 6.2 | 6.0 | 5.8 | 5.7 | 5.6 | 5.5 | 5.4 |
| Mandatory | 12.6 | 13.3 | 13.3 | 13.6 | 13.3 | 13.2 | 13.4 | 13.6 | 13.8 | 14.1 | 14.1 |
| Interest | 1.4 | 1.4 | 1.5 | 1.7 | 2.0 | 2.4 | 2.7 | 2.9 | 3.0 | 3.1 | 3.3 |
| Total outlays | 21.5 | 21.9 | 21.7 | 21.7 | 21.5 | 21.6 | 21.9 | 22.2 | 22.3 | 22.8 | 22.7 |
| Deficit | 4.0 | 3.7 | 2.5 | 2.6 | 2.6 | 2.8 | 3.2 | 3.5 | 3.5 | 3.8 | 3.6 |
| Debt held by public | 75.1 | 76.5 | 75.2 | 73.6 | 72.2 | 71.9 | 72.3 | 73.0 | 73.7 | 74.7 | 75.5 |
| Debt net of financial assets | 68.8 | 69.8 | 68.2 | 66.5 | 65.1 | 64.7 | 65.0 | 65.6 | 66.3 | 67.2 | 68.0 |
| Source: Center on Budget and Policy Priorities based on Congressional Budget Office data. | |||||||||||
We also make one final adjustment not shown in Tables 4 and 5: we smooth the path of debt by removing certain timing shifts that occur under existing law. Specifically, if the required monthly payments of SSI benefits, veterans’ benefits, military retirement, and Medicare Advantage and prescription drug benefits would occur on a weekend, the payment is instead made the prior Friday. If that happens in a year in which October 1 (the first day of the fiscal year) falls on a weekend, the payments normally made on that date instead occur on September 29 or 30, which is in the prior fiscal year. As a result, while most fiscal years include 12 such monthly payments, a few include 11 or 13. We assume 12 monthly payments in all years, thereby removing some meaningless bumpiness from the resulting levels of debt shown in the figures in this analysis.
Appendix 2:
Deficit-Reduction Scenarios Used in This Analysis
Starting from the current-policy baseline described in Appendix 1, this analysis shows the five hypothetical deficit reduction scenarios discussed in this analysis.
- Scenario 1: $900 billion in deficit reduction, which stabilizes the debt ratio at its 2018 trough.
- Scenario 2: $1.1 trillion in deficit reduction from continuing sequestration.
- Scenario 3: $1.1 trillion in deficit reduction from an alternative to sequestration, in which the savings phase in much more slowly than sequestration but reduce deficits by more than sequestration does at the end of the decade.
- Scenario 4: policy savings of the same size and year-by-year timing as we outlined in February ($1.3 trillion over ten years, producing $1.5 trillion in deficit reduction); this path produces a declining debt ratio.
- Scenario 5: same net policy savings as Scenario 4, but also including an up-front jobs package of $250 billion within the total.
Table 6 shows the policy savings, resulting interest savings, and total deficit reduction for each of these five scenarios.
| Table 6 Savings in Five Hypothetical Deficit-Reduction Scenarios (Dollars in billion) | |||||||||||
| 2014 | 2015 | 2016 | 2017 | 2018 | 2019 | 2020 | 2021 | 2022 | 2023 | Total | |
| Scenario 1: stabilize debt ratio (with $900 billion package) | |||||||||||
| Policy savings | 85 | 150 | 170 | 192 | 202 | 799 | |||||
| Interest savings | 2 | 8 | 15 | 24 | 34 | 83 | |||||
| Total deficit reduction | 88 | 157 | 185 | 217 | 236 | 882 | |||||
| Scenario 2: sequestration | |||||||||||
| Policy savings | 60 | 88 | 98 | 100 | 103 | 103 | 103 | 103 | 93 | 90 | 941 |
| Interest savings | 0 | 1 | 4 | 9 | 15 | 22 | 28 | 34 | 41 | 47 | 200 |
| Total deficit reduction | 60 | 90 | 101 | 109 | 119 | 125 | 131 | 137 | 133 | 136 | 1,141 |
| Scenario 3: alternative to sequestration (a) | |||||||||||
| Policy savings | 7 | 28 | 55 | 83 | 110 | 117 | 124 | 131 | 139 | 147 | 941 |
| Interest savings | 0 | 0 | 1 | 4 | 9 | 15 | 22 | 29 | 36 | 44 | 162 |
| Total deficit reduction | 7 | 28 | 56 | 87 | 120 | 132 | 145 | 160 | 175 | 192 | 1,102 |
| Scenario 4: reduce debt ratio (with $1.5 trillion package) | |||||||||||
| Policy savings | 21 | 43 | 64 | 85 | 107 | 128 | 187 | 213 | 231 | 247 | 1,327 |
| Interest savings | 0 | 1 | 2 | 5 | 11 | 17 | 25 | 36 | 48 | 61 | 206 |
| Total deficit reduction | 21 | 43 | 66 | 91 | 117 | 145 | 212 | 249 | 279 | 308 | 1,533 |
| Scenario 5: reduce debt ratio (with $1.5 trillion total including a jobs package) (b) | |||||||||||
| Policy savings | (104) | (32) | 39 | 85 | 143 | 166 | 227 | 256 | 277 | 295 | 1,327 |
| Interest savings | (1) | (2) | (2) | (1) | 3 | 10 | 19 | 31 | 44 | 59 | 161 |
| Total deficit reduction | (104) | (34) | 37 | 84 | 146 | 176 | 246 | 287 | 322 | 354 | 1,488 |
| May not add due to rounding. (a) These are the amounts assumed in the “optimistic scenario” discussed in our long-term projections released June 27, 2013; see Footnote 2. (b) Entries shown in parentheses represent net costs rather than savings, generated by the inclusion in this hypothetical package of $250 billion for a jobs package. The illustrative jobs package also includes $25 billion in 2013 outlays, not shown in this table but included in the cumulative totals and the calculation of interest. | |||||||||||
Appendix 3:
Alternative Approaches to Current Policy
As discussed in Appendix 1, the current-policy baseline used in this analysis diverges in some respects from CBO’s current-law baseline. This appendix examines in more detail the effect of employing different assumptions with regard to the normal tax extenders (NTEs) and sequestration.
Tax extenders. Congress usually extends a large series of special tax provisions, generally relating to the treatment of business income, for a year or two at a time. The research and experimentation (R&E) tax credit is the most prominent. ATRA extended many of these special provisions until December 31, 2013. We do not assume their continuation in this current-policy baseline beyond what was provided in ATRA, largely because the Bowles-Simpson proposal and the Obama Administration, in its budgets, did not continue them in their current-policy baselines. The Bipartisan Policy Center and the Committee for a Responsible Federal Budget have adopted the same approach in their current-policy baselines.[8]
There is an analytical case, however, for constructing a current-policy baseline that assumes continuation of the NTEs without offsetting the cost. What if we had?
Under such an alternative baseline, the starting level of revenues would be $517 billion lower over the 2014-2023 period. (This estimate does not assume continuation of the 50 percent deduction for the cost of certain new capital investments, known as “bonus depreciation,” which is not a normal extender; it was enacted to address the slowdown in the economy, and we expect that it will not be continued once the economy is on more solid ground. Congress allowed a similar provision to expire after the economy recovered from the recession of the early 2000s.) When the associated interest costs of $91 billion are included, current-policy baseline deficits would be $615 billion higher over ten years if one assumes continuation of the NTEs.
At first blush, this would appear to increase the deficit reduction needed to stabilize the debt ratio from about $900 billion to about $1.5 trillion. But that conclusion oversimplifies the story. Recall that in this analysis, our $900 billion path mechanically stabilized the debt ratio at 71.9 percent of GDP, the low-point it reaches under current policy in 2018. If current policy is redefined to include the continuation of the NTEs, however, the debt ratio reaches its low point in 2017, at 72.8 percent of GDP. Stabilizing the debt at that ratio in the final years of the decade requires somewhat less than $1.3 trillion in deficit reduction, not $1.5 trillion.
Sequestration. The current-policy baseline used in this analysis does not reflect the implementation of sequestration — the automatic, across-the-board spending cuts required under the BCA — after 2013. The BCA established a congressional Joint Select Committee on Deficit Reduction (the “supercommittee”) to develop legislation to reduce deficits by at least $1.2 trillion over ten years; it created sequestration as a backup mechanism to achieve this deficit reduction in the event the supercommittee failed. While the failure of the supercommittee has in fact triggered sequestration for 2013, sequestration is widely considered to be poor policy; the President (in his fiscal year 2014 budget) and both chambers of Congress (in their respective fiscal year 2014 budget resolutions) have proposed alternatives to the current sequestration rules, although the alternatives differ greatly.
Nevertheless, sequestration is current law. If our current-policy baseline assumed that sequestration stayed in effect through this decade, we estimate (based on CBO data) that it would produce $941 billion of savings through budget cuts over the 2014-2023 period, plus $200 billion of associated interest savings. This yields total deficit reduction of $1.1 trillion over the decade. At first blush, this would appear to exceed the $900 billion in deficit reduction needed to stabilize the debt ratio. Again, however, that conclusion would be overly hasty.
As Figure 2 shows, if policymakers continue sequestration, the debt ratio would bottom out at 69.6 percent of GDP in 2019 and then start rising. To stabilize the debt ratio at 69.6 percent (rather than at 71.9 percent, as under our $900 billion deficit-reduction path) would require about $350 billion of additional deficit reduction (beyond the sequestration savings) over the last four years of the decade.
Table 7 summarizes the baseline as we and CRFB define it, as well as under the alternative assumptions about NTEs and sequestration. It also shows what stabilizing the debt ratio at its low point under these different baselines would entail.
| Table 7 Stabilizing the Debt Ratio Under Four Baselines (Dollars in billion) | ||||
| CBPP baseline | With normal tax extenders continued | With sequestration continued | With both sequestration & normal tax extenders continued | |
| Cumulative deficits over 2014-2023 | $6,836 | $7,451 | $5,696 | $6,310 |
| Debt ratio in 2023 | 75.3% | 77.7% | 70.9% | 73.3% |
| Year the debt ratio hits low point | 2018 | 2017 | 2019 | 2018 |
| Debt ratio at low point | 71.9% | 72.8% | 69.6% | 70.6% |
| Deficit reduction needed to stabilize ratio at low point: | ||||
| Policy savings | $799 | $1,131 | $326 | $626 |
| Interest savings | $83 | $123 | $26 | $58 |
| Total savings | $882 | $1,254 | $352 | $684 |
| May not add due to rounding | ||||
A key point of these examples is that policymakers, the media, the public, and the business community should be aware of what is in the baseline. If the baseline assumes the expiration of the NTEs (as ours does), then policymakers cannot count the expiration of any NTEs as deficit reduction, and they must count the extension of any NTEs as a cost. Similarly, if the baseline assumes that sequestration is not implemented (as ours does), then policymakers can count a plan that replaces sequestration with other, more rational and balanced savings as deficit reduction and needn’t count cancelling sequestration (without offsets) as a cost.
As we have stressed throughout this analysis, the trajectory and quality of deficit reduction are likely to be more important than the total ten-year dollar amount. Therefore, the mechanical calculations shown in Table 7 do not necessarily represent good budget policy.
End Notes
[1] This analysis updates our earlier reports on this subject. See Richard Kogan, $1.5 Trillion in Deficit Savings Would Stabilize the Debt Over the Coming Decade, Center on Budget and Policy Priorities, February 11, 2013, https://www.cbpp.org/cms/?fa=view&id=3900, To Stabilize the Debt, Policymakers Should Seek Another $1.4 Trillion in Deficit Savings, January 9, 2013, https://www.cbpp.org/cms/?fa=view&id=3885, and $2 Trillion in Deficit Savings Would Achieve Key Goal: Stabilizing the Debt over the Next Decade, November 1, 2012,https://www.cbpp.org/cms/?fa=view&id=3856.
[2] Like the short- and mid-term budget outlook, the longer-term picture is also far brighter than it was a few years ago, although it remains problematic. See Richard Kogan, Kathy A. Ruffing, and Paul N. Van de Water, Long-Term Budget Outlook Remains Challenging, But Recent Legislation Has Made It More Manageable, Center on Budget and Policy Priorities, June 27, 2013, https://www.cbpp.org/cms/index.cfm?fa=view&id=3983.
[3] In modeling these paths over the long term, the composition of deficit reduction makes some difference. We have assumed that half of the deficit reduction comes from revenue increases and a substantial portion of the remainder comes from reductions in health care costs. A package directed more towards other polices would produce somewhat less deficit reduction over the long term
[4] See Richard Kogan, Non-Defense Discretionary Programs Will Face Serious Pressures Under Current Funding Caps, Center on Budget and Policy Priorities, December 6, 2012, https://www.cbpp.org/cms/?fa=view&id=3869.
[5] CBO’s current-law baseline follows the baseline rules prescribed in section 257 of the Balanced Budget and Emergency Deficit Control Act of 1985 as amended, which is the only statutory definition of a baseline.
[6] Committee for a Responsible Federal Budget, Introducing the Latest CRFB Realistic Baseline, May 30, 2013, http://crfb.org/blogs/introducing-latest-crfb-realistic-baseline.
[7] Our long-term analysis makes an additional adjustment, not included in this ten-year analysis: to be cautious, it assumes that the so-called “normal tax extenders” other than bonus depreciation will be continued beyond their scheduled expiration at the end of 2013.
[8] On August 1, 2012, CRFB issued a statement strongly urging Congress to offset the cost of any of the NTEs it does continue. See http://crfb.org/sites/default/files/Dont_Put_the_Extenders_on_the_Nations_Credit_Card.pdf.
More from the Authors

Areas of Expertise