Too Little to Go Around
House Appropriations Plan to Increase Defense and Homeland Security Requires Even Deeper Cuts in Other Programs
The House Appropriations Committee’s plan to apportion discretionary funding for fiscal year 2014 among its 12 appropriations subcommittees — which it approved on a May 21 party-line vote — would override a key provision of the 2011 Budget Control Act (BCA) and shift tens of billions of dollars from domestic programs to defense and other security programs.
The plan, crafted by Chairman Harold Rogers, largely reflects the priorities in the House-passed budget resolution of March. Total discretionary funding under the Rogers plan would equal the total amount that the BCA allows in 2014 if the sequestration budget cuts remain in effect.[1] But defense would receive substantially more funding —and non-defense programs would receive substantially less — than the BCA allows under sequestration.
Under the Rogers plan, defense funding would exceed — likely by more than $45 billion — the BCA cap on 2014 defense appropriations after sequestration, lifting defense funding for that year close to the level before sequestration. Non-defense appropriations would fall below the post-sequestration non-defense cap by the same amount and, as a result, most areas outside defense would face deep cuts.
If, on the other hand, policymakers took the opposite approach, raising non-defense programs close to 2014 BCA cap before sequestration, they would have to cut defense programs by about 10 percent below their 2013 post-sequestration level.
Thus, the Rogers plan makes clear that if overall discretionary funding remains at the post-sequestration level in 2014, action by policymakers to protect funding in one major area — like defense — will require much deeper cuts in other areas. In short, the fundamental problem is that the overall funding level for discretionary programs under sequestration is too low.
A far better approach than the Rogers plan would be to replace sequestration with a balanced package of spending cuts and revenue increases and fund discretionary programs at the BCA levels for 2014 without sequestration. The President’s budget and the Senate-passed budget resolution both take this approach. A broader budget agreement — not the implementation of sequestration — is what the President and Congress envisioned when they enacted the BCA.
The fact that the Rogers plan’s cuts in domestic programs are much deeper than those already occurring under sequestration in 2013 is particularly striking given that the current cuts are causing significant reductions in public services and delays in key public investments and are affecting everything from medical research to weather forecasting to Head Start to Meals on Wheels.
In addition, the non-defense cuts under the Rogers plan would constitute the fourth wave of ever-deepening cuts in these programs in the past few years. First, policymakers cut these programs in the fiscal year 2011 appropriations bills as part of an agreement to avert a government shutdown. Second, they made additional cuts by enacting the BCA, with its strict spending caps, as part of an agreement to avert a default. Sequestration added a third tranche of cuts.
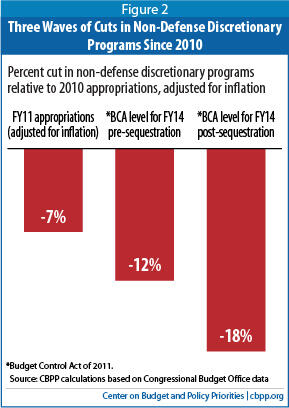
The Rogers proposal would add large new cuts on top of the first three waves of already-deep reductions. The overall impact would be remarkable. For example, under the Rogers plan, total 2014 appropriations for education, health and human services programs, employment, job training, and other Labor Department programs would be roughly 30 percent below the 2010 level, adjusted for inflation.
However, funding for defense — even with the increases Chairman Rogers provides — is still a few billion dollars below the level called for in the House-passed budget, as well as in the President’s budget and the Senate-passed budget.
Chairman Rogers himself may not believe that the overall funding that his plan provides for defense and non-defense discretionary programs for 2014 represents sound policy. He stated in announcing the allocations: “It is my sincere hope that the House and Senate can come together on a sustainable budget compromise to replace sequestration and establish a responsible, single House and Senate top line discretionary budget number.”[4]
Plan Would Increase Defense, Cut Non-Defense Programs Outside Security
Under the congressional budget process, the House Appropriations Committee sets funding allocations (known as “302(b)” allocations, referring to a subsection of budget law) for each of the 12 appropriations subcommittees. Then, each subcommittee writes an appropriations bill that divides its allocation among the programs under its jurisdiction.
Under the BCA, overall discretionary funding for 2014 is capped at $1.058 trillion. Sequestration lowers that total by $91 billion, to $967 billion[5] — nearly 2 percent below the post-sequestration 2013 funding level.
| Table 1 Discretionary Funding Levels, by Appropriations Subcommittee: 2013 Levels and 2014 House Appropriations Committee Allocations | |||||
| ($ in billions) | (Percent difference) | ||||
| 2013 excluding sequestration | 2013 including sequestration | 2014 House allocations | 2014 House vs. 2013 excluding sequestration | 2014 House vs. 2013 including sequestration | |
| Agriculture | 20.7 | 19.5 | 19.5 | -5.9% | -0.5% |
| Commerce, Justice, Science | 50.1 | 47.0 | 46.8 | -6.5% | -0.4% |
| Defense | 517.5 | 486.3 | 512.5 | -1.0% | 5.4% |
| Energy and Water Development | 36.2 | 33.8 | 30.4 | -16.0% | -10.0% |
| Financial Services and General Government | 23.0 | 21.6 | 17.0 | -26.1% | -21.6% |
| Homeland Security | 39.8 | 38.0 | 39.0 | -2.1% | 2.6% |
| Interior, Environment | 29.8 | 28.2 | 24.3 | -18.5% | -14.0% |
| Labor, Health and Human Services, Education | 156.5 | 149.6 | 121.8 | -22.2% | -18.6% |
| Legislative Branch | 4.3 | 4.1 | 4.1 | -3.6% | 1.5% |
| Military Construction, Veterans Affairs | 71.8 | 70.8 | 73.3 | 2.1% | 3.5% |
| State, Foreign Operations | 41.6 | 39.8 | 34.1 | -17.9% | -14.4% |
| Transportation, HUD* | 46.6 | 43.4 | 44.1 | -5.3% | 1.6% |
| Total | 1,037.8 | 982.4 | 966.9 | -6.8% | -1.6% |
| *Transportation, HUD, excluding housing loan guarantee programs | 62.7 | 59.5 | 56.6 | -9.8 | -5.1 |
| Note: 2013 figures include CBO re-estimates of enacted appropriations (see Appendix for more details). Source: Congressional Budget Office, House Appropriations Committee | |||||
The BCA sets separate caps for defense and non-defense discretionary funding that, when combined, equal the overall discretionary cap. The Rogers plan adheres to the $967 billion overall post-sequestration cap level for 2014 but likely exceeds the defense cap by $45 billion or more.[6] It offsets this breach by cutting non-defense discretionary funding below the non-defense cap by a like amount. Thus, although Chairman Rogers stated that “This is the hand that sequestration has dealt us, and we have no choice but to try and make the best of what we have,” his allocations change the hand he was dealt, shifting tens of billions of dollars from non-defense programs to defense.
As Table 1 shows, the Rogers plan includes the following:
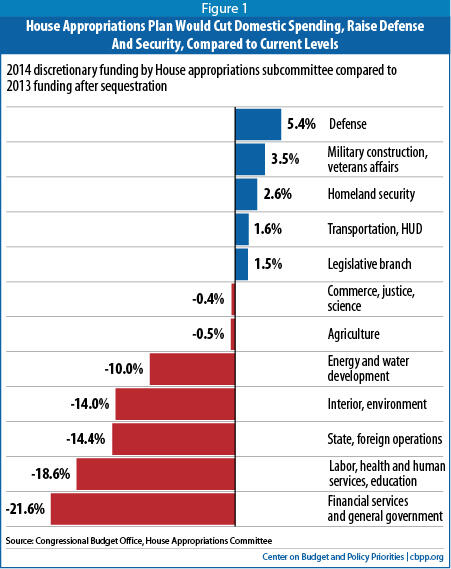
- An increase of 5.4 percent — or $26 billion — over the 2013 post-sequestration level in programs funded by the Defense appropriations bill. (This figure excludes costs associated with the wars in Iraq and Afghanistan, which are not subject to the BCA funding limits.)
- Increases of 3.5 percent and 2.6 percent, respectively (relative to the 2013 post-sequestration levels), for the appropriations bills covering some other security-related programs: the Military Construction-Veterans Affairs bill and the Homeland Security bills. (The Rogers allocations also include a 1.5 percent funding increase for the bill that funds congressional operations, such as staff salaries and building maintenance.)
- Cuts in aggregate of 12 percent below the 2013 post-sequestration levels in all other appropriations bills, to accommodate the above increases while remaining within the overall $967 billion post-sequestration funding ceiling. Funding for the Agriculture and Commerce-Justice-Science bills would be close to flat relative to the post-sequestration 2013 level, but other bills would see deep cuts: a 22 percent cut for Financial Services, a 19 percent cut for Labor-Health and Human Services-Education, a 14 percent cut for both the State-Foreign Operations bill and the Interior-Environment bill, and a 10 percent cut for Energy and Water Development.[7]
Plan Highlights Inadequacy of Overall Funding Under Sequestration
As explained above, the Rogers plan funds defense at a level close to the cap that the BCA sets for defense in 2014 if sequestration is not in effect and cuts non-defense programs by tens of billions of dollars more in order to stay within the overall post-sequestration ceiling. If policymakers took the opposite approach, raising non-defense programs close to the pre-sequestration 2014 BCA cap, they would have to cut defense programs by about 10 percent below their 2013 post-sequestration level. Neither approach is workable. The fundamental problem is that the overall funding level for discretionary programs under sequestration is too low.
Indeed, policymakers never intended sequestration to go into effect — it was a “stick” designed to force the “supercommittee” and Congress to agree on a deficit-reduction plan. Thus, in some respects, the 2013 funding levels in the final appropriations bill before sequestration reflect Congress’s preferred funding levels under the BCA. If one compares the Rogers plan to the 2013 pre-sequestration funding levels, his domestic program cuts are still more dramatic, totaling 22 percent for the Departments of Labor, Health and Human Services, and Education; 18 percent for environmental programs and the Department of Interior; and 18 percent for the State Department and other (non-military) foreign operations, even before inflation is taken into account.
Policymakers designed the BCA sequestration to require equal cuts in defense and non-defense programs (including the entitlements that are subject to sequestration, such as Medicare) in order to place pressure on both parties to reach a bipartisan deficit-reduction compromise. The pressure on Republicans was to come in large part from sequestration’s defense cuts. By largely undoing the defense sequestration cuts, the Rogers plan would undercut the bipartisan balance that the BCA’s sequestration provisions were designed to produce. Thus, the Rogers plan would likely reduce pressure on Republican members to seek a compromise to replace sequestration with a deficit-reduction package that secures savings elsewhere in the budget and provides more funding in 2014 and future years for discretionary programs than are provided under sequestration.
Even so, the size of the non-defense cuts in the Rogers plan appears to be raising concerns among some House Republicans. Several, including Chairman Rogers, were quoted when these allocations were approved as stating that the domestic cuts under the Rogers plan would be difficult to pass and could have negative real-world consequences. Chairman Rogers reiterated that sequestration should be replaced, saying, “It needs to be done in the very near term so that these types of devastating cuts do not carry forward into the next fiscal year.”[8] Rep. Tom Cole (R-OK) noted, “Some people seem to think that there’s so much that can be cut but it won’t have any impact on national parks or on federal employment in my area or on my military installations. . . . Some of them will be very happy with it, until it shows up in their district.”[9]
Funding Levels in Rogers Plan Below President’s and Senate’s Levels
Defense funding under the Rogers plan, though significantly above the 2014 post-sequestration BCA cap level, is still modestly below the 2013 pre-sequestration level and the level called for in the House-passed budget resolution, the President’s budget, and the Senate budget resolution; all three of those plans fund defense at the 2014 pre-sequestration BCA level.[10]
The President’s budget and the Senate budget resolution can provide more funding for both defense and non-defense programs than the Rogers plan because they would replace sequestration with a more balanced package that contains other spending cuts and revenue increases.
The Senate has not yet released its subcommittee allocations for 2014, but the Congressional Budget Office (CBO) has estimated the funding provided by the President’s budget by appropriations subcommittee. Table 2 shows the funding for each subcommittee under the Rogers plan relative to the President’s budget.
| Table 2 Discretionary Funding Levels, by Appropriations Subcommittee: 2014 President’s Budget and House Appropriations Committee Allocations | ||||
| ($ in billions) | ||||
| 2014 President (CBO estimate) | 2014 House allocations | House vs. President’s budget | ||
| (dollars) | (percent) | |||
| Agriculture | 20.0 | 19.5 | -0.5 | -2.6% |
| Commerce, Justice, Science | 51.2 | 46.8 | -4.3 | -8.5% |
| Defense | 517.0 | 512.5 | -4.5 | -0.9% |
| Energy and Water Development | 34.5 | 30.4 | -4.1 | -11.8% |
| Financial Services and General Government | 23.4 | 17.0 | -6.5 | -27.6% |
| Homeland Security | 39.0 | 39.0 | -0.0 | -0.1% |
| Interior, Environment | 30.0 | 24.3 | -5.7 | -19.1% |
| Labor, Health and Human Services, Education | 165.8 | 121.8 | -44.0 | -26.5% |
| Legislative Branch | 4.5 | 4.1 | -0.4 | -8.5% |
| Military Construction, Veterans Affairs | 74.7 | 73.3 | -1.4 | -1.8% |
| State, Foreign Operations | 47.9 | 34.1 | -13.8 | -28.8% |
| Transportation, HUD | 51.6 | 44.1 | -7.5 | -14.5% |
| Total | 1,059.5 | 966.9 | -92.6 | -8.7% |
| Note: The President’s budget levels reflect CBO estimates of the President’s proposals, including a proposal to reclassify $1.4 billion in transportation-related funding from discretionary to mandatory. CBO estimates that total discretionary funding under the President’s budget would be slightly above the 2014 BCA pre-sequestration cap level; OMB projects the total would be just below that level. Source: Congressional Budget Office, House Appropriations Committee | ||||
Even under the President’s funding levels, which are designed to conform with the pre-sequestration BCA caps, discretionary funding would be substantially below its level in fiscal year 2010, the last year before Fiscal Commission co-chairs Alan Simpson and Erskine Bowles released their report and Congress began cutting discretionary funding. Since that time, Congress has enacted legislation cutting discretionary funding by $1.6 trillion over the 2014-2023 period even without counting any sequestration savings. Overall discretionary funding under the President’s budget would be 10 percent below the 2010 level, adjusted for inflation.
Appendix:
Calculating 2013 Appropriations After Sequestration
The estimates for fiscal year 2013 appropriations levels are more complicated than in normal years because of the rules related to the Budget Control Act’s statutory caps and to sequestration. This appendix explains the 2013 estimates that we use in this analysis.
| Table 3 Bridge From Original CBO* Scoring of Discretionary Appropriations To Current CBO Estimates, Fiscal Year 2013 | |||
| Discretionary Budget Authority (billions) | |||
| Defense | Non-defense | Total | |
| 2013 appropriations (H.R. 933), as scored by CBO, before sequestration | $552.1 | $490.9 | $1,043.0 |
| OMB** across-the-board cuts to adhere to statutory caps on discretionary funding, and CBO May 2013 reestimates of appropriations | -0.2 | -4.9 | -5.2 |
| 2013 appropriations with updated estimates, before sequestration | 551.9 | 485.9 | 1,037.8 |
| 2013 sequestration applicable to these programs | -34.1 | -21.4 | -55.5 |
| 2013 appropriations, including sequestration | 517.8 | 464.5 | 982.4 |
| Addendum: 2014 discretionary caps, including sequestration | 498.1 | 469.4 | 967.5 |
| * Congressional Budget Office **Office of Management and Budget Note: Amounts cover funding only for regular budget accounts, and so exclude funding designated for war, program integrity, disasters, or emergencies. Totals may not add due to rounding. | |||
Table 3 below begins with the final appropriations for 2013 (provided in H.R. 933), as scored by the Congressional Budget Office.[11] CBO estimated that the bill totaled $1,043.0 billion in budget authority and complied with the BCA’s security and non-security caps for 2013,[12] prior to sequestration. Compliance with the caps, however, is determined by OMB. So, H.R. 933 included a section that allowed OMB, if it estimated that the legislated amounts exceeded the caps, to impose across-the-board cuts to bring security and non-security funding down to the capped levels.
OMB estimated that H.R. 933’s security and non-security funding exceeded the caps by a small amount: 0.2 percent for non-security and 0.032 percent for security funding. Accordingly, the 2013 funding levels for all accounts under H.R. 933 were cut across the board by those percentages so that the resulting levels fully complied with the caps under OMB scoring.
In addition, since its original scoring of the bill, CBO has reestimated some of the non-defense discretionary programs that are open-ended, meaning that their cost depends in part on external factors such as the amount of receipts they collect. In particular, it now estimates that receipts for 2013 from the housing loan guarantee programs run by the Federal Housing Administration and the Government National Mortgage Association will be several billion dollars higher than it earlier expected, which reduces net non-defense budget authority in 2013.
When the above factors — OMB’s across-the-board reductions and CBO’s reestimates — are taken into account, total discretionary funding for 2013 is $1,037.8 billion, prior to sequestration.
Sequestration then reduced this amount by $55.5 billion, bringing total discretionary funding for 2013 down to $982.4 billion.[13] (There are two reasons why the $55.5 billion reduction is smaller than the full $85.3 billion sequestration OMB ordered on March 1. First, the OMB sequestration includes cuts to mandatory programs and to certain discretionary funding — for war, program integrity, disaster, or emergency — that are not included in the totals discussed here or displayed in the table. Second, the discretionary sequestration was reduced by $3.7 billion in defense and $1.2 billion in non-defense programs due to the “crediting” rule. Under the crediting rule, budget accounts that were funded at a lower level in the final appropriations bill than in the continuing resolution as reduced by sequestration receive a smaller reduction when sequestration was re-applied to the final appropriations bill.)
For reference, the 2014 defense and non-defense caps, including sequestration, are listed at the bottom of the table.[14] Although the 2014 non-defense cap exceeds the 2013 post-sequestration level by about $5 billion in nominal terms, this is a bit misleading. There are several reasons why the 2014 caps may be as tight as, or even tighter than, the 2013 post-sequestration level.
In particular, CBO estimates that receipts from the housing loan guarantee programs will be nearly $4 billion lower in 2014 than in 2013; this leaves less room under the caps in 2014 for other non-defense programs than if the receipts stayed at the higher 2013 level.[15]
Similarly, the 2013 levels may reflect one-time measures that were used to meet the 2013 caps but that may not be fully repeatable in 2014. This can include, for example, so-called “CHIMPs,” i.e., changes in mandatory programs that are made in appropriations bills.
Further, there can be differences between CBO estimates (which we rely on for this analysis) and OMB estimates (which are used to determine compliance with caps) that can ultimately affect the total amount of funds available under the caps.
As a result of these various factors, the small increase between 2013 and 2014 that the table shows for non-defense funding is much more likely an artifact of technical estimating rules than an actual increase in available resources for these programs.
End Notes
[1] With the failure of the congressional “supercommittee” to agree on a deficit-reduction plan, the BCA requires sequestration cuts in each year from 2013 through 2021. In 2013, the discretionary sequestration cuts were applied across the board to the enacted appropriations. In 2014-2021, the discretionary sequestration cuts are applied by reducing — before the appropriations bills are designed — the BCA caps on defense and non-defense discretionary funding that would have applied even if the supercommittee had succeeded. Thus, the discretionary sequestration cuts are to be achieved by allocating the amounts to the various appropriations bills such that the total amount of funding provided for the bills is consistent with the lower caps on defense and non-defense funding that apply under sequestration.
[2] Each year, CBO constructs a baseline based on the funding provided for that year. For example, after the 2010 appropriations were completed, CBO constructed a baseline showing the funding required to maintain the 2010 level of services in each future year. We use these CBO baselines to compare funding levels in 2010, 2011, and under the 2014 caps in 2014 dollars.
[3] The 2010 level does not reflect the temporary funding provided by the Recovery Act, which increased 2009 appropriations but was not part of 2010 appropriations.
[4] Kerry Young, “Appropriations Chair Rogers Wants Sequester Deal ‘ASAP,’ ” CQ Roll Call, May 21, 2013.
[5] In February the Congressional Budget Office (CBO) estimated that sequestration would lower the total discretionary cap for 2014 to $966.4 billion; that amount was included in the House-passed budget resolution. On April 10 the Office of Management and Budget) OMB, which is by law in charge of the official estimates of the caps, published a figure of $966.9 billion, and on May 20 OMB corrected that figure (after finding some technical errors) to $967.5 billion, which therefore constitutes the legally binding total. The Rogers 302(b) allocations were based on the now-outdated $966.9 billion figure.
[6] It isn’t possible to precisely measure the amount by which the Rogers plan raises defense funding above the post-sequestration cap set by the BCA because the committee has not provided overall totals for defense and non-defense discretionary funding. It has provided funding for each appropriations bill, but a small share of defense funding is provided outside the Defense appropriations bill in other appropriations bills, like the Energy and Water bill. Thus, we cannot determine precise numbers for total “defense” funding under the Rogers plan that we can compare to the defense funding provided in 2013 or to what is available in 2014 under the BCA’s post-sequestration defense level. However, the committee has released not only the funding total for the Defense appropriations bill but also details for the Military Construction-Veterans Affairs and Homeland Security bills. Together, those pieces accounted for more than 95 percent of total defense funding in 2013. Under the Rogers plan, they would receive an increase of about 5 percent relative to the 2013 post-sequestration level. If the remaining pieces of defense funding were simply funded at last year’s post-sequestration level, then total defense funding would exceed the 2014 BCA post-sequestration level by nearly $47 billion.
[7] Although Table 1 shows that funding for the Transportation-HUD bill in the Rogers plan is 1.6 percent above the 2013 level after sequestration, that figure is misleading because of substantial changes from 2013 to 2014 in the estimated amount of receipts from the housing loan guarantee programs run by the Federal Housing Administration (FHA) and the Government National Mortgage Association (GNMA). FHA and GNMA receipts, which serve as budgetary offsets that reduce the net funding level in the bill, are projected to be $3.7 billion lower in 2014 than in 2013, thereby distorting the comparison between the two years. When these receipts are removed from the bill totals in order to provide an apples-to-apples comparison and convey a more accurate picture of how the remaining HUD and Transportation programs would fare (as shown in the note on Table 1), then the funding for the rest of HUD and the Department of Transportation declines by 5.1 percent between the 2013 post-sequestration level and the 2014 level in the Rogers plan.
[8] Kerry Young, “Appropriations Chair Rogers Wants Sequester Deal ‘ASAP,’ ” CQ Roll Call, May 21, 2013.
[9] Brian Faler, “Appropriators: Get Ready to Be Shocked,” Bloomberg Government, May 20, 2013.
[10] The pre-sequestration level for defense in 2013 and 2014 is roughly $552 billion in both years. Sequestration lowers the defense cap by $54 billion in 2014. As noted, the Rogers plan provides at least $45 billion more than the post-sequestration level, but appears to fall somewhat short of the pre-sequestration level for defense.
[11] CBO’s estimate of $1,043.0 billion includes savings of $18.6 billion through changes in mandatory programs (CHIMPs), in line with established scorekeeping rules that treat these spending changes as discretionary for the purpose of evaluating compliance with budget targets. CBO’s May report has “rebased” the CHIMP savings and so now counts them as mandatory rather than discretionary; for that reason, CBO’s backup data shows total discretionary funding at $1001.0 billion for 2013, $18.6 billion higher than the $982.4 billion figure we use here. We include the CHIMP savings in the totals for ease of comparison with the 2014 caps because similar CHIMP savings will surely be used to comply with the 2014 caps.
[12] The caps for 2013 applied to the categories of security and non-security programs. For 2014, they switch to defense and non-defense. Security is a broader category than defense; it also includes homeland security, veterans, and international affairs programs. Sequestration for 2013, in contrast, applied separately to the defense and non-defense categories.
[13] If the 2013 sequestration is first subtracted from CBO’s scored total of $1,043 billion for 2013 appropriations, the resulting total is $988 billion — the figure that CBO mentions in footnote (a) of Table 3 in its May 2013 baseline report. OMB’s across-the-board cuts and CBO’s reestimates would then reduce the final total to $982.4 billion.
[14] In 2014, sequestration reduces the discretionary caps at the start of the appropriations process, unlike in 2013, when the sequestration reductions came at the end of the appropriations process. See footnote 1 for further explanation. The 2014 post-sequestration levels shown in Table 3 reflect the corrected caps OMB released on May 20th (see footnote 4 for further explanation).
[15] See footnote 6 for further explanation.
More from the Authors

Areas of Expertise

Areas of Expertise