Jared Bernstein Testimony: Tax Expenditures: How Cutting Spending Through the Tax Code Can Lower the Deficit, Improve Efficiency, and Boost Fairness in the US Tax Code
Introduction
Chairman Murray, ranking member Sessions, I thank you for the opportunity to testify today.
These are uniquely challenging times for fiscal policy. Our national economy continues to face a series of self-imposed fiscal deadlines in the forms of cliffs, ceilings, and most recently, sequestration. Various independent analyses find that if these automatic cuts remain in place, they will shave around 0.5% off of 2013 real Gross Domestic Product (GDP) growth and cost our labor market between 500,000 and one million jobs. While I understand that there are often principled stands behind these deadlines, operationally, they have consistently and needlessly damaged an economic recovery that needs your support, not the fiscal drag and uncertainty caused by these manufactured crises.
In that spirit, a significant part of this testimony develops recent bipartisan suggestions that some of our tax expenditures be repealed or reduced. There are numerous rationales for this. First, it is clear that compromise on a deficit-reduction package is blocked by seemingly intractable disagreements about the composition of such a package. Republicans have argued for a “spending-cuts-only” approach while the Presidents and Democrats in this chamber have argued for a package that balances spending cuts and tax increases.
Tax expenditures sit astride both of these categories, because while they are administered through the tax code, many serve the same function as spending programs. Thus, those who believe we have a spending problem should also believe we have a tax expenditure problem. At the same time, since tax expenditures currently forgo over $1 trillion in revenue each year that would otherwise be in the tax base, their reform offers significant contributions to a balanced deal.
Of course, just as not every spending program should be cut, neither should all tax expenditures be repealed or reduced. In discussing examples below, I use three criteria to evaluate the utility of tax expenditures: revenue forgone, efficiency, and fairness. Members will not be surprised that it is far too easy to find many tax expenditures that are “trifectas”: they forego significant revenue, they induce inefficiencies, and they return most of their benefits to the wealthiest households, boosting after-tax inequality and failing on the fairness criterion.
I cannot overemphasize the importance of this last point regarding fairness. As I point out below, not only do we have record high levels of income and wealth inequality in America, but changes in our tax code over the last decade have often exacerbated those inequalities with certain tax expenditures, like favorable treatment for capital gains and opportunities to defer taxation on appreciated assets, contributing to that outcome. These issues took center stage in the last election and President Obama frequently cited a fairer tax code as a central part of his agenda.
In my own work on these issues, I’ve raised concerns about how taxpayers view the legitimacy of the American tax system. If the average taxpayer feels like the privileged can get a much better deal out of the tax code than they can, that system’s legitimacy is at risk, and this is a serious concern for a democracy. In that sense, these revenue issues are not merely about cash flow and budget balancing. They are existential.
My testimony begins by establishing the importance of new tax revenues as part of forthcoming budget deals, then turns to why reforming tax expenditures offers a rich set of opportunities to raise revenues while reducing inefficient spending through the tax code. I then offer numerous examples of tax expenditures that I urge the committee to consider for reform. Finally, I discuss an important dimension of the fairness part of this debate: linkages between the growth of tax expenditures and the growth of income inequality.
Tax Revenues Must Be Part of Ongoing Fiscal Deals
As Chairman Murray emphasized in her budget memo from a few weeks back, Congress and the Administration worked together to achieve around $2.4 trillion in deficit savings, 2013-2022, including (with interest savings) $1.7 trillion in spending cuts and $700 billion in tax increases. Thus, using just the policy changes (leaving off interest savings) in this recent round of deficit reduction, Congress has so far legislated $2.40 of spending cuts for every one dollar of tax increases (note that these numbers reflect neither the sequester nor savings from reduced war spending).
My Center on Budget and Policy Priorities colleague Richard Kogan has updated these estimates for the most recent budget window, 2014-2023, and also added what it would take to stabilize the ratio of debt-to-GDP (the debt ratio) over that window, an accomplishment I would consider the first step to getting the nation on a sustainable fiscal path. The results shown in Table 1 reveal that it would take another $1.5 trillion in savings over this period to stabilize the debt at 73% of GDP.
| Table 1 Deficit Reduction to Stabilize the Debt Cumulative totals, 2014-2023, in billions | |||
| Policy savings | Interest savings | Total deficit reduction | |
| Discretionary savings from cuts in 2011 funding and caps imposed by the BCA | 1,576 | 336 | 1,912 |
| Savings from the ATRA | 732 | 117 | 850 |
| Further savings to stabilize debt at 73% of GDP | 1,327 | 202 | 1,529 |
| Total | 3,636 | 655 | 4,290 |
| Notes: BCA stands for the Budget Control Act, August 2011; ATRA stands for the American Taxpayer Relief Act, January 2013; all savings measured relative to current policy (see Appendix 1) Source: CBPP based on Congressional Budget Office and Joint committee on Taxation data. | |||
Over the longer term, more savings will need to be generated to lower the debt ratio further and achieve more lasting fiscal stability, a point that is well-appreciated by analysts from all sides of the debate. But policymakers’ initial focus should be to implement the savings needed to stop the nation’s stock of debt from growing faster than the economy (GDP growth) and to do so in a balanced way including new revenues and new spending cuts.
As this committee well knows given the ongoing debate over the sequester, this raises the question as to how best to raise this next $1.5 trillion. The same Chairman’s memo noted above makes the following point regarding bipartisan plans, including the original Simpson-Bowles plan and the Senate’s “Gang of Six”:
These bipartisan frameworks include significant new revenue and have far more balance between spending cuts and revenue increases than the deficit reduction measures we’ve enacted to date. For instance, the President’s Fiscal Commission and the Senate’s Gang of Six each proposed roughly $4.8 trillion in deficit reduction over the 2012-2021 period with over $2 trillion coming in the form of new revenue. Excluding the interest savings of roughly $800 billion, the two bipartisan efforts proposed a roughly 1:1 ratio of spending and revenue savings…
Further, measured over the same ten-year window used to estimate the effects of the ATRA legislation (2013-2022), the two bipartisan efforts each provide for revenue of between $2.4 trillion and $2.5 trillion, or roughly four times the amount of new revenue to be generated by the year-end deal [ATRA].
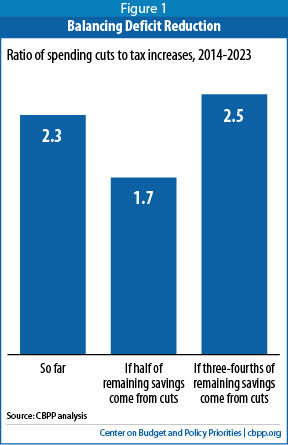
Figure 1 shows that ratio of cuts to revenues prevailing so far and the ratio if Congress were to split the needed $1.5 trillion between both budget categories (using data from Table 1, i.e., CBPP’s update to 2014-2023). An even split at this point would still not reach the roughly 1:1 ratio proposed by the earlier commissions, but it would narrow the ratio some, bringing it to 1.7 to 1.[1] On the other hand, a 75/25 split (cuts to revenues) would result in a less balanced split than the current ratio.
Thus, a balanced plan requires new revenues as part of the deal. I recognize that this flies in the face of a recent partisan position that essentially maintains “we’ve already raised taxes and we won’t do it again.” I believe that the analysis above, using standard, widely-accepted estimates, reveals that position to make no more sense than were partisans on the other side were to say “we’ve already cut spending, we’re not going to do it again.” Achieving our medium-term goal of debt stabilization will require compromise, which in practice implies both new revenues and new spending cuts.
Tax Expenditure Reform
The above analysis raises the question as to how new revenues should be raised. As President Obama has suggested, and many members of Congress from both parties have at various times agreed, the right place to start is by reducing or repealing certain tax expenditures.
There are good, substantive reasons for the bipartisan appeal of tax expenditure reform. First, it is increasingly recognized by experts including President Reagan’s former chief economist Martin Feldstein and current CBO director Doug Elmendorf that in many cases, tax expenditures are simply ways of spending through the tax code.[3] Marr et al (2013) point out that child care assistance and education supports are provided both through spending programs and through tax expenditures, but the distinctions are substantively meaningless. For example, Pell Grants and subsidized child care are both spending programs that help low- and moderate-income families afford college and child care, respectively; “529 accounts” (tax deferred savings for college) and the child care tax credit are tax expenditures that serve the same purposes for higher-income families.
All of these programs provide help acquiring services that Congress has deemed to be worthy. Why should the difference in their delivery mechanisms — the tax code on one side or direct spending from general outlays on the other — determine which ones get cut in the service of deficit reduction? In that regard, policymakers who believe we have a spending problem must also believe we have a tax expenditure problem.
For other policymakers seeking a balanced approach to deficit reduction, cutting regressive tax expenditures that have little economic rationale makes obvious sense, especially given that the Treasury now forgoes more than $1 trillion in revenues from tax expenditures each year and, as emphasized below, most of their benefits flow to those at the top of the income scale, thus exacerbating the problem of high and growing income inequality.
Finally, economists agree that some of the tax expenditures have distortionary economic effects, distorting price signals and providing inefficient subsidies.
So, reforming — as in restructuring, cutting back, or repealing — certain tax expenditures has three very important benefits right now: they offer a balanced path to deficit reduction, they cut spending through the tax code, and their reduction can add both fairness and efficiency to the tax code. The next sections demonstrate these points.
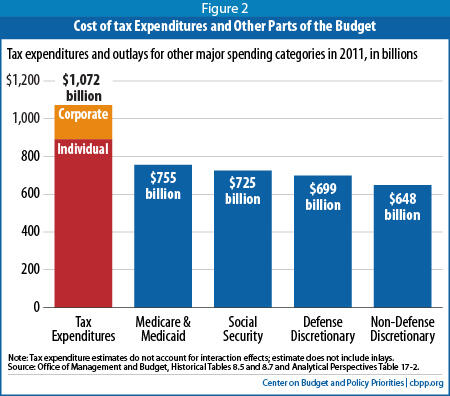
--Tax Expenditures Now Cost the Treasury Over $1 Trillion in Annual Revenue Forgone: as Figure 2 below, from Marr et al (2013), shows, tax expenditures are now greater than these other major spending categories of the budget. As a share of GDP, total tax expenditures were cut significantly in the 1986 tax reform, but “subsequently re-bounded, recovering more than half their decline from tax reform GDP,” and now are worth about 7% of GDP.[4] As noted above, many of these expenditures through the tax code are economically indistinguishable from spending through the mandatory or discretionary sides of the budget. And as Figure 2 reveals, if tax expenditures were classified as spending, they’d be the largest category in the budget.
--Tax Expenditures Disproportionately Benefit the Well Off: as discussed in greater detail in the next section, most, though certainly not all, of the benefits of tax expenditures flow to households at the top of the household income distribution. One reason for this skewed outcome is that the majority of individual tax expenditures (around 70%) take the form of tax deductions or exemptions whose value increases with tax brackets and thus with household income. As Marr et al point out:
As a result, these tax expenditures provide their largest subsidies to high-income people even though those are the individuals least likely to need a financial incentive to engage in the activities that tax incentives are generally designed to promote, such as buying a home, sending a child to college, or saving for retirement. Meanwhile, middle-class families receive considerably smaller tax-expenditure benefits for engaging in these activities. In this regard, these tax expenditures are “upside down,” which makes them less efficient, as well as less equitable.
These authors also provide the following example, using the mortgage interest deduction, a tax expenditure that cost the Treasury over $600 billion (2013-17) in forgone revenue:
Consider how the deduction for home mortgage interest affects two households’ decisions to buy a home. An investment banker making $675,000 who has a $1 million mortgage and pays $40,000 in mortgage interest each year receives a housing subsidy of about $14,000 annually from the mortgage interest deduction. By contrast, a middle-class family led by a nurse making $60,000, and paying $10,000 a year in mortgage interest on a more modest home, receives a housing subsidy worth $1,500 annually. Not only does the mortgage interest deduction provide the high-income banker with a larger total subsidy (in dollar terms) than the nurse, but the subsidy also represents a greater share of the banker’s mortgage interest expenses. In fact, the proportion of the banker’s mortgage interest expense covered by the subsidy is more than twice as large as the percentage subsidy that the nurse receives.
--Tax Expenditures Are Often Inefficient: the regressive aspect of many tax expenditures just noted also makes them inefficient. By disproportionately subsidizing higher-income households that are relatively less income constrained, these tax breaks help offset the costs of economic activities that would likely have occurred even without the subsidy. Both theory and evidence support the view that to be most effective in incentivizing desired behaviors, whether that’s home ownership, saving, work, or investment, tax policies must reach those most likely to respond to the incentive.
Here, the “upside down” design of the credits contributes to their inefficiency. Since wealthier households are more likely to purchase a home, save, invest in capital assets, send their kids to college, and so on, without any incentives relative to lower-income households, tax expenditures that disproportionately reach the wealthy, as most do (see Figure 3 below), are inefficiently targeted.
Tax expenditures are also inefficient in that they can distort prices and production in sectors of the market where they channel significant tax breaks. The mortgage interest deduction again provides a good example of the impact of these inefficiencies on the housing market. Analysts widely agree that in its current structure it subsidizes home purchases that would be made anyway, and thus leads to an inefficient subsidy that artificially inflates both the market prices and the size of home purchases, particularly among the most well off.
Another example, one that is perhaps underappreciated relative to the mortgage interest deduction, is the large variation tax expenditures generate in tax rates across industries leading to the misallocation of capital and dampening innovation and growth. Recent Treasury Department analysis shows that due to the variation of tax expenditures across industries, average tax rates ranged from 14% to 31% (around a mean of 26%) and importantly in terms of investment behavior, effective marginal rates (as opposed to average rates) differed widely as well:[5]
“For example, because of accelerated depreciation and other features of the tax code, in 2005 income from a typical investment in structures for oil and gas faced an effective total marginal tax rate (including corporate and investor level taxes) of about 9 percent as compared to a 32 percent rate for manufacturing buildings.”
Other examples of distortionary tax breaks are not categorized as tax expenditures but work in much the same way, privileging a certain type of income or activity in ways that lose significant revenue while violating efficiency and fairness criteria. For example, by allowing the deduction of interest expenses, our tax code heavily favors debt financing over equity financing (the effective rate on debt financing is, in fact, negative). This incentivizes financial leverage which both helps inflate debt bubbles and leaves the economy more vulnerable to shocks when those bubbles burst. A 2009 International Monetary Fund report concluded that large biases toward debt financing in the tax code is “hard to justify given the potential impact on financial stability” and that “one lesson of the [recent financial] crisis may be that the benefits from mitigating [these biases] are far greater than previously thought.”[6]
Another example is the incentive of corporations to structure themselves as so-called “S corporations” in order to pass corporate profits through to the individual side of the tax code. Thirty years ago, pass-through entities accounted for around a quarter of business income; recent data from the late 2000s show that they now account for about 70%.[7]
Here again, such restructuring is not done in pursuit of economic efficiencies, but in pursuit of tax advantages, leading to inefficient allocation and lost revenue. As the Treasury report states: “By allowing large pass-through entities preferential treatment, the tax code distorts choices of organizational form, which can lead to losses in economic efficiency; business managers should make choices about organizational form based on criteria other than tax treatment.”
--Specific Tax Expenditures Worth Reducing or Repealing: along with the ones noted above, here are a few other examples of tax expenditures that policymakers should take a critical look at from the three perspectives I’ve highlighted throughout: forgone revenues, fairness, and equity (this section borrows heavily from Marr et al, 2013).
Carried Interest Loophole: a common and often distortionary problem with tax expenditures involves privileging one type of income over another, creating an incentive for taxpayers to redefine their income to meet the favored definition. A potent current example of this is the carried interest loophole which allows managers of investment funds to redefine their earnings as capital gains, allowing them to pay a top tax rate of 20% — the capital gains rate — instead of almost 40%.
Many of these managers are paid 20% of the profits on the funds they manage and even though they may have none of their own capital in the fund, this part of their compensation is taxed at the lower capital gains rate. Closing this loophole would raise around $15 billion in revenue currently forgone over the next decade (and if fund managers happened to have some of their own capital in the fund, once this loophole is closed, their realized gains would be taxed at the lower rate).
Various Types of Deferrals: I still recall from a line from my public finance textbook from many decades back: taxes deferred are taxes saved. To the extent that tax expenditures shield various types of income — foreign earnings, bequests to heirs, debt-financing — from taxation, revenue is lost, inefficiencies can be generated, and fairness is violated.
For example, a sale of property that gained value since it was acquired would normally trigger a capital gains tax liability. But if the property is exchanged for a “like-kind” property (or business), the tax liability is deferred. Originally, like-kind exchanges protected small farmers trading acreage or barter transactions from taxation, but it has grown into a major tax avoidance scheme for sellers of large assets such as commercial real estate or oil wells. Moreover, Marr et al point out that “…if the owner passes the property to an heir instead of selling it, capital gains tax is not just deferred but permanently eliminated, since capital gains become exempt from taxation once the individual who owns the asset dies.” These authors also note that full repeal of this tax expenditure would raise about $18 billion over 10 years.
A much larger amount of revenue forgone comes from the ability of multinational corporations to defer taxation on profits earned by foreign subsidiaries, a privilege domestic firms lack. Since most firms with overseas operations can, in practice, defer repatriation of their profits (at which point they’d be taxed as corporate income) for as long as they want, they have a strong incentive to both reinvest their income abroad and/or shift their operations, or at least their profits, to low-tax havens.
Deferral in this case thus violates all three criteria: it is inefficient for firms to make investment and location choices based on tax savings versus production or sales efficiencies, considerable revenue is forgone, and since small businesses and domestic firms don’t face this option, it provides multinationals with a strong comparative advantage over domestic firms and thus fails on fairness grounds as well. It is notable that as regards two of these criteria, the non-partisan Congressional Budget Office (CBO) recently noted that “…eliminating or curtailing deferral of U.S. taxes on income earned abroad… would dampen incentives to shift investment or reported income on the basis of concerns about tax liability. As a result, those options would generally lead to more economically efficient business investment and increase corporate tax revenues from firms that remained incorporated in the United States.”
CBO goes on, however, to warn that this change has the potential to incentivize more firms to incorporate abroad to avoid US corporate taxation. Even so, they judge that “[o]n balance…eliminating deferral would boost both efficiency and tax revenues. In fact, eliminating deferral entirely would boost U.S. tax revenues by more than $100 billion over a 10-year period, according to an estimate by the staff of the Joint Committee on Taxation (JCT).”
Tax Expenditures and Inequality
Extensive research from disparate sources reveals that income inequality, both before and after tax, is at historically high levels. Prior to the recent recession, pre-tax market income inequality (i.e., without transfers; with realized capital gains) had grown to levels of concentration not seen since the Great Depression.[8] For example, the share of income going to the top 1% was about 10% in the late 1970s, but had doubled by the end of the 2000s expansion, and now stands at 19.8%. Wealth holdings are even more concentrated than income.[9]
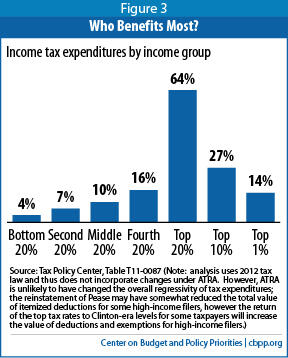
Figure 3, using data from the non-partisan Tax Policy Center, shows how individual income tax expenditures can amplify pretax trends toward higher income inequality, as their benefits flow disproportionately to those at the top of income scale. Fully two-thirds of the benefits go to households in the top fifth of the income scale, half go the top 10%, and 26% of the benefits go to households in the top 1%, whose average income is about $2 million.[11]
In what specific ways do tax expenditures contribute to this problem of growing income inequality, and more specifically, diminished income mobility? As noted, one way is through providing favorable tax treatment to forms of income that are concentrated at the top of the scale, such as realized capital gains and dividend payouts. Another is through protecting appreciated wealth holdings from taxation when they are transferred between generations. For example, heirs who inherit wealth from a deceased relative do not have to pay capital gains taxes because of the “stepped-up basis” exemption, which exempts any accrued gains from taxation. Similarly, by transferring family assets to a family limited partnership and restricting access to the partnership for a few years, parents can transfer their wealth to their children at a highly discounted value. Once the restriction period is over and heirs claim the assets, such “valuation discounts” enable them to benefit from the full value of the asset while incurring a minimal wealth tax liability.
It should also be noted that permanent changes recently enacted in wealth taxation already make this part of the tax code less progressive. Under the tax deal passed to resolve the fiscal cliff, wealthy couples face zero taxes on wealth transfers up to $10.5 million. According to TPC estimates, this cutoff shields all but the top 0.14% estates from any liability, and the small number that do face the tax pay an effective rate of only 17%.[12] This increased regressivity now locked into the tax code is all the more reason to close tax expenditure loopholes which further protect wealth transfers from taxation.
Conclusion
As we meet today, our already-too-weak economy is taking a hit from a mindless set of across-the-board spending cuts that neither party endorses. Yet compromise on the components of a deficit-reduction package to offset the sequester has been elusive as members continue to disagree on whether the package should be balanced between revenues and spending cuts, or just have spending cuts alone.
Tax expenditure reform should offer a solution palatable to both sides. Though they operate through the tax code, many of these programs are indistinguishable from spending programs. In that regard, policymakers who believe the federal government has a spending problem should thus also believe it has a tax expenditure problem. Moreover, many tax expenditures fail on both efficiency and fairness criteria. Finally, as I have pointed out throughout, tax expenditures forgo significant revenue and thus could handily be part of a balanced deal.
In fact, in light of this logic, policymakers of both parties have advocated for reducing or repealing tax expenditures. Yet, even ones that are widely agreed to be quite egregious, like the carried interest loophole discussed above, remain in place. Clearly, politics makes it a serious challenge for would-be reformers to pick and choose who wins and who loses when it comes to tax expenditure reform.
That’s why part of the way forward may well be to cap most deductions for taxpayers above a certain income level. This solution scores highly on the three criteria I’ve stressed throughout. President Obama has proposed to limit the value of itemized deductions and certain other tax expenditures to 28 cents on the dollar, which would raise about $500 billion in revenue, otherwise forgone, over the next decade. Regarding the fairness criterion, it reduces the “upside down” problem, by partially closing the gap between the value of deductions claimed by those with the highest incomes relative to lower income tax units. And while the lower deduction amount reduces incentives at the margin, such incentives still exist, a feature which distinguishes this approach to reform tax expenditures to those which cap expenditures at a certain dollar amount or at a set percentage of income. Under those approaches, no marginal incentives exist above the cap.
Still, such a cap would miss other tax expenditures that are also ripe for reform, including carried interest, like-kind exchanges, and some of the other deferral loopholes noted above.
In sum, tax expenditure reform offers an excellent option to reduce wasteful spending through the tax system, while helping to meet our fiscal challenges in ways that will simultaneously improve our deficit outlook, increase economic efficiency, and add much-needed fairness back into the code.
I thank Grace Leeper, Chye-Ching Huang, and Nate Frentz for help in preparing this testimony, though any mistakes are my own. The testimony borrows heavily from the recent CBPP paper “Tax Expenditure Reform: An Essential Ingredient of Needed Deficit Reduction” by Chuck Marr, Chye-Ching Huang, and Joel Friedman.
End Notes
[1] The $732 billion in ATRA savings in Table 1 include $29 billion in program cuts (as opposed to tax increases); I’ve adjusted the numbers accordingly in the figure.
[2] See this piece by Chye-Ching Huang, http://www.offthechartsblog.org/both-sides-have-offered-higher-revenues-than-those-in-fiscal-cliff-deal/.
[3] See recent testimony by Robert Greenstein on these points: https://www.cbpp.org/cms/index.cfm?fa=view&id=3908.
[4] See http://www.taxpolicycenter.org/UploadedPDF/412404-Tax-Expenditure-Trends.pdf.
[5] See http://www.treasury.gov/resource-center/tax-policy/Documents/The-Presidents-Framework-for-Business-Tax-Reform-02-22-2012.pdf.
[6] International Monetary Fund, “Debt Bias and Other Distortions: Crisis-Related Issues in Tax Policy,” June 12, 2009, www.imf.org/external/np/pp/eng/2009/061209.pdf.
[7] This trend towards S corporation income continued even through the Clinton era, when, like today, the statutory corporate rate was set below the top marginal individual tax rate.
[8] See, for example, this recent analysis by Emmanuel Saez: http://elsa.berkeley.edu/~saez/saez-UStopincomes-2011.pdf.
[9] Research by the Economic Policy Institute finds that in 2010, the top 1% held 17% of household income but 35% of household wealth (net worth). See http://stateofworkingamerica.org/files/book/Chapter6-Wealth.pdf, table 6.1.
[10] See http://www.irs.gov/pub/irs-soi/09intop400.pdf.
[11] These data are for 2015 but reflect 2012 federal tax law. Thus, they do not reflect changes under ATRA, but those changes would not alter the results much at all.
[12] Tax Policy Center table T13-0020.