Testimony of Robert Greenstein, President, Before Senate Budget Committee
I appreciate the invitation to testify today on the impact of federal budget decisions on families and communities. This is an important matter. As you know, the nation will have to make tough decisions to put the budget on a more sustainable fiscal course. The issue is not only whether policymakers act to secure adequate deficit reduction, but also how that is done.
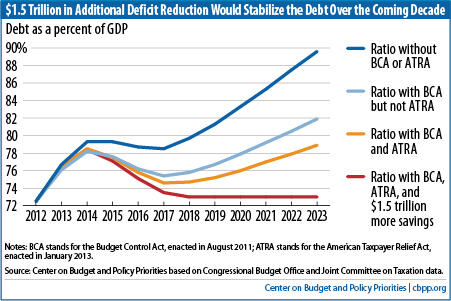
On Monday, we issued an analysis that finds (based on the new Congressional Budget Office projections, with several adjustments that analysts commonly make to reflect the cost of continuing current policies[1] ) that policymakers could stabilize the public debt over the coming decade with $1.5 trillion in additional deficit reduction. Policymakers could achieve these savings with $1.3 trillion in policy savings (that is, spending cuts and tax increases), which would generate about $200 billion in savings in interest payments. The $1.5 trillion in total savings would stabilize the debt at 73 percent of gross domestic product (GDP) over the latter part of the decade. (Stabilizing the debt at a somewhat lower level of GDP would require a larger amount of deficit reduction; stabilizing at a somewhat higher level of GDP would require a lesser amount of deficit reduction.)
The fact that $1.5 trillion in deficit savings (rather than a much larger amount) would stabilize the debt over the coming decade at about the 2012 debt-to-GDP ratio is primarily due to two factors. First, Congress and the President have enacted significant deficit reduction over the two-plus years since the Bowles-Simpson report and Rivlin-Domenici task force made major deficit reduction proposals; over this period, policymakers have enacted nearly $1.5 trillion in spending cuts for appropriated programs (relative to the CBO baseline in use at the time of the Bowles-Simpson and Rivlin-Dominici reports), mainly through the annual caps enacted in the 2011 Budget Control Act, as well as nearly $600 billion in revenue increases in ATRA. Including the related savings in interest payments, policymakers have achieved about $2.35 trillion in deficit reduction so far. (Other analysts like those at the Committee for Responsible Federal Budget use the same $2.35 trilliion savings estimate.) These savings are for the ten-year budget window of 2013-2022. Over the new budget window of 2014-2023, the same policies are estimated to produce savings of $2.75 trillion, as Table 1 indicates.
| Table 1 Deficit Reduction to Stabilize the Debt Cumulative totals, 2014-2023, in billions | |||
| Policy savings | Interest savings | Total deficit reduction | |
| Discretionary savings from cuts in 2011 funding and caps imposed by the BCA | 1,576 | 336 | 1,912 |
| Savings from the ATRA | 732 | 117 | 850 |
| Further savings to stabilize debt at 73% of GDP | 1,327 | 202 | 1,529 |
| TOTAL | 3,636 | 655 | 4,290 |
| Notes: BCA stands for the Budget Control Act, August 2011; ATRA stands for the American Taxpayer Relief Act, January 2013; all savings measured relative to current policy (see Appendix I) Source: Center on Budget and Policy Priorities based on Congressional Budget Office and Joint Committee on Taxation data. | |||
The other factor is that CBO’s economic and technical projections have improved over the past few years. Not counting the reductions in discretionary funding and the savings from ATRA, the new projections reduce estimated deficits under current policies by about $750 billion over the coming decade, relative to CBO’s forecast of last March. Relative to CBO’s August 2010 forecast, which the Bowles-Simpson and Rivlin-Domenici panels relied upon for their reports, the new CBO economic and technical projections reduce estimated deficits by about $1.3 trillion.
Is Stabilizing the Debt the Right Target?
Stabilizing the debt-to-GDP ratio over the coming decade — so the debt grows no faster than the economy — is the minimum appropriate budget policy. Stabilizing the debt at 73 percent of GDP would require shrinking annual deficits to below 3 percent of GDP.
Stabilizing the debt ratio for the decade ahead would still require policymakers to enact additional deficit reduction for the long-term. In ensuing decades, the aging of the population and increases in per-capita health care costs (which are likely to rise faster than per-capita GDP) will raise costs for health and retirement programs, returning the budget to a path where debt is increasing as a share of the economy.
Some call for greater deficit reduction now in order to achieve a declining debt ratio, citing these long-term trends. Enacting larger deficit reduction now would require deeperprogram cuts, larger revenue increases, or both. At issue here is the quality of these policy choices. One concern is that enacting steeper deficit reduction now could lead policymakers to make decisions, particularly in the health care arena, where desired solutions currently are elusive and knowledge about effective ways to slow health care cost growth is likely to be greater in coming years, due to changes now underway in the health care sector and various research and demonstration projects.
To be sure, policymakers can enact measures now, as part of a balanced deficit reduction package, that would achieve significant Medicare savings for the decade ahead without jeopardizing the quality of care or access to care. But rushing now to enact cuts much deeper than that in federal health spending could result in measures that largely shift costs to states, individuals, and private employers and harm some of the most vulnerable members of society, while failing to address the underlying causes of the unsustainable growth in costs across the U.S. health care system. (Analysts have found that some proposals to enact large cuts in Medicare or other health programs would actually increase total U.S. health care costs, not a desirable outcome.)
Stabilizing the debt for the coming decade would give policymakers time to figure out how to slow the growth of health care costs throughout the U.S. health care system without impairing the quality of care. While stabilizing the debt during the decade ahead won’t permanently solve our fiscal problems, it would represent a significant accomplishment.
Designing Deficit Reduction
Given the continued weakness in the economy — with the unemployment rate still close to 8 percent and CBO projecting that it will take four more years for the economy to recover fully — deficit reduction needs to be designed carefully to avoid making the recovery even slower. Deficit reduction should be phased in over coming years. Preferably, policymakers would couple some temporary fiscal measures to accelerate growth and job creation now with permanent deficit reduction measures.
And the design of permanent deficit reduction measures matters. Deficit reduction should be secured through well-designed, balanced policies that do not impede the economic recovery and don’t jeopardize future productivity growth (by providing inadequate resources for areas like education, infrastructure, and basic research), don’t increase poverty and inequality (which already are larger in the United States than in most of the Western world), and don’t sacrifice health care quality or access or raise overall U.S. health care costs. The quantity of deficit reduction over the next ten years is not the only important issue; the quality of the deficit reduction measures adopted matters as well.
Deficit Reduction and the Well-Being of Americans of Modest Means
The Bowles-Simpson report made it a core principle that deficit reduction should not increase poverty or harm the disadvantaged. It largely shielded core programs for the disadvantaged from the cuts that it recommended. It also sought to design its revenue increases so they would maintain or improve the progressivity of the tax code.
These principles and design features are also reflected in the plan presented in July 2011 by the Senate’s bipartisan “Gang of Six.” (They have also been highlighted by a group of Christian leaders that ranges from the Catholic Bishops’ Conference and the Episcopal Church to the Salvation Army and the National Association of Evangelicals, which has issued a call for policymakers to safeguard the poor in deficit reduction and draw a “circle of protection” around programs targeted on them.)
Our current system of supports for low-income families and individuals surely isn’t perfect. But it does a great deal of good for tens of millions of our less fortunate fellow citizens. Using a measure of poverty that many analysts favor because it counts rather than ignores major benefits like food stamps and refundable tax credits — the Census Bureau’s Supplemental Poverty Measure — we see that the poverty rate would have been 29 percent in 2010 without government assistance. But it stood at 15 percent when those benefits were counted. In other words, the safety net cuts U.S. poverty nearly in half, compared to what it would otherwise be.
Of course, it may be that in the absence of safety net programs, some people might have worked more (although it is hard to see where the additional jobs would have come from in 2010, given the depressed labor market). But the impact of the safety net on poverty, including its effect on work, has been studied extensively. In a recent comprehensive review and synthesis of the research literature, some of the field’s leading scholars examined the impact of the safety net on the amount that people work and found the safety net’s overall impact on work to be small. They found that, after taking behavioral effects into account, the safety net lowers the U.S. poverty rate by approximately 14 percentage points. In other words, one of every seven Americans — more than 40 million people — would be poor without the safety net but are above the poverty line because of it.[2]
One can also look at the Census data on how many people individual programs lift out of poverty. In 2010, for example, the Earned Income Tax Credit and the Child Tax Credit lifted about 9 million people in low-income working families above the poverty line, including 5 million children. SNAP (formerly called the Food Stamp Program) lifted about 4 million out of poverty.
Among the most striking figures are those that track poverty rates over the last few years. Given the depth and severity of the Great Recession, one would have expected poverty to have soared. It didn’t. The Census Bureau’s broad poverty measures show relatively modest increases in poverty, which stands in sharp contrast to the deep plunge in the economy and the doubling of the unemployment rate. Why didn’t poverty rise much more as unemployment rocketed upward? The “automatic stabilizer” response of programs like SNAP and unemployment insurance, supplemented by the temporary increases in assistance in various safety net programs provided under the Recovery Act, counteracted most of the increase in poverty that would otherwise have occurred.
Issues Related to the Safety Net and Criticisms of It
Various questions are raised about safety net programs. These include its impact on dependency and on our long-term fiscal problems.
Over the past several decades, the United States has moved heavily toward what analysts call a “work-based safety net.” Cash welfare assistance for families without earnings has diminished greatly, while support for the working poor and near poor through the EITC, the Child Tax Credit, Medicaid, and SNAP has increased. The results are notable. Even though 2010 was a year of economic distress, with an average unemployment rate of 9.6 percent, it was marked by the following results:
- Some 91 percent of all spending on federal entitlement benefits in 2010 went to people who either aren’t expected to work because they are 65 or older or disabled, or were members of working households (with work defined as a household with a member who worked more than 1,000 hours during the year).Image
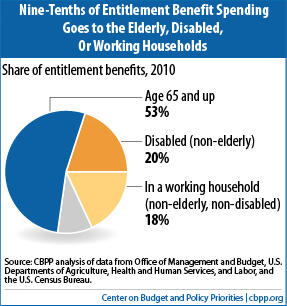
- Seven of the other nine percentage points of entitlement benefits went for unemployment insurance that people must have a significant recent work history to qualify for, Social Security survivor benefits for widows and orphans of deceased workers, Social Security benefits for retired workers aged 62-64, or medical care.
Concerns that the safety net is leading millions to become dependent and cease working are not borne out by the research. (I believe, however, that we should explore ways to encourage more people nearing retirement age to work longer. The challenge there is to find ways to do so without impoverishing people in that age bracket who can’t work or can’t find a job because of their occupational background or skills or because of health issues.)
A second issue — and an important one in the current budgetary context — involves the safety net’s cost trajectory. The nation faces a significant long-term fiscal problem as a result of a large projected imbalance between revenues and expenditures. Under current policies, expenditures will climb as a percentage of GDP, while revenues remain at levels that are low relative to need, given the aging of the population and continuing increases in health care costs throughout the health care system.
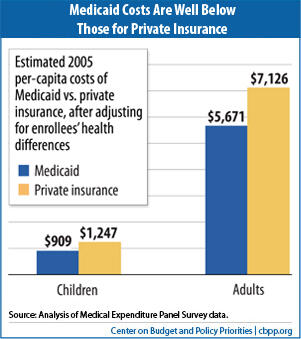
As is well known, Medicaid is projected to rise in cost for various reasons. Health care costs throughout the entire U.S. health care system — in both the public and private sectors — have been growing faster than GDP for several decades. Medicaid isn’t the cause of this systemwide cost growth, and over the past decade, Medicaid costs per-beneficiary have been rising more slowly than per-beneficiary costs under private insurance. Moreover, Medicaid costs per beneficiary (adjusted for differences in health status) are substantially lower than those under private insurance (because Medicaid pays providers lower rates and has lower administrative costs.
But systemwide health care cost increases, driven in part by medical advances that improve health and lengthen life but add to costs, will push up health care costs across-the-board.
A second reason that Medicaid costs will rise is the aging of the population. Older people have much higher average health care costs than younger people do. Elderly and disabled beneficiaries account for 25 percent of Medicaid beneficiaries today but 68 percent of program costs. As the population ages, the number and share of beneficiaries who are elderly will rise, increasing program costs.
Another reason that Medicaid costs will rise is the continued erosion of employer-based health coverage. Over time, fewer low-income people are able to get coverage through their (or a family member’s) employer, causing more of them to turn for coverage to Medicaid.
Finally, the coverage expansions in the Affordable Care Act — both in Medicaid and for subsidies to help near-poor and many middle-income families afford coverage in the new health insurance exchanges — will raise expenditures for means-tested health care expenditures as coverage is extended to millions of uninsured Americans (although CBO projects that these expenditure increases will not add to deficits because the costs are offset under the Affordable Care Act, primarily through savings in Medicare and new revenues).
For these reasons, if one looks at total means-tested program costs, they appear to remain high in the years to come. But if one examines costs for means-tested programs other than health care programs, the picture changes dramatically. Means-tested programs outside of health insurance will decline in cost as the economy recovers and are not projected to rise in future decades as a percentage of GDP. Here are the data, which come from the official historical tables on federal budget expenditures and the new CBO projections of future expenditures.
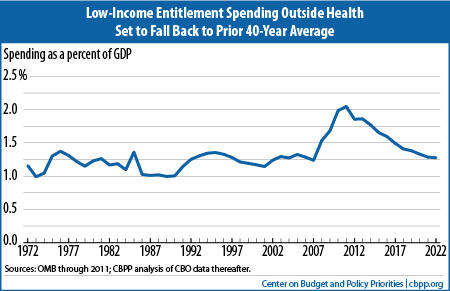
- In fiscal year 2011, total federal expenditures for means-tested entitlement (or mandatory) programs outside health care programs equaled 2.0 percent of GDP. This was about 50 percent higher than the average for the prior 40 years — which was 1.3 percent of GDP. The costs of these programs have risen significantly in the last few years.[3]
- But, the recent increases are largely driven by the economic downturn and temporary program expansions under the Recovery Act. The CBO projections show that total expenditures for means-tested entitlements outside health care will decline steadily as a share of the economy as the economy recovers, falling to 1.3 percent of GDP by 2020 and thereafter. (These figures do notassume savings under sequestration.)
- In other words, by 2020, total means-tested entitlement expenditures outside health care, measured as a share of GDP — including expenditures for SNAP, the EITC, and other programs — will return all of the way to their prior 40-year average.
- The foregoing figures do not include low-income discretionary programs. Under the Budget
- Control Act’s caps, non-defense discretionary spending will fall over the decade to its lowest level as a share of GDP since 1962. As a result, some decline in low-income discretionary programs appears inevitable. Thus, total expenditures on low-income (or means-tested) programs outside health care, including low-income discretionary programs, are expected to decline over the coming decade to a level below their average over the prior 40-year period. This indicates that this part of the budget isn’t contributing to the long-term fiscal problem.
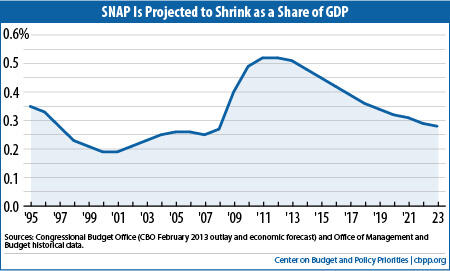
I would also briefly note that there has been particular misunderstanding of what is happening with expenditures for the SNAP program. SNAP participation and costs have risen substantially in recent years. But CBO projects that SNAP caseloads and expenditures will decline markedly as unemployment and poverty fall. The graph on the next page shows actual SNAP costs, as a share of GDP, from 1995 to the present, and CBO’s projection of costs as a percentage of GDP through 2023. As the graph indicates, by 2018, costs are expected to decline back to their mid-1990s level as a percentage of GDP, and then to edge below that.
Finally, I would note that over recent decades, the minimum wage has been allowed to erode and is now 20 percent lower, after adjusting for inflation, than in the late 1960s. For this and a number of other reasons (relating in part to globalization of the economy), wages for low-paid jobs have fallen. Partly in response, policymakers also have expanded refundable tax credits for low-income working families with children, principally the EITC — which has offset part of the wage decline for working parents with children. Any examination of increases in federal costs for refundable tax credits and other supports for low-income working families’ needs to be put in the context of what has happened to these families’ wages.
Beneficial Effects of Programs to Assist People of Modest Means
A focus simply on the extent to which various assistance programs lift low-income Americans above the poverty line or lessen the severity of their poverty (or, for that matter, a focus simply on their budgetary costs) is too narrow. An extensive body of research finds that various of these programs also have other important effects.
A strong body of research finds, for example, that the Earned Income Tax Credit increases work substantially, especially among single mothers.[4] The research indicates, in fact, that the expansion of the EITC in the 1990s had as large or larger an effect in inducing more single mothers to go to work than the changes in the 1996 welfare law. (The EITC and the welfare changes reinforced each other in this respect.) The research similarly finds that the EITC likely contributed as much to the decline in cash welfare receipt among female-headed families as did time limits and other welfare reforms.[5]
Of particular note is the growing body of research which finds that certain types of assistance for low-income families can have significant positive long-term effects, especially on children, such as improvements in educational success, children’s health status, and their future labor-market outcomes.
- A growing body of research finds that programs that supplement the earnings of low-income working families — like the EITC and the low-income component of the Child Tax Credit — boost children’s school achievement and are associated with increased work and earnings in adulthood. (Economists Raj Chetty and John N. Friedman of Harvard University and Jonah Rockoff of Columbia University analyzed school data for grades 3-8 from a large urban school district and found that additional income from the EITC and CTC leads to significant increases in students’ test scores. [6] Economists Gordon B. Dahl of the University of California, San Diego and Lance Lochner of the University of Western Ontario concluded, after studying nearly two decades of data on mothers and their children, that additional income from the EITC significantly raises students’ math and reading test scores.[7] )
- The beneficial effects of the EITC and CTC appear to follow children into adulthood. Harvard's Chetty and his co-authors note evidence that test score gains can lead to significant improvements in students’ later earnings and employment rates when they become adults.[8]
- These findings are consistent with other research that followed poor children from early childhood into their adult years and found that significant increases in the incomes of these children’s families led to enduring beneficial effects. The researchers found that each additional $3,000 in annual income in early childhood (whether from earnings or government assistance) was associated with more hours of work and an additional 17 percent in annual earnings in young adulthood.[9]
- Recent research on Head Start also is noteworthy. David Deming of Harvard found that children who participated in Head Start subsequently measured better on young-adult outcomes that included high school completion, being out of work and out of school, and poor health. Deming concluded that Head Start, “…closes one-third of the gap [on the measure of adult outcomes] between children with median and bottom quartile family income.” Researchers Jens Ludwig of the University of Chicago and Douglas Miller of the University of California, Davis also found a reduction in mortality rates among children aged 5 to 9 as a result of screenings conducted as part of Head Start’s health services.[10]
- Other studies have found that the Pell Grant program reduces the likelihood of students dropping out.[11] A Department of Education study found that college graduates who received Pell Grants earned degrees faster than non-recipients.[12] A separate 2008 study found that low-income students receiving a Pell Grant were 63 percent less likely to drop out than low-income students without Pell Grants.[13]
- In the housing area, research indicates that four housing-related problems — homelessness, frequent moves that result in school changes, overcrowding, and poor housing quality — can impair children’s academic achievement. Children in homeless families are more likely than other low-income children to drop out of school, repeat a grade, or perform poorly on tests.[14] Housing assistance has been shown to reduce these housing-related problems. In a multi-site, rigorous evaluation, low-income families that received Section 8 housing vouchers were 74 percent less likely to become homeless, 48 percent less likely to live in overcrowded housing, and moved fewer times over a five-year period than similar low-income families that did not receive housing assistance.[15]
Recent studies regarding food stamps and Medicaid are of particular note. An important new study makes use of the fact that in the late 1960s and early 1970s, some counties operated the food stamp program while others did not; this enabled the researchers to compare low-income people from different counties. The researchers found that children who had access to food stamps in early childhood and whose mothers had access during pregnancy had improved health outcomes as adults years later, compared to children born at the same time in counties that hadn’t yet implemented the program. In addition to lower rates of “metabolic syndrome” — obesity, high blood pressure, heart disease, and diabetes — adults who had access to food stamps as young children reported better health, and women who had access to food stamps as young children reported improved economic self-sufficiency, as measured by such factors as employment, income, poverty status, and high school graduation.[16]
Another important recent study, conducted by a team of leading researchers including a former member of President George W. Bush’s Council of Economic Advisers, examined the effects of Medicaid. Their study is considered the most important and reliable research on Medicaid’s effects, because the researchers were able to compare adults who were and were not offered Medicaid in Oregon through a random “lottery” system — allowing a type of scientific comparison not usually available to researchers in the health field. The study found that adults with Medicaid coverage were 40 percent less likely than uninsured adults to experience a decline in their health over a six-month period.[17] (Those with Medicaid also were 40 percent less likely to have to borrow money or leave other bills unpaid in order to meet medical expenses, and were more likely to receive physician-recommended preventive care. Women, for example, were 60 percent more likely to have a mammogram.) Other research, published in the New England Journal of Medicine, found that expansions of Medicaid coverage for low-income adults in Arizona, Maine, and New York resulted in a sizeable reduction in mortality.[18] Research has also found that children covered by Medicaid or CHIP are more likely than uninsured children to receive preventive health services like regular check-ups that are important for spotting health problems early.
Emerging Research Offers Clues on Connections Between Poverty and Child Outcomes
and Why increases in Income and Other Assistance Can Have Substantial Positive Impacts
Research conducted by Dr. Jack Shonkoff, Director of Harvard University's Center on the Developing Child, has shown that when children live in highly stressful situations — in dangerous neighborhoods, in families that have difficulty putting food on the table, or with parents who are unable to cope with their daily lives — they experience “toxic stress” that has damaging neurological impacts. His research finds that these neurological changes can negatively affect the way a child’s brain works and impede children’s ability to succeed in school and develop the social and emotional skills they need to function well as adults.
One study documented that a young adult’s working memory (measured at age 17) “deteriorated in direct relation to the number of years the children lived in poverty (from birth through age 13).” The study found “such deterioration occurred only among poverty-stricken children with chronically elevated physiological stress.” The mechanism by which early childhood poverty affects memory appears to be related to the stress that “usually accompanies poverty.”a
Other recent research has found connections between swings in income around the time of a pregnancy and dangerous levels of stress that have effects on both the mother and the infant. Temporary spells of low income during pregnancy appear to come with an increase in the maternal stress hormone cortisol; a high cortisol level during pregnancy was associated with negative child outcomes, specifically, “a year less schooling, a verbal IQ score that is five points lower and a 48 percent increase in the number of chronic [health] conditions” for the exposed children, relative to their own siblings who were born at times when the family had lower stress (and, usually, higher income).b
Programs that help poor families with children afford the basics may help improve longer-term outcomes for children by reducing the added stress that parents or children may experience if they cannot pay their bills or do not know there will be food on the table. While researchers are only starting to explore the relationship between safety net programs and toxic stress and its long-term consequences, the early findings are striking.
As one other example, economist Hilary Hoynes of the University of California, Davis and her colleagues find that “access to food stamps in utero and in early childhood leads to significant reductions in metabolic syndrome conditions (obesity, high blood pressure, heart disease, and diabetes) in adulthood and, for women, increases in economic self-sufficiency (increases in educational attainment, earnings, and income, and decreases in welfare participation).”c Other researchers also found signs of reduced stress (such as less inflammation and lower diastolic blood pressure) among mothers targeted by a 1993 expansion in the Earned Income Tax Credit; this expansion was also followed by a significant improvement in self-reported health status for the affected mothers.d
a Gary Evans, Jeanne Brooks-Gunn and Pam Klevanov , “Stressing Out the Poor: Chronic Physiological Stress and the Income-Achievement Gap,” Pathways, winter 2011, http://www.stanford.edu/group/scspi/_media/pdf/pathways/winter_2011/PathwaysWinter11.pdf
b Anna Aizer, Laura Stroud, Stephen Buka (2012), “Maternal Stress and Child Outcomes: Evidence from Siblings,” National Bureau of Economic Research Working Paper 18422, www.nber.org/papers/w18422.pdf
c Hilary W. Hoynes, Diane Whitmore Schanzenbach, and Douglas Almond (2012), “Long Run Impacts of Childhood Access to the Safety Net,” National Bureau of Economic Research Working Paper 18535, www.nber.org/papers/w18535
d William N. Evans and Craig L. Garthwaite (2010), “Giving Mom a Break: The Impact of Higher EITC Payments on Maternal Health,” National Bureau of Economic Research Working Paper 16296, www.nber.org/papers/w16296
Social Insurance Programs
Finally, a brief word on Social Security and Medicare. The beneficial effects of these programs are well known. And we know some changes will be needed here to restore long-term solvency to these programs and to help attain long-term fiscal sustainability.
In considering such changes, I would urge policymakers to consider the circumstances of Social Security and Medicare beneficiaries with very modest incomes. People sometimes think of affluent seniors playing golf and receiving benefits from these programs, and to be sure, some beneficiaries are affluent and can afford to pay somewhat higher Medicare premiums or receive somewhat less from Social Security. But we should keep in mind that half of all Social Security and Medicare beneficiaries have income (including their spouse’s income) of less than about $25,000 a year.
It’s often also assumed that people who are elderly or disabled face little in the way of out-of-pocket health care costs because they are covered by Medicare (or by Medicare and Medicaid, Medigap, or other supplemental insurance). Yet data from the Kaiser Family Foundation show that while U.S. households who are not receiving Medicare spend an average of 5 percent of their budgets on out-of-pocket health costs, Medicare households spend 15 percent of their budgets. And, near-poor Medicare beneficiaries — those with incomes between 100 percent and 200 percent of the poverty line, or between $11,500 and $23,000 for an elderly or disabled individual — spend an average of 23 percent of their modest incomes on out-of-pocket health costs.
I bring up these figures not to argue for placing Medicare and Social Security off limits or to argue for placing all changes affecting beneficiaries off limits, but to make the point that any changes impacting beneficiaries should be designed carefully to avoid causing hardship and impeding access to needed health care among near-poor as well as poor beneficiaries. (I would note that the Social Security checks which beneficiaries receive equal their Social Security benefits minus their Medicare premiums, which are deducted from the checks; the premiums increase with health care costs, which tend to rise faster than general inflation, and that erodes the purchasing power of Social Security checks over time.)
The nation will not be well served if elderly widows trying to live on $15,000 a year can’t afford to see a doctor because we have set their Medicare deductible too high.
Image
 The Need for Balanced Deficit Reduction
We need to make more progress in getting our fiscal house in order. How we do so will have large consequences for tens of millions of Americans. One way to look at this is to say that changes will be needed on both the spending and revenue sides of the budget. Perhaps a better way to look at this is to say that changes will be needed both in spending in the tax code and in spending on the outlay side of the budget.
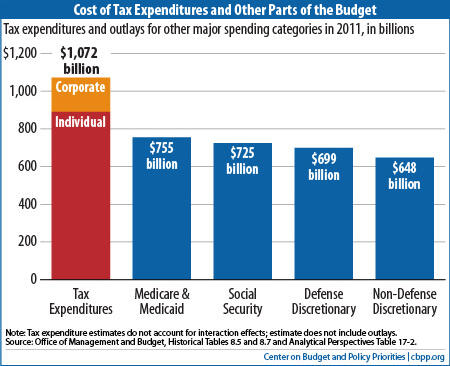
As individuals such as Martin Feldstein, who served as Chairman of President Reagan’s Council of Economic Advisers, and former Federal Reserve chairman Alan Greenspan have pointed out, a great deal of spending occurs through the tax code, in the form of tax expenditures. The Budget Act of 1974 defines tax expenditures as revenue losses attributable to provisions in federal tax law that provide special benefits to particular taxpayers or groups of taxpayers. Deductions, exemptions, exclusions, credits and preferential tax rates on certain forms of income all are tax expenditures.
Martin Feldstein has written that tax expenditures are the single largest source of wasteful and low-priority spending in the budget and should be the first place that policymakers go to restrain spending. Alan Greenspan has referred to tax expenditures as “tax entitlements” and said they should be looked at along with other entitlements.
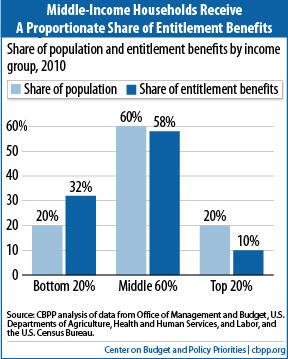
Tax expenditures differ from spending entitlements in terms of the distribution of their benefits. With spending entitlements, the middle class receives roughly a proportionate share: in 2010, the middle 60 percent of the population received 58 percent of the entitlement benefits. The bottom 20 percent received 32 percent of the benefits, while the top 20 percent received 10 percent of the benefits.[19]
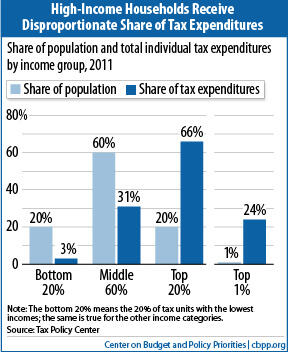
But with the tax entitlements, the situation is different. The Urban Institute-Brookings Institution Tax Policy Center has estimated that for tax year 2011, the top fifth of the population received 66 percent of all individual tax-expenditure benefits — with the top 1 percent of households receiving 24 percent of the benefits. Meanwhile, the middle 60 percent of the population received a little over 31 percent of the benefits, and the bottom 20 percent of the population received 2.8 percent of the benefits.
The two types of subsidies differ in their availability to eligible families. The low- or moderate-income parent may fail to get any subsidy to help with her child care costs, because the spending programs that provide these subsides are not open ended; they can serve only as many people as their capped funding allows, and only about one in six eligible low-income working families with children receives such a subsidy. By contrast, the child care subsidies for higher-income households are guaranteed, because the child care tax subsidy operates as an open-ended entitlement (and there is no limit on how large a family’s income can be to claim this tax credit). All higher-income households that qualify receive the subsidy, even though — unlike many of the working-poor families — they generally would be able to afford child care without the subsidies. It would not be sound policy to make the tax-code subsidies sacrosanct and the program subsidies a target for deficit reduction because one type of subsidy is delivered through a “spending” program and the other is delivered through the tax code.
End Notes
[1] In calculating that another $1.5 trillion in deficit savings would stabilize the debt over the latter years of the decade at 73 percent of GDP, we start with the budget baseline that CBO has just released. We use CBO’s economic assumptions and make certain adjustments to its policy projections, which are identical to the adjustments that organizations such as the Committee for a Responsible Federal Budget also make. We freeze Medicare reimbursement rates for physicians at current levels, rather than assuming they will be slashed deeply. We phase down war funding over the next few years to a lower level, as policymakers are on course to do, rather than assuming that current levels of war costs continue (and rise with inflation) through 2023. We assume disaster funding will revert to the ten-year historical average level, as allowed by the Budget Control Act, rather than grow with inflation from the unusually high levels resulting from Hurricane Sandy. We assume that the scheduled across-the-board spending cuts (known as “sequestration”) do not occur. We also assume that policymakers will continue certain improvements in refundable tax credits that they have just extended for five years. At the same time, we follow the CBO baseline in assuming that policymakers either will not continue a series of tax provisions often referred to as the “tax extenders,” which expire at the end of 2013, or will offset the costs of continuing those “extenders” they do maintain.
[2] Yonatan Ben-Shalom, Robert A. Moffitt, and John Karl Scholz “An Assessment of the Effectiveness of Anti-Poverty Programs in the United States,” NBER Working Paper 17042, May 2011.
[3] Means-tested mandatory health care programs include Medicaid, CHIP, and subsidies for the purchase of health insurance under the Affordable Care Act (along with a few very small programs such as mandatory supplements to a few areas of discretionary health funding).
[4] Stacy Dickert, Scott Houser, and John Karl Scholz, “The Earned Income Tax Credit and Transfer Programs: A Study of Labor Market and Program Participation,” Tax Policy and the Economy, Vol. 9, MIT Press, 1995. V. Joseph Holt, Charles H. Mullin, and John Karl Scholz, “Examining the Effect of the Earned Income Tax Credit on the Labor Market Participation of Families on Welfare,” NBER Working Paper No. 11968, January 2006.
[5] Jeffrey Grogger, “The Effects of Time Limits, the EITC, and Other Policy Changes on Welfare Use, Work, and Income among Female-Head Families,” Review of Economics and Statistics, May 2003. In separate study using different data, Grogger reaches similar conclusions. Jeffrey Grogger, “Welfare Transitions in the 1990s: the Economy, Welfare Policy, and the EITC,” NBER Working Paper No. 9472, January 2003, http://www.nber.org/papers/w9472.pdf
[6] Chetty, Friedman, and Rockoff 2011.
[7] Gordon Dahl and Lance Lochner, “The Impact Of Family Income On Child Achievement: Evidence From The Earned Income Tax Credit,” American Economic Review (2012), 1927-1956, http://www.aeaweb.org/articles.php?doi=10.1257/aer.102.5.1927
Building on Dahl and Lochner’s research methods, economists Alexander M. Gelber of the Wharton School of Business and Matthew C. Weinzierl of the Harvard Business School conclude that the income boost that low-income families with children receive from the EITC helps the tax system raise revenue more effectively. In essence, they conclude, when low-income families with young children receive additional income, their children perform better in school, which increases the opportunities that their children will have to succeed. Alexander M. Gelber and Matthew C. Weinzierl, “Equalizing Outcomes vs. Equalizing Opportunities: Optimal Taxation When Children's Abilities Depend On Parents' Resources,” NBER Working Paper No. 18332, August 2012, http://www.nber.org/papers/w18332
[8] Raj Chetty, John N. Friedman, Nathaniel Hilger, Emmanuel Saez, Diane Whitmore Schanzenbach, and Danny Yagan, “How Does Your Kindergarten Classroom Affect Your Earnings? Evidence from Project Star,” The Quarterly Journal of Economics (2011), http://qje.oxfordjournals.org/content/126/4/1593.abstract
[9] Greg J. Duncan, Kathleen M. Ziol-Guest, and Ariel Kalil, “Early-Childhood Poverty and Adult Attainment, Behavior, and Health,” Child Development (January/February 2010), pp. 306-325.) The $3,000 figure is in 2005 dollars, equivalent to approximately $3,530 in 2012.
[10] Jens Ludwig and Douglas L. Miller. “Does Head Start Improve Children’s Life Chances? Evidence From a Regression Discontinuity Design.” NBER Working Paper No. 11702, October 2005. http://www.nber.org/papers/w11702
[11] Eric Bettinger, “How Financial Aid Affects Persistence,” in Caroline M. Hoxby, editor, College Choices: The Economics of Where to Go, When to Go, and How to Pay For It, University of Chicago Press, 2004.
[12] Christina Chang Wei, Laura Horn, and Thomas Weko, A Profile of Successful Pell Grant Recipients: Time to Bachelor’s Degree and Early Graduate School Enrollment, U.S. Department of Education, National Center for Education Statistics, July 2009. The study controlled for factors such as parental education.
[13] Rong Chen and Stephen L. DesJardins, “Exploring the Effects of Financial Aid on the Gap in Student Dropout Risks by Income Level,” Research in Higher Education, v. 49 pp. 1-18, February 2008.
[14] E.g., Rubin and colleagues also found, after controlling for differences in socioeconomic status, demographic characteristics, and schools, that homeless children scored lower on tests of reading, spelling, and math proficiency. David H. Rubin et al., “Cognitive and Academic Functioning of Homeless Children Compared with Housed Children,” Pediatrics 97:3: 289 – 94, 1996. Similar results have been found in more recent studies.
[15] Michele Wood, Jennifer Turnham, and Gregory Mills. 2008. "Housing Affordability and Family Well-Being: Results from the Housing Voucher Evaluation." Housing Policy Debate, 19:2, pp. 367 – 412. The study did not collect data on school outcomes.
[16] Hilary W. Hoynes, Diane Whitmore Schanzenbach, Douglas Almond, "Long Run Impacts of Childhood Access to the Safety Net," National Bureau of Economic Research Working Paper No. 18535, November 2012. http://www.nber.org/papers/w18535
[17] Amy Finkelstein, Sarah Taubman et al., “The Oregon Health Insurance Experiment: Evidence from the First Year,” National Bureau of Economic Research Working Paper No. 17190, July 2011. http://www.nber.org/papers/w17190
[18] Benjamin Sommers, Katherine Baicker, and Arnold Epstein, “Mortality and Access to Care among Adults after State Medicaid Expansions,” New England Journal of Medicine; 367:1025-1034, September 13, 2012.
[19] Spending entitlement figures include the outlay components of the Earned Income Tax Credit and the Child Tax Credit. See Arloc Sherman, Robert Greenstein, and Kathy Ruffing, “Contrary to ‘Entitlement Society’ Rhetoric, Over Nine-Tenths of Entitlement Benefits Go to Elderly, Disabled, or Working Households,” Center on Budget and Policy Priorities, February 10, 2012, https://www.cbpp.org/cms/?fa=view&id=3677