$1.5 Trillion in Deficit Savings Would Stabilize the Debt Over the Coming Decade
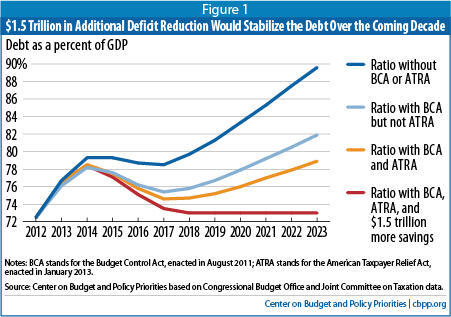
Policymakers could stabilize the public debt over the coming decade with $1.5 trillion in additional deficit savings, according to the Center’s updated calculations, which are based on the new budget projections that the Congressional Budget Office (CBO) released this week. Policymakers could achieve these savings with $1.3 trillion in policy savings (that is, spending cuts and tax increases), which would generate about $200 billion in savings in interest payments. The $1.5 trillion in total savings would stabilize the debt at 73 percent of gross domestic product (GDP) over the latter part of the decade (see Figure 1).[1]
CBO’s newest budget projections reflect its current economic forecast, the effects of the recently enacted “fiscal cliff” budget law (the American Taxpayer Relief Act, or ATRA), and the shift from a ten-year budget period that covers fiscal years 2013-2022 to one covering 2014-2023. In calculating the savings needed to stabilize the debt over the coming decade, the Center used CBO’s new projections and made several adjustments, which most other budget analysts also make, to better reflect the costs that would accrue if policymakers continue current policies.
The fact that $1.5 trillion in deficit savings, rather than a much larger amount, would stabilize the debt over the coming decade[2] is due primarily to two factors. First, the President and Congress have enacted substantial deficit reduction over the two-plus years since the Bowles-Simpson report and Rivlin-Domenici task force outlined deficit-reduction proposals; policymakers have enacted nearly $1.5 trillion in spending cuts for appropriated programs (mainly through the annual caps enacted in the 2011 Budget Control Act) and nearly $600 billion in revenue increases in ATRA. Including the related savings in interest payments, policymakers have achieved about $2.35 trillion in deficit reduction so far. These estimates cover the ten-year budget window of 2013-2022. Over the new budget window of 2014-2023, the same policies will produce estimated savings of $2.75 trillion (see Table 1).
| Table 1 Deficit Reduction to Stabilize the Debt Cumulative totals, 2014-2023, in billions | ||||||
| Policy savings | Interest savings | Total deficit reduction | ||||
| Discretionary savings from cuts in 2011 funding and caps imposed by the BCA | 1,576 | 336 | 1,912 | |||
| Savings from the ATRA | 732 | 117 | 850 | |||
| Further savings to stabilize debt at 73% of GDP | 1,327 | 202 | 1,529 | |||
| TOTAL | 3,636 | 655 | 4,290 | |||
| Notes: BCA stands for the Budget Control Act, August 2011; ATRA stands for the American Taxpayer Relief Act, January 2013; all savings measured relative to current policy (see Appendix I) Source: Center on Budget and Policy Priorities based on Congressional Budget Office and Joint Committee on Taxation data. | ||||||
Second, CBO’s economic and technical projections have improved over the past few years. Not counting the reductions in discretionary funding and the savings from ATRA discussed above, the new projections reduce estimated deficits under current policies by about $750 billion over the coming decade, relative to CBO’s forecast of March 2012. Relative to CBO’s August 2010 forecast, which the Bowles-Simpson and Rivlin-Domenici panels relied upon for their reports, the new economic and technical projections reduce estimated deficits by about $1.3 trillion.
Is Stabilizing the Debt the Right Target?
Stabilizing the debt-to-GDP ratio over the coming decade — so the debt doesn’t grow faster than the economy — is the minimum appropriate budget policy. To stabilize the debt at 73 percent of GDP, as we assume in this analysis, would require shrinking annual deficits to below 3 percent of GDP.
Stabilizing the debt ratio for the decade ahead will still require policymakers to enact additional deficit reduction for the long term. In ensuing decades, the aging of the population and increases in per-capita health care costs (which are likely to rise faster than per-capita GDP) will raise costs for health and retirement programs, returning the budget to an unsustainable path where debt is increasing as a share of the economy.
Some call for greater deficit reduction now in order to achieve a declining debt ratio, citing these long-term trends. They argue that putting the debt ratio on a declining rather than a stable path for the coming decade also offers insurance against the risk that the CBO projections turn out to be too optimistic. This argument merits consideration.
On the one hand, the CBO economic forecast is not inherently “rosy.” History has shown that CBO’s economic assumptions, upon which our projections are based (we do not make economic projections of our own), are as likely to be too pessimistic as too optimistic. CBO’s projections show a slow but relatively steady recovery from the Great Recession, with the economy not fully recovering until 2017, followed by a period of steady, but not robust, growth. The actual pattern of growth that ensues will, of course, show more variability and could be either weaker or stronger on average over the period than CBO is projecting. The point is that CBO tries to make a projection that is not biased in one direction or the other, and historically its projections have not exhibited such a bias.
On the other hand, while CBO’s economic projections are as likely to be too pessimistic as too optimistic, this means there is a significant chance the projections could prove too optimistic. And, it’s not inconceivable that a future Congress and President could stop complying at some point with the BCA’s tight caps on funding for appropriated programs. The notion of seeking somewhat more deficit reduction than appears needed to stabilize the debt under the CBO forecast thus has appeal.
Enacting larger deficit reduction now would require deeper program cuts, larger revenue increases, or both. At issue here is the quality of these policy choices. One concern is that enacting steeper deficit reduction now could lead policymakers to make decisions, particularly in the health care area, where desired solutions currently are elusive and where knowledge about effective ways to slow health care cost growth is likely to be greater in coming years due to changes underway in the health care sector and various research and demonstration projects.
To be sure, policymakers can enact measures now, as part of a balanced deficit-reduction package, that would achieve significant Medicare savings for the decade ahead without jeopardizing the quality of care or access to care. Rushing now to enact cuts substantially deeper than that in federal health spending could result, however, in measures that largely shift costs to states, individuals, and private employers and harm some of the most vulnerable members of society, while failing to address the underlying causes of the unsustainable growth in costs across the health care system. Indeed, analysts have found that some proposals to enact large cuts in Medicare or other health programs would actually increase total U.S. health care costs[3] — hardly a desirable outcome.
Stabilizing the debt for the coming decade would give policymakers time to figure out how to slow the growth of health care costs throughout the U.S. health care system without impairing the quality of care. So, while stabilizing the debt during the decade ahead won’t permanently solve our fiscal problems, it would still represent an important accomplishment.
Weighing these various factors, we conclude that the $1.5 trillion needed to stabilize the debt for the coming decade at 73 percent of GDP, based on the new CBO projections, should be regarded as an appropriate target for the amount of deficit reduction policymakers should achieve over the coming decade, with fiscal policies designed so that most of this deficit reduction occurs in the years after the economy has more fully recovered. We also conclude that a somewhat larger amount of deficit reduction would be desirable, if it can be secured through sound, balanced policies that don’t impede the economic recovery or jeopardize future productivity growth (by providing inadequate resources for areas like education, infrastructure, and basic research), don’t increase poverty and inequality (which are already larger in the United States than in most of the Western world), and don’t sacrifice health care quality or access or raise overall U.S. health care costs. The quantity of deficit reduction over the next ten years is not the only important issue; the quality of the deficit-reduction measures adopted matters as well.
We would underscore that given the continued weakness in the economy — with the unemployment rate still close to 8 percent and CBO projecting that it will take four more years for the economy to recover fully — deficit reduction needs to be designed carefully to avoid making the recovery even slower. Deficit reduction should be phased in over coming years (as we do in the deficit-reduction path used in this analysis). Preferably, policymakers would couple some targeted temporary fiscal measures to accelerate growth and job creation now with permanent deficit-reduction measures, as former OMB and CBO director Peter Orszag, former vice chairman of the Federal Reserve Board Alan Blinder, and others have recommended.
Our Estimates and How They Change Under Different Assumptions
In calculating that another $1.5 trillion in deficit savings will stabilize the debt, we start with the budget baseline that CBO has just released. We use CBO’s economic assumptions and make certain common-sense adjustments to its policy projections.
Specifically, we freeze Medicare reimbursement rates for physicians at current levels, rather than assuming that they will be slashed deeply. We phase down war funding over the next few years to a lower level, as policymakers are on course to do, rather than assuming that current levels of war costs continue (and rise with inflation) through 2023. We assume disaster funding will revert to the ten-year historical average level, as allowed by the Budget Control Act, rather than grow with inflation from the unusually high levels resulting from Hurricane Sandy. We assume that the scheduled across-the-board spending cuts (known as “sequestration”) do not occur. We also assume that policymakers will continue certain improvements in refundable tax credits that they have just extended for five years. At the same time, we follow the CBO baseline in assuming that policymakers either won’t continue a series of tax provisions often referred to as the “tax extenders,” which expire at the end of 2013, or will offset the costs of continuing those “extenders” they do maintain. (See Appendix I for more details on these baseline issues.)
The resulting baseline, with these assumptions, is consistent with the baselines that other budget analysts have used. Like us, the Bowles-Simpson commission, the Rivlin-Domenici task force, the Obama Administration, the Bipartisan Policy Center (BPC), and the Committee for a Responsible Federal Budget (CRFB) all have used baselines that assume policymakers will offset the costs of continuing the tax extenders and won’t offset the cost of blocking the Medicare physician cuts. Also like us, the BPC and CRFB have each assumed that policymakers will cancel sequestration without offsetting the cost. (Bowles-Simpson and the Rivlin-Domenici task force issued their reports before policymakers enacted sequestration.)
Box 1: Why Our Earlier $1.4 Trillion Estimate Has Changed
On January 9, we issued an estimate that $1.4 trillion in deficit reduction would stabilize the debt for the coming decade. We have replaced that estimate with the $1.5 trillion estimate described in this analysis for two reasons: 1) CBO has revised its economic and technical projections for the coming decade; and 2) CBO is now using the ten-year period that covers fiscal years 2014-2023, rather than the 2013-2022 period reflected in its earlier projections (and in our earlier analysis). CBO’s new economic and technical changes improve the outlook over the decade somewhat, slightly lowering the cost of stabilizing the debt, while moving to the new ten-year window that drops the year 2013 and replaces it with 2023 raises the ten-year cost. The net effect of these two changes is to increase the amount of deficit reduction needed to stabilize the debt at 73 percent of GDP from $1.4 trillion through 2022 to $1.5 trillion through 2023. (See Appendix II.)
Needless to say, the amount of deficit reduction needed to stabilize the debt rises or falls if these assumptions change (see Appendix III). For example:
- If one instead assumes that policymakers either let sequestration take effect or offset the $1.2 trillion cost over ten years of cancelling it (including interest costs), then they would have to find only an additional $300 billion in deficit savings to stabilize the debt.
- If policymakers let sequestration take effect and offset the cost of continuing the freeze in Medicare reimbursement rates (which amounts to roughly $170 billion over the next decade, including interest), they would find themselves less than $150 billion from the goal of stabilizing the debt over the decade.
- On the other hand, if one assumes that policymakers will not offset the costs of continuing the tax extenders — a total cost of $542 billion, including interest, if the extenders are continued throughout the decade[4] — they would have to find $2.1 trillion in deficit reduction to stabilize the debt rather than the $1.5 trillion we feature in this analysis. In some respects, this $2.1 trillion estimate reflects a worst-case scenario: it assumes not only that policymakers will continue the tax extenders without paying for them, but that (consistent with our underlying baseline assumptions) they cancel sequestration without putting anything in its place and cancel the scheduled cuts in Medicare reimbursements for doctors without paying for them either.
The $1.5 trillion minimum in additional deficit reduction called for here would, when combined with the appropriations cuts enacted in 2011 and the revenue savings from ATRA, produce a total of $4.3 trillion in deficit reduction over ten years (see Table 1). The resulting three-part package would (based on savings in the fifth year as a percentage of GDP) be almost as large as the 1990 deficit-reduction agreement and larger than the 1993 agreement — the two big budget deals that played an important role in converting the large deficits of the early 1990s to four years of budget surpluses that began in 1998.
Health Care Costs and an Aging Population Pose Significant Longer-Term Challenge
Though it should stabilize the debt over the coming decade, an additional $1.5 trillion in deficit reduction would not be enough to address the longer-term budget problem. In ensuing decades, the aging of America’s population and projected increases in per-capita health care costs — which are likely to rise faster than per-capita GDP — will put considerable pressure on federal health and retirement programs, returning the budget to an unsustainable path of rising debt as a share of the economy. Stabilizing the debt for the next decade, however, would give experts and policymakers time to gain knowledge and experience in how to slow the growth of costs throughout the U.S. health care system without impairing the quality of care.
There are several major unknowns in the health arena. The growth of both public and private health costs has slowed appreciably in the past few years; spending for Medicare — the largest federal health program — grew by only 3.2 percent in fiscal year 2012, CBO has reported,[5] compared to an average of 6.7 percent a year from 2007 through 2011. Moreover, Medicare spending per beneficiary rose only 0.4 percent in 2012. CBO’s latest projections of Medicare spending over the 2011-2020 period under current policy are more than $500 billion below the projections CBO made just two years ago, a significant improvement.
Experts do not yet know whether this slowdown is at least partly permanent — and will generate more savings than CBO has projected for future years and decades, as a growing number of experts now believe likely — or is temporary. The answer will affect the magnitude of the long-term fiscal problem and the extent to which further slowing of health care cost growth is required.
More fundamentally, we currently lack needed information on how to slow health cost growth without reducing health care quality or impeding access to necessary care. Demonstration projects and other experiments to find ways to do so are now starting, some of them government-funded and others entirely private-sector efforts. By later in the decade, we should have substantially more knowledge of what works and what doesn’t (and whether substantial changes are already occurring in health care delivery that are slowing cost growth and can be built upon or spread). Taking major policy action in this area before we have the necessary knowledge and experience could fail to restrain health care cost growth, compromise health care quality, or harm substantial numbers of sick or otherwise vulnerable individuals. Stabilizing the debt for the coming decade would buy us time to find answers to these very important questions.
Box 2: Why the Debt Ratio Matters
The debt ratio — the debt held by the public as a share of GDP — should rise only during hard times or major emergencies and should decline during good times. That enables the government to combat recessions through tax cuts and spending increases (and to address human misery during bad times), while creating a presumption against policies that significantly increase the deficit during good times.
The debt ratio cannot rise forever. If it did, that would shrink the amount of national saving available for private investment, ultimately impairing productivity growth and, in turn, living standards. Alternatively, if inflows of foreign capital offset the shortfall in domestic capital, the profits from that investment will go abroad; either way, U.S. living standards would ultimately suffer. In a crisis, international credit markets might refuse to lend to the U.S. public or private sectors at a reasonable price. These problems would occur if the debt ratio became too high. While no one knows precisely what “too high” means for the United States, a debt ratio that rises in both good times and bad will become increasingly problematic.
That’s why the minimum appropriate budget policy is to ensure that the debt ratio does not rise during normal economic times. In the illustrative debt path that includes the additional $1.5 trillion of deficit reduction shown in Figure 1, deficits average 2.7 percent of GDP from 2018 through 2023.
Achieving $1.5 trillion in additional deficit savings would stabilize the debt at 73 percent of GDP by the latter part of the decade. Some analysts prefer a lower debt ratio, such as 60 percent of GDP, a goal that the European Union and the International Monetary Fund adopted some years ago. No economic evidence, however, supports this or any other specific target, and IMF staff have made clear that the 60 percent criterion is an arbitrary one. In addition, even if such a target were the best one before the recent severe economic downturn pushed up debt substantially in most advanced countries, it would not necessarily be an appropriate target for debt over the next ten years, given the severity of the downturn and continued economic weakness. The critical goal now is to stabilize the debt in the coming decade without hindering economic recovery from the worst recession since the Great Depression.
All else being equal, a lower debt-to-GDP ratio is preferred. It affords policymakers additional flexibility when facing economic and financial crises. But all else is never equal. Achieving this additional deficit reduction comes at a cost, requiring deeper spending cuts, higher revenues, or both. Advocates for greater deficit reduction tout the benefits of lower debt but generally don’t focus on the costs of achieving that goal in terms of lower spending in areas such as education, infrastructure, and research (which can boost future productivity) and the possible harm to vulnerable members of society if cuts are not made judiciously.
Further, enacting a set of policies today that would stabilize the debt during this decade does not mean that policymakers will have finished the job; they will need to enact additional deficit reduction for the long term. There is every expectation that policymakers will be grappling with this problem for many years. But as a first step, enacting a deficit-reduction package that stabilizes the debt over the coming decade would represent an important accomplishment.
It also should be noted that there can be risks in policymakers setting their sights too high. If the political obstacles facing a much larger deficit-reduction package are too great, then insistence on a package that goes well beyond stabilizing the debt could lead to failure — that is, to enactment of no deficit-reduction package or to a package that provides false security because it is dominated by budget gimmicks that don’t actually reduce our long-term deficits but merely appear to do so. ATRA already contains one such gimmick, although it is modest in size.*
* The $12 billion in revenue “increases” included in ATRA to offset part of the lost savings from reducing the 2013 sequestration results from a timing shift — a new tax giveaway, primarily benefiting affluent households, that will raise some revenue in the first decade but lose a larger amount of revenue and widen deficits in subsequent decades. See Robert Greenstein, “Budget Deal Gives New Tax Cut to the Wealthy ? and Pretends It’s a Tax Increase,” Off the Charts blog, January 2, 2013, http://www.offthechartsblog.org/budget-deal-gives-new-tax-cut-to-wealthy-and-pretends-its-a-tax-increase.
Appendix I:
Current Policy vs. Current Law
CBO’s current-law baseline includes some features that make it less useful than alternative versions of that baseline as a starting place for analyzing budget proposals.[6] To cite just one example, it assumes that war costs will continue in all future years at their current level, increased to cover inflation. For this and other reasons, in past years we and other groups such as the Bowles-Simpson fiscal commission, the Bipartisan Policy Center, the Committee for a Responsible Federal Budget, the Concord Coalition, and the Committee for Economic Development have designed alternatives to CBO’s current-law baseline, variously called “current policy,” “plausible,” or “realistic” baselines. Likewise, CBO itself has issued an “alternative fiscal scenario” and the Administration has issued an “adjusted baseline.”
This appendix explains the adjustments we have made to the CBO current-law baseline issued February 5, 2013, to produce one that we and other analysts consider more useful for analysis. The steps are outlined in Table 2, below; each step uses CBO or JCT estimates of the costs or savings it entails. The current-policy baseline we derive is virtually identical in concept to the one we used last year to analyze budget plans, including our January analysis that $1.4 trillion in deficit reduction over 2013-2022 would lead to a stable debt ratio.
Because all figures, including the starting baseline, are taken from CBO’s February report or Joint Committee on Taxation estimates, our current-policy baseline uses CBO’s economic and technical budget assumptions.
| Table 2 Bridge from CBO’s Current-Law Baseline to Our Current-Policy Baseline Dollars in billions | ||||||
| 10-year total, 2014-2023 | ||||||
| Deficits, CBO’s current-law baseline (Feb. 5, 2013) | 6,958 | |||||
| Phase down war costs to about one-third of current level | -582 | |||||
| Do not assume the “supercommittee sequestration” occurs | +995 | |||||
| Do not continue “Sandy emergency” funding enacted in HR 1 | -302 | |||||
| Continue relief from the Medicare SGR at a freeze level | +138 | |||||
| Continue costs of ARRA refundable tax credits after 2017 | +142 | |||||
| Subtotal, policy adjustments | +392 | |||||
| Debt service on the policy adjustments | +113 | |||||
| Remove timing shifts built into mandatory outlays | -47 | |||||
| Resulting deficits, current policy baseline | 7,416 | |||||
| Source: Center on Budget and Policy Priorities based on Congressional Budget Office and Joint Committee on Taxation data. | ||||||
War costs. CBO’s current-law baseline includes $100 billion in funding for war costs for 2013, most of which is in the national defense budget function. It continues that funding, growing with inflation, in all subsequent years. Our current-policy baseline follows an alternative path that CBO also has outlined. In this alternative, war funding phases down to about two-fifths as much by 2016, growing with inflation thereafter. In effect, our alternative assumes that from 2016 on, war costs will average about two-fifths as much as under the current-law baseline.[7]
Sequestration. We do not assume continuation of the “supercommittee sequestration” on the grounds that policymakers did not intend it actually to occur and it wasn’t designed to represent congressional policy. Rather, it was intended to induce the supercommittee — established by the BCA and charged with achieving a bipartisan package of deficit reduction — to compromise. Because of the failure of the supercommittee, this sequestration is now scheduled to go into effect. Since we do not assume this sequestration in our current-policy baseline, if it is allowed to go into effect and remain in effect through 2021 — or if Congress and the President cancel it but enact alternative budget savings of equal magnitude — that would reduce our current-policy deficits by $1.2 trillion, including interest savings. (See Appendix III.)
Sandy emergency funding. HR 1, the supplemental appropriations bill that provided relief and reconstruction funding after Hurricane Sandy, included:
- $3.5 billion in 2013 regular funding, now part of CBO’s baseline;
- $3.4 billion in 2013 “disaster” funding, which is allowed under the BCA caps (both CBO’s current-law baseline and our baseline assume compliance with the caps, including the limited amount of disaster funding they allow); and
- $41.6 billion in “emergency” funding, which is outside the caps and not subject to the BCA limit on “disaster” funding.
CBO’s current-law baseline projects the $41.6 billion in emergency funding to continue each year, growing with inflation. Our current-policy baseline discontinues this $41.6 billion in funding after 2013 because disasters as costly as Hurricane Sandy are relatively rare and the disaster allowance built into the BCA caps — which is based on a rolling historical ten-year average of such funding — builds in an average allowance for future disaster funding.
The Medicare “sustainable growth rate” (SGR). Under current law and therefore in CBO’s current-law baseline, the rates at which Medicare pays physicians for the health services they provide will be cut by about 25 percent on January 1, 2014. The SGR, enacted in 1997, initially provided an achievable level of Medicare savings, but the formula in the law eventually led to extremely unrealistic results, and Congress has addressed this matter — generally one year at a time and generally by freezing physician reimbursement rates rather than allowing them to fall precipitously. Our current-policy baseline assumes that reimbursement rates will be frozen in subsequent years.
ARRA refundable credits. The American Recovery and Reinvestment Act of 2009 (ARRA) created the American Opportunity Tax Credit, which helps cover college costs, and expanded certain elements of the Earned Income Tax Credit and the Child Tax Credit. ATRA, enacted at the start of 2013, extended most elements of the 2001 and 2003 Bush-era tax cuts permanently while extending these 2009 ARRA provisions through December 31, 2017. Our current-policy baseline assumes these provisions will be continued in subsequent years, much as our previous current-policy baselines assumed that the 2001/2003/2009 tax cuts would be continued.
Debt service. Our adjustments to CBO’s current-law baseline increase projected deficits. That increase causes projected debt to be higher than under CBO’s current-law baseline, and a higher debt necessarily means greater interest payments (debt service). We use CBO’s interest rates to calculate the higher interest payments that would occur.
Timing shifts. Under existing law, if the date for required monthly payments of SSI benefits, veterans’ benefits, military retirement, and Medicare Advantage and Rx drug benefits would occur on a weekend, the payment is made the prior Friday. If that happens in a year in which October 1 (the first day of the fiscal year) falls on a weekend, the payment normally made on that date instead occurs on September 29 or 30, which is in the prior fiscal year. As a result, while most fiscal years include 12 such monthly payments, a few include 11 or 13. Our current-policy baseline assumes 12 monthly payments in all years. This smooths the path of current-policy deficits and debt and removes some meaningless bumpiness from the resulting levels of deficits and debt under alternative budget plans.[8]
| Table 3 Resulting Current-Policy Baseline Dollars in billions | |||||||||||||
| 2013 | 2014 | 2015 | 2016 | 2017 | 2018 | 2019 | 2020 | 2021 | 2022 | 2023 | 10-yr total | ||
| Revenues | 2,708 | 3,003 | 3,373 | 3,591 | 3,765 | 3,934 | 4,088 | 4,266 | 4,482 | 4,720 | 4,946 | 40,169 | |
| Outlays | Discretionary | 1,247 | 1,227 | 1,229 | 1,228 | 1,238 | 1,250 | 1,277 | 1,302 | 1,329 | 1,365 | 1,392 | 12,837 |
| Mandatory | 2,123 | 2,233 | 2,371 | 2,531 | 2,680 | 2,828 | 2,967 | 3,131 | 3,308 | 3,491 | 3,685 | 29,225 | |
| Interest | 224 | 244 | 273 | 327 | 419 | 527 | 606 | 682 | 749 | 815 | 880 | 5,522 | |
| Total outlays | 3,595 | 3,703 | 3,873 | 4,086 | 4,337 | 4,606 | 4,851 | 5,115 | 5,386 | 5,671 | 5,957 | 47,585 | |
| Deficit | 887 | 701 | 500 | 495 | 572 | 671 | 762 | 849 | 904 | 951 | 1,011 | 7,416 | |
| Debt held by public | 12,271 | 13,064 | 13,660 | 14,241 | 14,895 | 15,635 | 16,464 | 17,379 | 18,348 | 19,369 | 20,443 | ||
| Debt net of financial assets | 11,285 | 11,960 | 12,438 | 12,911 | 13,463 | 14,114 | 14,854 | 15,681 | 16,563 | 17,940 | 18,476 | ||
| Source: Center on Budget and Policy Priorities based on Congressional Budget Office and Joint Committee on Taxation data. | |||||||||||||
| Table 4 Resulting Current-Policy Baseline as a Percent of the Economy Percent of GDP | |||||||||||||
| 2013 | 2014 | 2015 | 2016 | 2017 | 2018 | 2019 | 2020 | 2021 | 2022 | 2023 | |||
| Revenues | 16.9 | 18.0 | 19.1 | 19.1 | 18.9 | 18.8 | 18.7 | 18.7 | 18.8 | 19.0 | 19.1 | ||
| Outlays | Discretionary | 7.8 | 7.4 | 7.0 | 6.5 | 6.2 | 6.0 | 5.8 | 5.7 | 5.6 | 5.5 | 5.4 | |
| Mandatory | 13.2 | 13.4 | 13.4 | 13.5 | 13.4 | 13.5 | 13.6 | 13.7 | 13.9 | 14.0 | 14.2 | ||
| Interest | 1.4 | 1.5 | 1.5 | 1.7 | 2.1 | 2.5 | 2.8 | 3.0 | 3.1 | 3.3 | 3.4 | ||
| Total outlays | 22.4 | 22.2 | 22.0 | 21.7 | 21.7 | 22.0 | 22.2 | 22.4 | 22.6 | 22.8 | 23.0 | ||
| Deficit | 5.5 | 4.2 | 2.8 | 2.6 | 2.9 | 3.2 | 3.5 | 3.7 | 3.8 | 3.8 | 3.9 | ||
| Debt held by public | 76.5 | 78.5 | 77.5 | 75.8 | 74.6 | 74.7 | 75.2 | 76.0 | 77.0 | 77.9 | 78.9 | ||
| Debt net of financial assets | 70.4 | 71.8 | 70.5 | 68.7 | 67.5 | 67.4 | 67.9 | 68.6 | 69.5 | 70.4 | 71.3 | ||
| Source: Center on Budget and Policy Priorities based on Congressional Budget Office and Joint Committee on Taxation data. | |||||||||||||
Appendix III discusses alternative approaches to defining a current-policy baseline and their budgetary implications.
Appendix II:
Deficit-Reduction Methodology
Starting from the current-policy baseline described in Appendix I, we build a hypothetical deficit-reduction path. We assume that deficit reduction will phase in starting in fiscal year 2014. We select a dollar amount of policy savings for 2014 and assume it will double in 2015, triple in 2016, and so on until 2019, when the debt ratio stands at 73 percent of GDP. After 2019, the deficit reduction reflects the amounts needed to stabilize the debt at 73 percent of GDP. Finally, we use CBO’s February 2013 interest rate assumptions to calculate the interest savings that will occur as a result of the policy savings we assume.
| Table 5 Policy Savings and Interest Savings in the Hypothetical $1.5 Trillion Path In billions of dollars | |||
| Fiscal year | Policy savings | Interest savings | Total savings |
| 2013 | 0 | 0 | 0 |
| 2014 | 21 | 0 | 22 |
| 2015 | 43 | 0 | 43 |
| 2016 | 64 | 2 | 66 |
| 2017 | 85 | 5 | 91 |
| 2018 | 107 | 11 | 118 |
| 2019 | 128 | 17 | 145 |
| 2020 | 187 | 24 | 211 |
| 2021 | 213 | 35 | 248 |
| 2022 | 231 | 47 | 278 |
| 2023 | 247 | 60 | 307 |
| Total | 1,327 | 202 | 1,529 |
| Note: May not add due to rounding | |||
This methodology is intended to approximate the debt ratio path in our previous analysis released on January 9. It requires $1.3 trillion of policy savings over the ten-year period 2014-2023. The associated interest savings are $0.2 trillion, for total deficit reduction of $1.5 trillion (see Table 5 for the year-by-year path). This differs modestly from our previous deficit-reduction estimate of $1.4 trillion.
The difference between the two estimates largely reflects two factors. First, compared with CBO’s August 2012 projections, which were the basis of our previous estimate, CBO’s February 2013 projections are somewhat improved in total over 2013-2022, the years the two projections have in common. Using the new CBO assumptions, the deficits and debt under our current-policy baseline are slightly lower over those years than they were under the August 2012 assumptions. As a result, the policy and interest savings required to stabilize the debt at 73 percent of GDP through 2022 are about $150 billion less under our new estimates than under our previous estimates over this period. Further, in our new estimates, the deficit reduction stabilizes the debt at 73.0 percent of GDP, rather than at 73.4 percent, the level in our previous analysis. But a second factor adds to the ten-year cost of our estimate. The new ten-year window extends through 2023. That year requires about $300 billion of deficit reduction in order to keep the debt stable at 73 percent of GDP. As a result, the net effect is that the ten-year cost of stabilizing the debt is modestly higher under our new estimates, which cover the ten years through 2023, than under our previous estimates, which went through 2022.
Appendix III:
Alternative Approaches to Current Policy
As discussed in Appendix I, the current-policy baseline used in this analysis makes a number of important assumptions. This appendix examines in more detail the effect of employing different assumptions with regard to the tax extenders and sequestration.
Tax extenders. Congress usually extends a large series of special tax provisions, generally relating to the treatment of business income, for a year or two at a time. The Research and Experimentation tax credit is the most prominent. ATRA extended many of these special provisions until December 31, 2013.
We do not assume their continuation in this current-policy baseline beyond what was provided in ATRA largely because the Bowles-Simpson commission and the Obama Administration, in its 2013 budget, did not continue them in their current-policy baselines. The Bipartisan Policy Center and the Committee for a Responsible Federal Budget have adopted the same approach in their current-policy baselines. We think it will be less confusing if we maintain broad comparability with their baselines.
There is a reasonable case, however, for assuming continuation of the normal tax extenders (NTEs) without offsetting the cost. What if we had used a current-policy baseline that assumed the NTEs were continued?
Under such a baseline, the starting level of post-ATRA tax expenditures would be $462 billion higher (and thus revenues would be $462 billion lower) over the period 2014-2023, reflecting the continuation of the NTEs. (This estimate does not assume continuation of the 50 percent deduction for the cost of certain new capital investments, known as “bonus depreciation,” which is not a normal “extender”; it was enacted to address the slowdown in the economy, and we expect that it will not be extended once the economy is on more solid ground. During the recession in the early 2000s, a similar depreciation provision was allowed to expire when the economy had recovered.)
When the associated interest costs of $81 billion are included, the current-policy baseline deficit would be $542 billion higher over ten years if the continuation of the NTEs were assumed. Consequently, stabilizing the debt would require $2.1 trillion, not $1.5 trillion, in deficit reduction, including interest savings. By the same token, however, one could achieve the “extra” needed deficit reduction by allowing the NTEs to expire or paying for those NTEs that policymakers choose to extend.
In short, the bottom line is the same whether one starts with a baseline in which the NTEs have expired and then finds $1.5 trillion in deficit reduction or starts with a baseline in which the NTEs are continued and then finds $2.1 trillion in deficit reduction, of which up to $542 billion could come from letting the NTEs expire or paying for those NTEs that do continue.[9] The resulting levels of revenues and debt are the same either way.
Sequestration. The current-policy baseline used in this analysis does not reflect the implementation of sequestration, or automatic across-the-board spending cuts, required under the BCA. The BCA established a congressional Joint Select Committee on Deficit Reduction (the “supercommittee”) to develop legislation to reduce deficits by $1.2 trillion over ten years; it created sequestration as a backup mechanism to achieve this deficit reduction in the event the supercommittee failed.
If the current-policy baseline assumed instead that sequestration went into effect, CBO estimates it would produce $995 billion of savings through budget cuts over the ten years 2014-2023, plus $228 billion of associated interest savings. This yields total deficit reduction of $1.2 trillion over the decade. Consequently, stabilizing the debt would require only $305 billion, not $1.5 trillion, in additional deficit reduction, including interest savings.
The key point of both of these examples is that everyone — policymakers, the media, the public, and the business community — must be aware of what is in the baseline. If the baseline assumes the expiration of the NTEs (as ours does), then policymakers cannot count the expiration of any NTEs as deficit reduction, and they must count as a cost the extension of any NTEs that aren’t paid for. Similarly, if the baseline assumes that sequestration is not implemented (as ours does), then policymakers can count the replacement of sequestration with other savings as deficit reduction and wouldn’t count cancelling sequestration (without offsets) as a cost.
End Notes
[1] This analysis updates our earlier reports on the subject. See Richard Kogan, $2 Trillion in Deficit Savings Would Achieve Key Goal: Stabilizing the Debt over the Next Decade, Center on Budget and Policy Priorities, November 1, 2012, https://www.cbpp.org/cms/index.cfm?fa=view&id=3856, and To Stabilize the Debt, Policymakers Should Seek Another $1.4 Trillion in Deficit Savings, Center on Budget and Policy Priorities, January 9, 2013, https://www.cbpp.org/cms/index.cfm?fa=view&id=3885.
[2] The debt could also be stabilized with less than $1.5 trillion in savings; that would entail stabilizing the debt at a level higher than 73 percent of GDP. See Ethan Pollack, “Debt Stabilization Does Not Require $1.4 trillion, $1.5 trillion, or Any Other Single Number,” Economic Policy Institute blog, February 1, 2013, http://www.epi.org/blog/debt-stabilization-does-not-require-single-number/.
[3] Paul N. Van de Water, Raising Medicare’s Eligibility Age Would Increase Overall Health Spending and Shift Costs to Seniors, States, and Employers, Center on Budget and Policy Priorities, August 23, 2011, https://www.cbpp.org/cms/?fa=view&id=3564.
[4] This $542 billion figure reflects the cost of continuing all of the normal tax extenders except for the “bonus depreciation” provision in ATRA that allows companies to write off 50 percent of the cost of new equipment. We assume that this provision, enacted originally in 2008 in response to the recession, will be allowed to expire once the economy is stronger, as a similar provision enacted during the recession of the early 2000s did. See Appendix III.
[5] This figure subtracts premiums paid by beneficiaries and corrects for shifts in the timing of payments. Congressional Budget Office, Monthly Budget Review, Fiscal Year 2012, October 5, 2012, http://www.cbo.gov/sites/default/files/cbofiles/attachments/2012_09_MBR.pdf.
[6] CBO’s current-law baseline follows the baseline rules prescribed in §257 of the Balanced Budget and Emergency Deficit Control Act of 1985 as amended, which is the only statutory definition of a baseline.
[7] Although our current-policy baseline builds in some war costs in every year, this baseline is not a prediction that the United States will be constantly engaged in combat through the period. Rather, it is a recognition that at some point over the decade there may be war costs, that it is prudent to budget on that basis, and that it makes no sense to try to predict the specific years in which those costs will occur.
[8] There is no need to calculate the result of such an assumption on interest payments because shifting the date of benefit payments a day or two does not alter Treasury borrowing patterns or totals.
[9] On August 1, 2012, CRFB issued a statement strongly urging Congress to offset the cost of any of the NTEs it does continue. See http://crfb.org/sites/default/files/Dont_Put_the_Extenders_on_the_Nations_Credit_Card.pdf.
More from the Authors

Areas of Expertise