Out of Balance
Cuts in Services Have Been States’ Primary Response to Budget Gaps, Harming the Nation’s Economy
The state budget gaps of the last five years led to $290 billion in cuts to public services and $100 billion in tax and fee increases. Those actions lengthened the recession and delayed the recovery. Because spending reductions were dominant, hundreds of thousands of jobs were lost; undermining education, health care and other state priorities, which likely will cause future economic harm to states. Federal aid mitigated the harmful effects of the spending cuts in the early years of the budget crunch, but its expiration last year had a catastrophic effect, making 2012 the worst year since the downturn began for cuts in funding for services. More federal aid and a more balanced response, with an equal reliance on revenues and on service cuts, could have mitigated these effects.
These are the findings of a new analysis of state budget data and trends over the last five years. While the broad outlines of this story have been well-known, this is the first attempt to quantify how states collectively balanced their budgets in the face of the worst fiscal problems in at least 70 years. Since 2008, states have enacted almost $3 in spending cuts for every $1 in new revenues. These painful measures, combined with about $160 billion in emergency federal aid, use of $60 billion in reserves that states accumulated before the recession began, and another $50 billion in other measures such as asset sales and payment date shifts, allowed states to balance their budgets in the face of a cumulative $600 billion in budget gaps over a five-year period.[1]
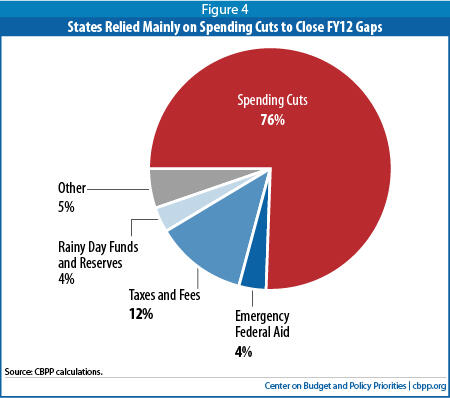
The lack of balance between revenues and spending was most pronounced in fiscal year 2012, as reserves dwindled, federal aid largely expired and states enacted even fewer tax and fee increases. In 2012, spending cuts totaled nearly $140 billion, almost as much as the combined total for the previous four years. Tax and fee increases were just $20 billion, and federal aid and the use of reserves accounted for close to $15 billion.[2]
Continued heavy reliance on spending cuts to close budget gaps will slow the recovery and weaken the nation’s economy over the long term. State and local governments already have shed 641,000 jobs since August 2008; additional rounds of cuts will lead to further job losses in the months ahead. The cuts have also led states to cancel contracts with vendors, reduce payments to businesses and nonprofits that provide services, and cut benefit payments to individuals — all steps that remove demand from the economy. There are long-term effects as well: By diminishing the quality of elementary and high schools, making college less affordable, and reducing residents’ access to health care, the cuts threaten to make the U.S. economy less competitive in coming decades.
Looking forward, revenues are improving from their severely depressed level of 2010, when they were more than 10 percent below pre-recession levels after adjusting for inflation. The 12-month period ending in June 2011 saw an encouraging 8.3 percent growth in state revenues. But even at that rate, it would take seven years to get them back on a normal track.
How Did States Close Their Budget Gaps?
In the wake of the deepest economic downturn since the Great Depression, which drove down tax revenues at unprecedented rates to levels from which they have not yet recovered, states have faced tremendous gaps between available revenues and the amount of funds needed to maintain education, health care, public safety, transportation and other services for state residents. This report, for the first time, provides a picture of how states collectively have closed those gaps. Over the five years starting in 2008, states used all the tools at their disposal, including assistance from the federal government. The choices that state and federal officials made in the wake of this unprecedented recession are already affecting the country’s economic fortunes. When the next downturn hits, state and federal policymakers will be able to shape future decisions based on the experiences detailed in this report.
Methodology
Shortfalls: The aggregate shortfall figures used in this paper are based on the revenues collected by states and projected current services spending -- that is, the amount of funding that would be required to maintain programs at pre-recession (fiscal year 2008) levels. The total differs from those in our periodic budget shortfall papers, which are based on state reports of projected shortfalls, mainly because of the spending baseline used. Annual projected current service shortfalls prepared by states are often based on what it would cost to maintain programs at the prior year’s level rather than pre-recession levels. Total gap-closing measures add up to more than $600 billion because states also took some actions that widened recession-induced budget gaps, such as cutting taxes, increasing spending, and replenishing reserve accounts. These actions totaled $54 billion.
Gap-Closing Measures: While there are a number of sources of information on state budget and tax actions over the last three years, no summary exists of the combination of measures states used to close their budget gaps. The tables and charts in this report use amounts based on information from surveys of state budget officials to give such a picture. The amounts are estimated in some cases but the results in general agree with the observations of policy analysts and public officials who follow state budget and tax trends.
Rainy Day Funds and Reserves Provided an Initial Cushion
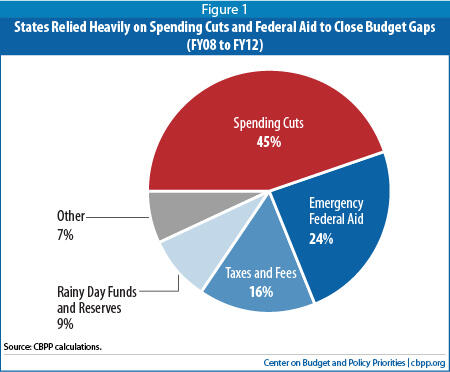
States initially turned to their rainy day funds and other general fund balances to close budget gaps. Together, use of these reserve funds accounted for $57 billion (9 percent) of the measures taken to close the cumulative budget gaps that states faced in fiscal years 2008 through 2012.
| Table 1: States Used Several Measures to Close Budget Gaps | ||
| Cumulative Totals FY08 through FY12 | ||
| Amount in Billions | Percent | |
| Tax and Fee Increases | $100.8 | 15.5% |
| Use of Rainy Day Funds and GF Balances | $56.5 | 8.7% |
| Spending Cuts | $291.1 | 44.8% |
| Federal Fiscal Relief | $155.6 | 24.0% |
| Other (includes use of one-time measures such as borrowing, federal fiscal relief, payment date shifts, etc.) | $45.3 | 7.0% |
| Total Gap Closing Measures | $649.3 | 100.0% |
| Offsets (RDF deposits, tax cuts, spending increases) | -$54.0 | -8.3% |
| Total Shortfalls | $595.3 | |
| Note: The percentages in this table refer to the share that each type of gap-closing measure was relative to the total measures taken to close budget shortfalls. The sum of the measures taken to close shortfalls is greater than the total current service shortfalls. This occurs because in addition to the measures taken to address shortfalls in any given year, some states took actions that required additional funds to balance their budgets. Some states deposited funds in their rainy day funds, some cut taxes, and in a few cases states increased spending relative to pre-recession levels. These actions served to offset the gap-closing measures taken. For more detail see the Appendix. | ||
During and immediately following the recession that began in late 2007, 39 states reported using their rainy day funds to address budget shortfalls.[3] States had acted quickly after the 2001 recession to rebuild reserves. By the end of fiscal year 2006, total ending balances, which include both general fund balances and rainy day fund balances, had reached $69.0 billion (11.5 percent of budgets) — higher than the level of reserves prior to the 2001 recession.
These reserves played an important role in allowing states to maintain programs without large spending cuts and revenue increases, especially at the start of the fiscal crisis. Reserve balances declined from 11.5 percent to a projected 6.2 percent at the end of fiscal year 2012 according to the National Association of State Budget Officers. The amount expected to remain in reserves by the end of 2012 is even smaller for most of the states (only 3.7 percent of budgets on average) if you factor out Alaska and Texas – two states that by themselves account for almost half of the funds in reserves.[4]
But even reserves of this size proved much too small to address a downturn as deep as the 2007-09 recession. One lesson of this downturn is that states would be well-served to increase the size of reserves once the economy recovers sufficiently to allow restocking.
Federal Recovery Act Funds Played an Important Role
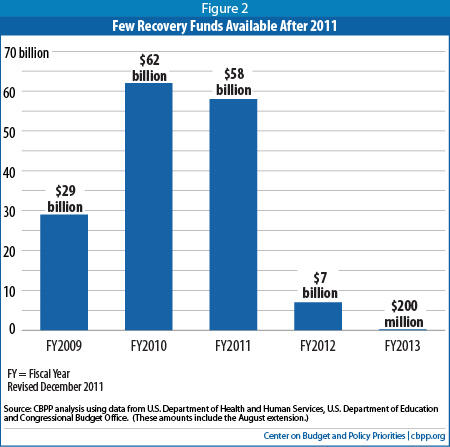
Federal assistance significantly lessened the extent to which states needed to take pro-cyclical actions -- spending cuts or tax increases -- that would have further harmed the economy early on. The American Recovery and Reinvestment Act (ARRA), enacted in February 2009, included substantial assistance for states, including about $135 billion to $140 billion over a roughly 2½-year period to help states maintain current activities. Most of this money was in the form of increased Medicaid funding and a “State Fiscal Stabilization Fund” (SFSF) that mainly aided education. Funding for both Medicaid and the SFSF was increased further in the August 2010 jobs bill, bringing the total to about $156 billion. (Other funding in the economic recovery act flowed through states to local governments or individuals, but these did not address state budget shortfalls.) This money reduced the extent of state spending cuts and state tax and fee increases. Before most ARRA funds expired in June 2011, they accounted for 32 percent of gap-closing.
Federal assistance ended before state budget gaps fully closed. The Medicaid funds expired in June 2011, the end of the 2011 fiscal year in most states.4 By then, states also had drawn down most of their State Fiscal Stabilization Fund allocations. ARRA funds, including the August 2010 extensions, closed some 24 percent of state budget gaps through fiscal year 2012. So even though significant gaps remained in 2012 and more are expected in coming years, there will be little additional federal money available to help close them. With reserve funds largely depleted, states have had to turn to spending cuts, tax increases, or a combination of the two – and they have mostly chosen to cut spending, as described below.
State Spending Was Cut Significantly
States relied heavily on cuts in funding for public services to balance their budgets over the last five years. Over $290 billion (45 percent) of the cumulative gap-closing measures through fiscal year 2012 were spending reductions.
The spending cuts that were used to balance states’ current (fiscal year 2012) budgets show how widespread the reductions are. The vast majority of states — at least 38 of 47 states with new budgets — have made major cuts to core public services.[7]
- At least 23 states have deeply cut pre-kindergarten and/or K-12spending. Mississippi will fail for the fourth year in a row to meet statutory spending requirements enacted to ensure adequate funding in all school districts. (The three previous years of underfunding have cost over 2,000 school employees their jobs.) Washington’s budget cuts an amount equal to $1,100 per student in K-12 funds for reducing class size, extended learning time, and teachers’ professional development.
- At least 20 states have made identifiable, deep cuts in health care. Arizona has frozen enrollment in part of its Medicaid program, so an estimated 100,000 low-income people who previously would have qualified will not be able to enter the program and another 150,000 will face more stringent rules for retaining eligibility. Washington has frozen enrollment for a state-run health plan serving approximately 40,000 low-income residents, which is expected to reduce the number of participants to 37,000 in 2012 and to 33,000 in 2013.
- At least 25 states have made major, identifiable cuts in higher education. Florida’s cuts in funding for universities have led to tuition hikes of 15 percent for the new school year, bringing the cumulative tuition increase since 2009 to 52 percent. Arizona cut state support for public universities by nearly one-quarter; when combined with previous cuts, this puts per-student state funding 50 percent below pre-recession levels. California’s new budget reduces funding for the state’s two university systems by more than $1 billion. For one of those systems, the University of California, tuition for the 2011-12 school year will be 18 percent above last year’s rates and over 80 percent higher than it was in the 2007-08 school year.
- At least 16 states have laid off employees or cut pay and/or benefits for public workers.
Now, in the spring of 2012, states are in the process of adopting budgets for fiscal year 2013, which in most states starts on July 1. Most states have failed to fully restore the programs cut in the aftermath of the recession and many are making additional cuts.
Many States Raised Taxes and/or Fees to Some Extent
The majority of states have raised taxes and/or fees as part of balancing their budgets during the fiscal crisis, but many of the increases have been relatively small. In total, tax and fee increases accounted for some $101 billion (15.5 percent) of the total gap-closing measures states used in fiscal years 2008 through 2012. Most of these tax increases were temporary.
States have taken such actions as eliminating tax exemptions, broadening tax bases, and increasing rates, as well as raising a number of fees. Doing so is part of an established pattern; states historically have turned to revenue increases as part of the response to recessions. Much of this activity took place in 2008 and 2009. The tax changes enacted in those two years were substantial and widespread.
- In 33 states, tax changes increased annual revenues, relative to what the state otherwise would have collected, by $31.7 billion. Even after accounting for a few states that lowered taxes, net tax changes for 2008 and 2009 totaled $29.7 billion in expected revenues, or 3.8 percent of total state revenues.[8]
- In 20 states, tax changes provided a significant boost to revenues — that is, they produced additional revenue of more than 1 percent of the prior year’s total revenues. Ten of those states raised taxes by more than 5 percent of the prior year’s collections: California, Delaware, Florida, Indiana, Massachusetts, Nevada, New Hampshire, New York, North Carolina, and Oregon.
- Personal income taxes and sales taxes, the two largest sources of state tax revenue, experienced the greatest changes. Overall in 2008 and 2009, 13 states raised personal income taxes; 17 increased sales taxes; 22 increased excise taxes on tobacco, alcohol, or motor fuel; 17 increased business taxes; and 24 increased fees or other taxes. In dollar terms, sales and excise tax changes accounted for 37 percent of the net increase, or $11.0 billion. Nearly one-third of the expected new revenues, $9.8 billion, came from personal income tax changes.
- The remaining nearly $9.0 billion, close to one-third of the total, came from corporate taxes, miscellaneous taxes, and fees. Corporate tax changes accounted for 11 percent of the revenue increase, or $3.1 billion, equal to slightly less than 0.5 percent of state revenues.
Since 2009, only a few states have enacted substantial new tax increases. In budgets adopted in 2011, for example, just five states balanced deep spending cuts with significant revenue-raising measures. These measures included extending expiring tax surcharges, repealing tax credits or deductions, broadening the base of some taxes, and raising rates. Connecticut’s budget increased income tax rates for many filers, expanded the sales tax base to include more services, increased the sales tax rate, and instituted a rule that would make it harder for corporations to avoid income taxes, among other revenue measures. Hawaii raised over $600 million in new tax revenue over the past two years by limiting general excise tax exemptions for businesses and eliminating the standard deduction and capping itemized deductions for higher-income filers, among other actions.
Other Measures Including Short-term Fixes Were Part of the Solution
States closed a significant portion of their budget gaps with short-term measures in hopes that the economy would improve quickly and revenues would grow rapidly. In total, these measures made up $45.3 billion (7.0 percent) of the gap-closing tactics used by states. This included borrowing and the securitization of tobacco settlement payments. In addition, states relied on accounting gimmicks such as moving payment dates into the following fiscal year or accelerating tax or fee collections. Some states sold assets such as state-owned buildings or land.
Mix of Gap-Closing Measures Changed as Fiscal Crisis Dragged On
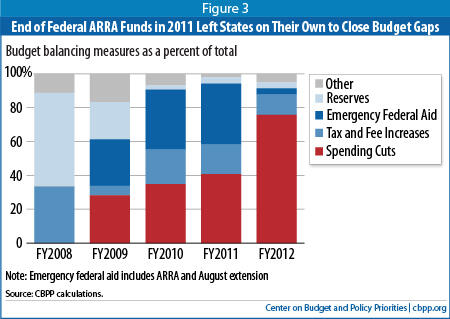
In the early years of the downturn, states used budget reserves to mitigate the need for large spending cuts and revenue increases. Emergency federal aid, which first became available in fiscal year 2009, played a major role in gap closing until it expired at the end of fiscal year 2011. Revenue increases were most prominent in fiscal years 2010 and 2011. States cut spending throughout these years, but the largest cuts came in fiscal year 2012 when reserves were exhausted, federal aid had expired, and few states raised taxes. (See Tables 2 and 3 in the Appendix.)
- Fiscal Year 2008 - The fiscal crisis was first felt by states during the 2008 fiscal year but did not have a major effect on state budgets until the following year. States mainly relied on reserves to address the relatively small shortfalls that developed in 2008. Tax or fee increases also played a role but were relatively small for the most part.
- Fiscal Year 2009 - States adopted budgets for fiscal year 2009 based on revenue estimates that later proved too optimistic as the economic downturn began to reduce collections sharply.
- Fiscal Year 2010 - State officials realized they were facing a continuing crisis and had more time to develop solutions by fiscal year 2010. The mix of gap-closing measures changed. Rainy day fund and reserve withdrawals were limited to $4.4 billion, since the funds had been mostly depleted in the first year of the fiscal crisis. A number of states adopted revenue increases. Tax and fee increases raised about $36 billion in fiscal year 2010. But these two actions closed less than one-fourth of the gap that states faced. States also cut spending by over $60 billion compared to the cost of continuing programs at pre-recession levels. They used the federal fiscal relief (ARRA) to close over one-third (35 percent) of these gaps and once again relied on short-term measures, such as borrowing and securitizing tobacco settlement funds, in hopes that the economy would turn up again quickly and revenues would grow rapidly. These measures accounted for 7 percent of gap-closing efforts.
- Fiscal Year 2011 - By the fourth year of fiscal crisis, rainy day funds were mostly depleted, states were running out of short-term measures and revenues continued to decline. States faced budget gaps totaling $147 billion. ARRA closed $58 billion of these gaps. States turned to additional tax and fee increases totaling some $28 billion. States also came up with additional short-term measures sufficient to close about $3 billion of the gap. But this left some 40 percent of the gap to be closed by spending cuts.
- Fiscal Year 2012 –States relied almost exclusively on spending cuts to close their budget gaps. ARRA funds were effectively gone. This left states on their own to close budget gaps. Spending was cut $135 billion below pre-recession levels. Few states turned to revenue-raising. Additional tax and fee increases totaled only around$21 billion. States also came up with additional short-term measures sufficient to close about $9 billion of the gap and used $6 billion in rainy day funds and other reserves.
Implications for the Future
The heavy reliance on spending cuts to balance state budgets, especially in 2012, means that funding for education, health care, and other services remains below the pre-recession trend levels. While resumed economic growth has boosted state revenues, the depressed revenue base will make it difficult for states to return to pre-recession budget levels. States will need considerably higher-than-average growth to generate revenues sufficient to restore the cuts of the past few years and return program funding to normal levels.
Figure 5 illustrates the magnitude of the problem. State revenues have begun to rebound, growing 8.3 percent in the 12-month period ending in June 2011. This offers a glimmer of hope that states are beginning to climb out of the fiscal hole caused by the recession. Unfortunately, that hole was so deep that even if revenues continue to grow at last year’s rate — which is highly unlikely, as explained below — it would take seven years to get them back on a normal track.
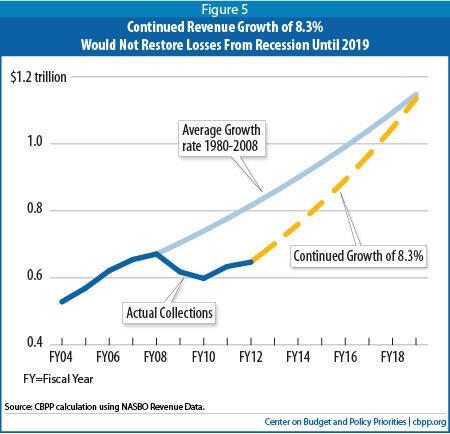
Figure 5 shows how much states would be collecting if revenues had not dropped sharply due to the recession but instead had continued to grow at their historical rate of approximately 5 percent per year. (The 5 percent rate is based on actual collections between 1980 and 2008, with adjustments for inflation and GDP growth.) It also shows that, even at the 2011 rate of 8.3 percent, revenues wouldn’t get back on a normal track until 2019.
State tax collections typically grow faster than normal after a recession as they recover from a reduced base. But states haven’t experienced sustained multi-year growth at an 8.3 percent annual rate since the 1960s.
As most states approach the end of fiscal year 2012 it appears that revenue growth has started to slow. The Census Bureau reported growth of 6.1 percent for the first quarter of fiscal year 2012 and preliminary data from the Rockefeller Institute shows revenue growth of just 2.7 percent for the second quarter. A recent Goldman Sachs report noted that the first- quarter growth was the smallest increase in over a year.[9] Many state forecasters expect this slowdown to continue: In the budgets adopted for this fiscal year (fiscal year 2012), states projected growth of less than 2 percent for the full year on average.[10] Another indication that states continue to face budget difficulties is the fact that 30 states have closed or are addressing budget gaps for the upcoming fiscal year (2013).[11]
Conclusion
The measures that states used to close their budget gaps, combined with the severity of the fiscal crisis that states faced, suggest that state services will remain at risk for a number of years. During the 1990s state spending grew at the same pace as the economy. States had sufficient revenue to accommodate rising health costs, growing school enrollments and other cost increases. In addition, in response to public demand, many states were able to increase their investment in elementary and secondary schools, reduce reliance on local property taxes, expand health coverage for low-income children and their families, and expand access to higher education. Much of this progress was rolled back as states cut their budgets in response to the recession of the early 2000s. The deeper recession that followed in 2007 resulted in further painful spending cuts before the states had recovered fully from the earlier recession.
The steep spending cuts of the last few years have caused declines in virtually all services provided by states. Even if state revenues begin to grow much faster than average, states will not be able to restore these cuts for a long time. The bottom line is that states will face significant shortfalls for a number of years in funding for education, health care, and other services unless they raise taxes or receive additional federal assistance.
APPENDIX
| Table 2: Measures Used to Close Projected Shortfalls (Millions of Dollars) | |||||||
| Fiscal Year | Total Current Services Gap that was closed | Emergency Federal Aid (ARRA) | Rainy Day Funds and Other Reserves | Spending Cuts | Revenue Increases | Other (one-time, borrowing, date shifts, etc) | Offsets - Reserve deposits, spending increases; tax cuts |
| FY2008 | $14,243 | 16,372 | 0 | 9,814 | 3,346 | -15,289 | |
| FY2009 | $95,814 | 29,139 | 23,298 | 29,865 | 5,846 | 17,697 | -10,031 |
| FY2010 | $168,753 | 62,077 | 4,445 | 61,038 | 35,747 | 11,987 | -6,541 |
| FY2011
| $147,152 | 57,722 | 6,088 | 65,445 | 27,936 | 3,337 | -13,376 |
| FY2012 | $169,335 | 6,617 | 6,346 | 134,764 | 21,437 | 8,949 | -8,778 |
| TOTAL | $595,297 | $155,555 | $56,549 | $291,111 | $100,780 | $45,316 | -$54,015 |
| Table 3: Measures Used to Close Projected Shortfalls (Percent of Total Measures) | |||||
| Fiscal Year | Emergency Federal Aid (ARRA) | Rainy Day Funds and Other Reserves | Spending Cuts | Revenue Increases | Other (one-time, borrowing, date shifts, etc) |
| FY2008 | 0.0% | 55.4% | 0.0% | 33.2% | 11.3% |
| FY2009 | 27.5% | 22.0% | 28.2% | 5.5% | 16.7% |
| FY2010 | 35.4% | 2.5% | 34.8% | 20.4% | 6.8% |
| FY2011 | 36.0% | 3.8% | 40.8% | 17.4% | 2.1% |
| FY2012 | 3.7% | 3.6% | 75.7% | 12.0% | 5.0% |
| TOTAL | 24.0% | 8.7% | 44.8% | 15.5% | 7.0% |
METHODOLOGY
Shortfall Amount per Year
The definition of shortfall used in this report is the gap between current services spending and actual revenues -- net of enacted tax increases and new tax cuts — for all states in aggregate. The current services spending baseline is based on continuing services at the 2008 level. The starting point for the current services spending baseline is the 2008 level of spending reported in the National Association of State Budget Officers’ (NASBO) Fiscal Survey of the States. This was increased each year by the sum of the historical growth in real — i.e. inflation-adjusted -- spending of 2.6 percent plus actual or projected growth in prices as measured by the CPI-U index for each year. Data on actual revenue collections are from NASBO’s fiscal survey of the states.
Revenue Increases
Revenue increases are based on the National Conference of State Legislatures (NCSL) annual budget reports. These publications generally report on just the revenue generated for the initial year of a tax increase. A number of temporary tax increases enacted to address recession-induced shortfalls, however, were effective for multiple years. Information from state budgets and fiscal notes was used to add in the effects of the second year and, if appropriate, additional years for multi-year tax increases. (The effects of new tax cuts were not included in this measure but are accounted for in the Offset measure that is described below.)
Spending Cut Estimate
The spending cut calculations start with the current services baseline used for the shortfall calculation — see description above. This current services baseline for each fiscal year was estimated for each state and was then compared to actual general fund spending from the NASBO survey. The differences were summed. (Only states where spending fell below current services levels were included.) The total of spending cuts was then reduced by the amount of American Recovery and Reinvestment Act (ARRA) funds for that year. The result is the amount that spending for state programs had been cut below pre-recession levels.
Use of ARRA Funds
The data on ARRA dollars used to close shortfalls each year are from the U.S. Department of Health and Human Services, the U.S. Department of Education and the Congressional Budget Office. These figures were adjusted by the Center to match state fiscal years.
Rainy Day Fund and Other Reserve Use
Use of rainy day funds and reserves was calculated with the data on ending balances reported yearly in NASBO’s Fiscal Survey of the States. Only states where the balance dropped from one year to the next were included. The year-to-year decreases for each of these states were summed to derive a total figure.
Offsets
The total of these budget-balancing measures add up to more than the total current services shortfalls faced by the states. This is because individual states also took measures that widened rather than narrowed the shortfalls they faced, including new tax cuts[12] , deposits to rainy day funds, and, in a few cases, increases in spending above current service levels. The sum of these changes for each of the states is shown as an offset to the shortfall-closing measures taken by states.
Other
The “Other” amount equals the difference between the total shortfall (plus the amount offset by measures that widened the gap) and the sum of the gap-closing measures described above. It includes the use of payment shifts, borrowing, securitization, gimmicks and other gap-closing measures not identified above.
End Notes
[1] See the box on page 3 for an explanation of why these shortfall figures differ from those in other Center publications.
[2] The methods used to obtain these estimates are summarized in the box on page 3.
[3] According to annual surveys conducted by the National Association of Budget Officers, some 39 states reported rainy day fund withdrawals to close budget gaps in at least one year between 2008 and 2012. Fiscal Survey of the States, various years, www.nasbo.org
[4] The Fiscal Survey of the States, National Governors’ Association and National Association of State Budget Officers, Fall 2011. www.nasbo.org.
[5] Fiscal year 2012 spending is compared to 2008 spending adjusting only for inflation here. This differs from the spending cut calculations relative to current services used in the remainder of the paper.
[6] This figure refers to spending proposed in states’ operating budgets – typically referred to as general fund spending.
While there is some variation by state, general fund spending is usually funded with general revenues collected by the
state, such as income and sales taxes. Massachusetts is a clear exception: there, the operating budget includes federal
funds and spending of non-general state funds. For the sake of comparison with other states in this paper, we have
netted out federal funds from Massachusetts’s spending figures. Also, to be consistent with previous years, California’s
general fund spending total for FY2012 includes $7.7 billion associated with the realignment of certain services to local
governments.
[7] Many of the cuts that have already been implemented are described in a separate Center on Budget and Policy
Priorities publication, “An Update on State Budget Cuts,” at https://www.cbpp.org/cms/index.cfm?fa=view&id=1214.
It is not always possible to identify specific cuts in an enacted budget, largely because many states do not provide enough
information in budget documents to determine whether a cut is being imposed or not. For example, many states do not
indicate what the cost would be to maintain the same level of services as the previous year, so it may not be possible to
say whether the appropriation is enough to maintain services or whether instead it will require that cuts be made.
[8] For more information, see State Tax Changes in Response to the Recession by Nicholas Johnson, Cathy Collins, and Ashali Singham. Center on Budget and Policy Priorities. March 8, 2010.
[9] States Post Another Strong Quarter in Tax Collections, Data Alert, Nelson A. Rockefeller Institute, December 8, 2011. Goldman Sachs Global Economics, Commodities, and Strategy Research, U.S. Daily: State Tax Revenues Looking Softer in Q3, November 7, 2011.
[10] The Fiscal Survey of the States, National Association of State Budget Officers, Fall 2011.
[11] Center on Budget and Policy Priorities, States Continue to Feel Recession’s Impact, Elizabeth McNichol, Phil Oliff, and Nicholas Johnson, March 21, 2012. https://www.cbpp.org/sites/default/files/atoms/files/2-8-08sfp.pdf
[12] The expiration of temporary tax increases were not considered tax cuts for this calculation.
More from the Authors