Tax Foundation Figures Do Not Represent Typical Households’ Tax Burdens
Figures May Mislead Policymakers, Journalists, and the Public
The Tax Foundation released its annual “Tax Freedom Day” report today that, once again, leaves a strikingly misleading impression of tax burdens — announcing an “average” tax rate across the United States that’s likely higher than the tax rate that 80 percent of U.S. households actually pay.
To project the day when Americans will have “earned enough money to pay this year’s tax obligations at the federal, state, and local levels,”[1] the Tax Foundation calculates the “average” tax rate by measuring tax revenues as a share of the economy (similar to estimates of total revenues as a share of Gross Domestic Product, or GDP). Its report suggests the “average” household pays this “average” tax rate.
In reality, in a progressive tax system like that of the United States, only upper-income households (the top 20 percent) pay tax at rates that are equal to or above revenues as a share of the economy.
The Tax Foundation acknowledges this issue in a methodology paper accompanying its report, noting that its estimates reflect the “average tax burden for the economy as a whole, rather than for specific subgroups of taxpayers.”[2] Consequently, those who report on “Tax Freedom Day” as if it represented the day until which the typical American must work to pay his or her taxes are misinterpreting these figures and inadvertently fostering misimpressions about the taxes that most Americans pay.
Moreover, the Tax Foundation report suggests that people spend part of the year working for the government and part of it working for themselves, becoming “free” only when they get to work for themselves. In reality, taxes pay for services that benefit us every day and are central to our idea of freedom, from national defense to highways to health insurance for the elderly. Few Americans would likely feel more “free” if “Tax Freedom Day” came earlier in the year because the federal government stopped providing for national security, ensuring homeland security, conducting food safety inspections, or testing prescription drugs.
Finally, the report’s estimates of state and local tax burdens suffer from a number of serious methodological flaws (see box below).
Tax Foundation’s Federal Tax Rate Estimates Driven by High-Income Taxpayers
The Tax Foundation’s Tax Freedom Day calculation relies on an estimate of what it labels the total effective tax rate: total tax receipts as a share of total national income.[3] That estimate includes an estimate of the total federal effective tax rate.
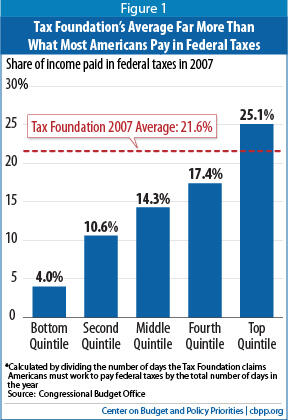
The Tax Foundation estimates that in 2007, the federal effective tax rate was 21.6 percent. [4] But as Figure 1 shows, the Congressional Budget Office (CBO) estimates that households in each of the bottom four quintiles of the income scale paid less than 21.6 percent of their income in federal taxes in 2007.[5] (2007 is the most recent year for which the CBO data are available.) Only households in the top quintile paid a higher amount: 25.1 percent.[6] The CBO estimates suggest that roughly 80 percent of U.S. households pay a smaller share of their incomes in federal taxes than the overall federal effective tax rate.[7]
The Tax Foundation’s estimated effective federal tax rate for 2012 is noticeably lower than it was for 2007 — 18.8 percent rather than 21.6 percent. Although we do not have data on federal effective tax rates in 2012 by quintile, we would expect decreases in the federal effective tax rates that each quintile paid, relative to the rates that CBO reported for 2007, so that the federal effective tax rate for each of the lower four quintiles would still be lower than the average federal effective tax rate for all taxpayers as calculated by the Tax Foundation. This is because the factors causing the lower effective rates — namely, the recession and the extension of the payroll tax cut through 2012 — affect all income quintiles. In fact, the payroll tax cut will reduce effective tax rates more for the bottom quintiles than for the top quintile.[8]
The following example shows how the Tax Foundation’s methodology can overstate the tax burdens of the typical family. Suppose four families with incomes of $50,000 each pay $2,500 in taxes (5 percent of their income) while one wealthy family with income of $300,000 pays $90,000 in taxes (30 percent of its income). Total income among these five families is $500,000, and the total amount paid in taxes is $100,000. Thus, 20 percent of the total income of the five families goes to pay taxes. But it would be highly misleading to conclude that 20 percent is the typical tax burden for families in this group.
Tax Foundation’s Average Figures Can Be Misleading
To be sure, an average figure like the one that the Tax Foundation has calculated can yield useful information. Revenues measured as a share of the economy or as a share of national income are the most reliable metric for comparing revenue levels over time or across countries. The problem occurs when the tax burden figure that the Tax Foundation calculates is taken to represent the tax burden of the typical American worker.
For example, in 2006, the Wall Street Journal wrote, “The Tax Foundation reports that the average American works 116 days of the year to pay their tax bill (emphasis added).”[9] Last year, CNN Money reported that, “Americans will spend an average of 28% of their income to pay federal, state and local taxes this year, the Tax Foundation said Wednesday. That means you will need to work 102 days — more than three months — just to earn enough to pay your tax bill. So on April 12 you will be free of your 2011 tax burden.”[10] Most people reading these articles would likely assume that the figures cited apply to the average or typical family. Yet that is not the case.
Tax Foundation’s State-by-State Data Are Seriously Flawed
The Tax Foundation’s proclamations of state Tax Freedom Days are meaningless because the report’s state-by-state estimates are flawed. They are not useful for discussing the level of taxes paid by typical households or for assessing the tax choices made by a given state’s policymakers, for at least four reasons.
- The State Tax Freedom Day estimates overstate middle-class tax levels. About two-thirds of the taxes in the Tax Foundation calculations are federal taxes. The amount of federal tax paid by the residents of a state thus has a large impact on that state’s “Tax Freedom Day.” Since, as this analysis explains, the Tax Foundation methodology substantially overstates the federal tax burden of middle-class families, the Tax-Freedom-Day figures for each state also substantially exaggerate the tax burdens of middle-class families in that state.
- The estimates reflect state affluence rather than state taxes. Because the federal income tax system is progressive, states with greater numbers of high-income residents pay more federal taxes than states with fewer high-income residents. As the Tax Foundation acknowledges, “This means higher-income states celebrate Tax Freedom Day later.” Yet by trumpeting state-level Tax Freedom Days that differ across the states, the Tax Foundation presentation is likely to lead to the misimpression that state and local policies account for the differences, when that is not the case.
They include taxes paid in other states. The Tax Foundation uses a procedure to allocate state corporate, severance, and tourism taxes based on the residence of the consumers who purchase products that businesses sell (adjusted for taxes that tourists pay). This is likely to lead to further misimpressions about the role of a state’s tax policies on the tax burdens its residents are said to face. For example, when Alaska collects taxes from oil companies based on companies’ revenue and profits from Alaska oil, the Tax Foundation does not count those taxes as part of Alaska’s revenue. Rather, it adds those taxes to the tax calculation in the states where oil is consumed. Maine residents, for example, consume a significant amount of fuel and so get allocated a large share of these Alaska taxes. Yet state legislators in Maine cannot have much impact on the level of taxes that Alaska or other oil-producing states levy on oil.
The estimates rely on a model that has proven wrong in the past. While the Tax Foundation uses Congressional Budget Office data to project total federal tax collections, there is no equivalent of the CBO for state and local governments. Rather, the Tax Foundation uses its own proprietary (non-public) model to estimate taxes that will be collected during the year in tens of thousands of state and local jurisdictions around the country. While presented as definitive, these estimates have proven significantly off-target when the Census Bureau subsequently publishes actual data on state and local taxes. For example, the Tax Foundation’s 2002 report claimed that since 2000, tax burdens had risen in 38 states, fallen in five states, and not changed in seven states. When the Census Bureau released its data for 2002, it found that only four states’ tax burdens had risen, while tax burdens in 43 states had fallen (burdens were unchanged in three states). In its reports, the Tax Foundation does not adequately acknowledge the possibility that its data may be erroneous. Nor does the Tax Foundation give prominent attention to the revisions it makes when its previous estimates prove to have been faulty.
For all these reasons, the Tax Foundation’s proclamations of state Tax Freedom Days are misleading and do little to inform legitimate debates over levels of state and local taxes and the services those taxes support.
______________________
* See Nicholas Johnson, Iris Lav, and Joseph Llobrera, “Tax Foundation Estimates of State and Local Tax Burdens Are Not Reliable,” Center on Budget and Policy Priorities, March 27, 2007.
Tax Foundation’s Treatment of Budget Is Even More Problematic
The Tax Foundation also presents an alternative “deficit-inclusive” Tax Freedom Day (or “Deficit Day”), which it measures by calculating total federal, state, and local tax receipts plus the federal budget deficit as a share of total national income. This measure is also highly misleading. It implies that each year’s deficit can simply be added on to the amount that taxpayers pay in taxes that year as a representation of “the burden of government.” But that is not the case.
The effect of deficits on the long-term budget outlook and future generations is a legitimate source of concern, but deficits can actually benefit the economy and taxpayer rather than imposing a burden. For instance, deficits that finance important investments can provide long-term benefits for the nation. And, the large deficits in recent years — which largely reflect the weak economy and efforts to stimulate it — have kept the downturn from being far worse than it has been.[11]
Programs like unemployment insurance, food stamps, and Medicaid — what economists refer to as “automatic stabilizers” — automatically expand when the economy weakens, thereby helping to limit the decline in purchasing power in a slumping economy. These spending increases, as well as legislation making temporary changes in spending and tax policy to boost the economy, generally have only a small effect on long-term deficits, even if the short-term budgetary effect is substantial.
A Further Problem with “Tax Freedom Day”
The Tax Freedom Day concept also suffers from a deeper flaw. In its annual report, the Tax Foundation attempts to divide the year into days that Americans spend working to pay federal, state, and local taxes and days they spend working for “themselves” so they can pay for goods such as food, clothing, housing, transportation, and medical care.
As the Tax Foundation itself acknowledged in its 2007 report, however, government revenues fund health and medical care for elderly and low-income Americans, as well as a significant fraction of the medical research that generates valuable health care innovations for Americans of all ages and income levels. Government revenues also fund Social Security payments that enable people who are elderly or have disabilities to pay for food, clothing, and housing.[12] Moreover, government revenues are needed to build and maintain the roads and bridges that families use every day. Government revenues also fund the educational system, justice system, and other basic infrastructure, without which many Americans would not be able to earn the incomes they do.
Of course, there are important debates to be had about the appropriate size of government. But the Tax Foundation’s implication that Americans derive no benefit whatsoever from the goods and services government provides does not further those debates. Rather, these debates require careful consideration of the merits of trading public for private goods and services, recognizing that both can generate value for American households.
End Notes
[1] Tax Foundation Release “Tax Freedom Day® to Arrive April 17 in 2012”, announcing William McBride, “Tax Freedom Day 2012” Tax Foundation Special Report No. 198, April 2012.
[2] See Tax Foundation Staff, “Tax Freedom Day: A Description of Its Calculation and Answers to Some Methodological Questions,” Tax Foundation Working Paper No. 3, March 2008.
[3] As its measure of national income, the Tax Foundation uses Net National Product (NNP). In prior years, the Tax Foundation reported its estimates of the federal effective tax rate, but its most recent reports include only its estimates of total effective tax rates (including state and local taxes). However, its estimate of the federal effective tax rate for 2012 can be derived from its estimates of the total effective tax rate and the share of total tax receipts flowing to the federal government. Specifically, the Tax Foundation reports on page 1 of its analysis that the total effective tax rate for 2012 will be 29.2 percent. On page 1 it implies Americans will have to work 69 days to pay federal taxes and 107 days to pay all taxes. Multiplying that ratio (69/107) by the total effective tax rate (29.2 percent) yields a federal effective tax rate of 18.8 percent. Estimates for prior-year federal tax burdens are taken from the 2007 Tax Freedom Day report.
[4] In its initial release for 2007, the Tax Foundation implied that the effective federal tax rate for 2007 was 21.6 percent and the effective total tax rate was 32.7 percent (Curtis S. Dubay & Scott A. Hodge, “America Celebrates Tax Freedom Day,” Tax Foundation Special Report No. 152, April 2007). In 2011, the foundation revised the 2007 total effective tax rate down to 31.1 percent but did not state or imply that it had recalculated its federal effective tax rate for that year (Kail M. Padgitt, “Tax Freedom Day Arrives on April 12,” Tax Foundation Special Report No. 190, March 2011). If we assume, however, that its 2007 federal rate fell by the same proportion as its total rate, that would put its federal rate at 20.5 percent. Again, the CBO data suggest that at least 80 percent of U.S. households would have paid federal tax at a lower rate than this revised “average” rate.
[5] The Tax Foundation’s estimates also differ from CBO’s in that the income measure the Tax Foundation uses (NNP) is different than CBO’s measure. However, CBO’s estimate of total federal taxes divided by total income is relatively close to the Tax Foundation’s: in 2007, 20.4 percent as compared with the Tax Foundation’s 21.6 percent.
[6] In 2007, a family of four needed income of more than $149,400 to be in the top income quintile.
[7] Of course, the figure for each quintile is an average for that segment of the population. Thus, some households, mostly in the fourth quintile, probably pay a larger share of their income in federal taxes than the Tax Foundation’s reported average. But many households in the top quintile likely pay less, since the top quintile average is pulled up by households at the very top of the income scale.
[8] Urban Institute-Brookings Institution Tax Policy Center Table T12-0006.
[9] Tara Siegel Bernard, “Taxing Thought: All Pay to April 26 Goes to Uncle Sam,” Wall Street Journal, April 19, 2006.
[10] Blake Ellis, “Your tax bill: 3 months of work,” CNNMoney.com, March 31, 2011, http://money.cnn.com/2011/03/31/pf/taxes/tax_freedom_day/index.htm.
[11] See James R. Horney and Chad Stone, “Don’t Let the Ideal Prevent the Necessary,” March 3, 2010, https://www.cbpp.org/sites/default/files/atoms/files/3-3-10stim.pdf; Paul N. Van de Water and Chad Stone, “Budgetary Concerns Should Not Be an Obstacle to Passing the New Jobs Bill,” May 20, 2010, https://www.cbpp.org/cms/index.cfm?fa=view&id=3188.
[12] Ignoring this issue actually gives rise to a significant technical problem in the Tax Foundation’s report. In the pie charts on page 1, which compare the total effective tax rate with the share of total national income spent on food, clothing, and other purchases, government transfers to households — such as Social Security and Medicare — appear both in the tax slice and in the various categories of private consumption.
More from the Authors

Areas of Expertise