Blog Post: Chairman Ryan’s Misleading Chart
House Budget Committee Chairman Paul Ryan recently summarized his new tax proposal this way:
[W]e’re saying get rid of all the special interest loopholes and tax shelters that are disproportionately used by those higher income earners, get rid of those tax shelters, so you can lower tax rates for everybody, and make us better wired for economic growth and job creation.
Chairman Ryan has also said that most tax-expenditure benefits go to high-income people.
The lead tax chart in Chairman Ryan’s budget document seems to support his statement, suggesting that the tax code includes a series of egregious loopholes (or “tax expenditures”) that mostly flow to very rich individuals. It gives the impression that we can easily eliminate tax expenditures for the very wealthy and thereby pay for lower rates for all taxpayers — including the Ryan plan’s big reduction, to 25 percent, in the top income tax rate.
Image
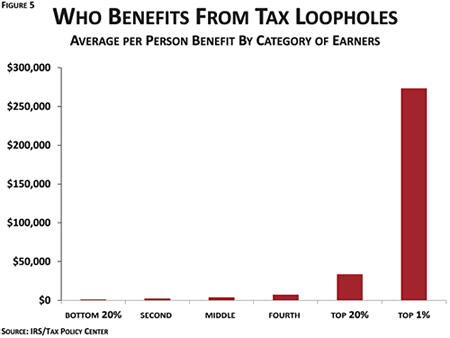
The chart in question is based on data from the Urban-Brookings Tax Policy Center (TPC). But it does not show what Chairman Ryan suggests it does, for two key reasons.
First, the chart shows tax-expenditure benefits per person. There obviously are far fewer people in the top 1 percent of the population than in the other income groups shown, each of which consists of 20 percent of the population. So, the top 1 percent receives a much smaller share of the total benefits of tax expenditures — and the other income groups receive much larger shares —than a quick look at this graph might lead you to think.
Second, the graph covers all tax expenditures, including the preferential tax rate for capital gains and dividends. Fully 75 percent of the benefits of that tax expenditure flow to the top 1 percent of people. But Chairman Ryan’s budget essentially rules out raising the low capital gains and dividend tax rate.
The long document that Ryan issued on March 20 presenting his budget takes President Obama to task for proposing to let the capital gains rate on high-income households return to the 20 percent level at which it stood before the Bush 2003 tax cuts (as compared to today’s 15 percent rate) and declares, “Raising taxes on capital is another idea that purports to affect the wealthy but actually hurts all participants in the economy.”
Once you take the capital gains and dividends preference off the table, the benefits of the remaining tax expenditures are fairly evenly distributed across income groups, as the next graph shows. This is a very different picture than that which Chairman Ryan’s graph seems to depict.
Image
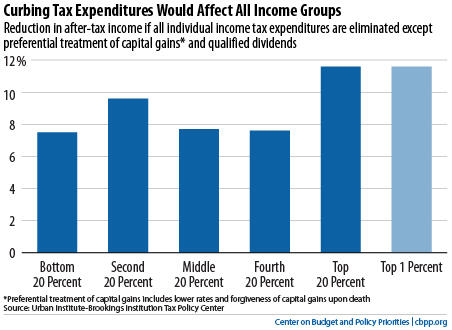
The biggest of these tax expenditures are the mortgage interest deduction and the exclusion for employer-provided health insurance. Both are ripe for progressive reform; for example, why should the government subsidize mortgage interest at a 35 percent rate for a wealthy banker but at a 15 percent rate for a middle-income welder? But, neither fits Chairman Ryan’s description of “special interest loopholes and tax shelters that are disproportionately used by those higher income earners.” Elimination of the exclusion for employer-provided health insurance, for example, would hit the middle class harder than very high-income people.
Also keep in mind that the Ryan budget would use the revenue from reducing tax expenditures not to reduce our unsustainable long-term deficits but to help finance a cut in tax rates that would disproportionately benefit the wealthiest people in the country. TPC estimates that the rate cuts (and other Ryan tax reductions) would raise after-tax incomes by 12.5 percent among people making more than $1 million a year — providing them an average annual tax cut of $265,000, on top of an average annual tax cut of $129,000 from making the Bush tax cuts permanent — but by just 1.9 percent among middle-income households.
The Ryan budget thus would lower the taxes of the nation’s most affluent people even if that means failing to contribute to deficit reduction and/or shifting tax burdens to middle- and lower-income families.
Receive the latest news and reports from the Center