Incomes at the Top Rebounded in First Full Year of Recovery, New Analysis of Tax Data Shows
Top 1 Percent’s Share of Income Starting to Rise Again
Incomes of the top 1 percent of households, which fell in the financial crisis and Great Recession, rose strongly in 2010, the first full year of the economic recovery, according to a new analysis by economist Emmanuel Saez.[1] The new analysis, which incorporates 2009 and 2010 IRS data into the historical series on pre-tax income created by Saez and his colleague Thomas Piketty,[2] finds:
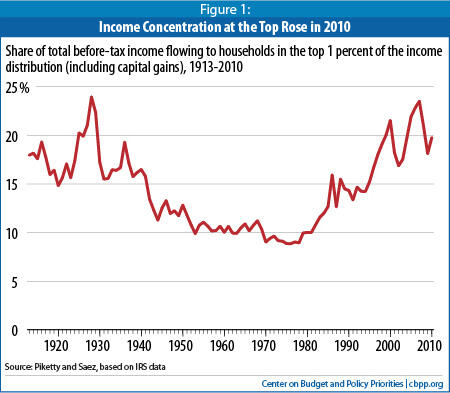
- The share of U.S. households’ total income flowing to the top 1 percent of those households rose to 19.8 percent in 2010. Although lower than the peaks reached in 2000 and 2007, that percentage is still among the highest since the late 1920s (see Figure 1).
- The average income of the top 1 percent of households rose by nearly 12 percent from 2009 to 2010, after adjusting for inflation. The average income growth for the richest households at the very top of the income distribution was even stronger (see text box below). The recent income growth at the top follows significant losses in 2008 and 2009.
- The average income of the bottom 90 percent of households, in contrast, which fell substantially during the recession in both 2008 and 2009, remained at its lowest level since 1983, in inflation-adjusted dollars.
High Income Concentration Persists at the Very Top
Piketty and Saez’s unique data series on income inequality is particularly valuable because it provides detailed information on income gains at the top of the income scale and extends back to 1913. Other sources, however — particularly the Congressional Budget Office (CBO) — are probably more reliable guides to trends in income and its distribution in the bottom 90 percent of the population.[3]
These Piketty-Saez data show that in the past decade, income concentration has reached levels last seen over 80 years ago (see Figure 1). With the latest IRS data, we now have a complete picture of income concentration both during the recent economic expansion (which ended in December 2007) and in the financial collapse and Great Recession (which officially ended in 2009), as well as a glimpse of where concentration may be heading as the economy recovers.
In the Piketty-Saez data, two-thirds of the nation’s total income gains (adjusted for inflation and population growth[4]) in the economic expansion from 2002 to 2007 flowed to the top 1 percent of U.S. households; the top 1 percent held a larger share of income in 2007 than at any time since 1928. From 2002 to 2007, the real (inflation-adjusted) income of the top 1 percent of households grew more than ten times faster than the income of the bottom 90 percent of households.[5]
Growth at the Top Driven by Growth at the Very Top
The share of total before-tax income going to the top 1 percent of households has been rising since the late 1970s, and in the past decade it has climbed to levels last seen in the 1920s. This is mostly because of the rising share of before-tax income going to the top households within the top 1 percent.
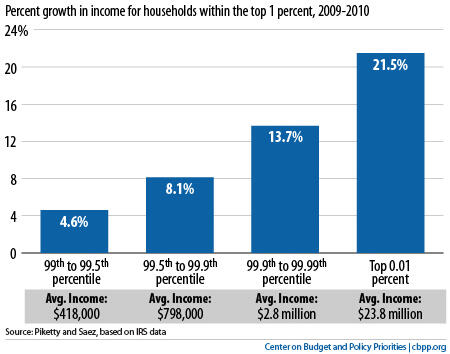
To illustrate the lopsided growth at the top of the income scale, the chart below separates income groups within the top 1 percent of the distribution. The top 1 percent in 2010 had incomes above $350,000 and saw average income growth of nearly 12 percent from 2009 to 2010. As the chart shows, growth for households in the “bottom half” of the top 1 percent was significantly lower than growth for the multimillionaires at the very top of the income distribution.
As a result of the financial collapse and Great Recession, the top 1 percent absorbed nearly half of the total income loss from 2007 to 2009 (after adjusting for inflation and population growth), leaving the average income for this group over 36 percent ($520,000) lower than it was in 2007. While this share of the total income loss is substantial, it is less than this group’s share of the loss in the dot.com collapse at the start of the decade. Moreover, the top 1 percent had a higher average income and a larger share of total income in 2009 than in 2002. Saez notes that those at the top of the income scale took less of a hit in this recession than the prior recession for two reasons: the impact on the bottom 90 percent of households was larger in the Great Recession than in the prior recession, and while capital gains fell sharply during this recession, the other sources of income for the highest-income households did not fall as dramatically.
The 2010 data show that incomes at the top of the distribution have begun to rebound in the first full year of the recovery — especially at the very top (see box). In the Piketty-Saez data, an astounding 93 percent of the income growth after inflation and population growth has gone to the top 1 percent. The average income for this group increased nearly 12 percent ($105,000) in the first year of the recovery, while the average income of households in the bottom 90 percent of the distribution remained at its lowest level in nearly 30 years. The disparities may not be this great in the CBO data, once it is released, but it is still quite likely those data too will show substantially disproportionate gains at the top.
Longer-Term Trends in Income Concentration
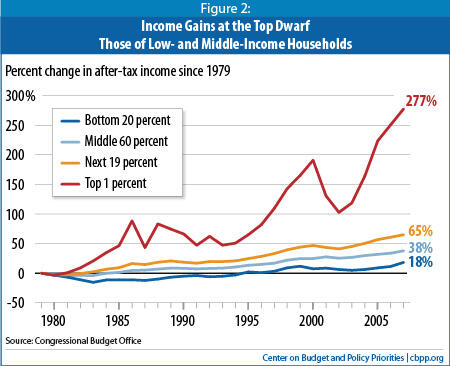
The uneven distribution of economic gains in recent years continues a longer-term trend that began in the late 1970s. In the generation following World War II, robust economic gains were shared widely. But since the late 1970s, income growth for the top 1 percent has rapidly outpaced the rest of the distribution. As discussed, the Piketty-Saez data provide an invaluable long historical series of annual data on income at the top of the distribution, but CBO data — currently available only from 1979 to 2007 — provide a more comprehensive picture of income growth for most of the population. The CBO data show a pattern of growth at the top since 1979 that is similar to that of Piketty-Saez and substantially greater than growth in the middle and bottom of the distribution (Figure 2).[6]
It remains to be seen whether the highest-income households will again capture a highly disproportionate share of income gains as the economy recovers, as they did after the dot.com collapse and subsequent 2001 recession (see Figure 1). Saez notes, however, that income concentration tends to bounce back after economic downturns unless major policy changes — such as those enacted during the New Deal — occur. So it would not be surprising, in the absence of significant policy or behavioral changes, for income concentration to continue rising in the coming years.
End Notes
[1] Emmanuel Saez, “Striking It Richer: The Evolution of Top Incomes in the United States (updated with 2009 and 2010 estimates),” March 2, 2012. Available at http://elsa.berkeley.edu/~saez/saez-UStopincomes-2010.pdf.
[2] Piketty and Saez rely on detailed Internal Revenue Service micro-files for available years, extending the full series to 1913 using aggregate data and statistical techniques. Their March 2012 revision incorporates the detailed micro-files for 2009 and 2010. For details on their methods, see Thomas Piketty and Emmanuel Saez, “Income Inequality in the United States: 1913-1998,” Quarterly Journal of Economics, February 2003. Their most recent data are available at http://elsa.berkeley.edu/~saez/TabFig2010.xls.
[3] One of the most important limitations of the IRS data used by Piketty and Saez is that they do not include people who do not file income tax returns. Rich data on this population are available through the Census Bureau, but the Census data have incomplete information about incomes at the very top of the distribution. Also, neither Piketty-Saez nor Census adjusts incomes for family size, which can distort trends when average family size changes over time. CBO publishes an analysis combining the Piketty-Saez and Census data to estimate average federal tax rates paid by households in various income categories, as well as before- and after-tax household incomes adjusted for family size; this provides the most comprehensive analysis of income distribution but is not as timely as the Piketty-Saez analysis. The most recent CBO report uses 2007 data and provides historical data only back to 1979; see http://www.cbo.gov/publications/collections/collections.cfm?collect=13.
For a more detailed description of these and other sources of income inequality data, please see Chad Stone, Hannah Shaw, Danilo Trisi, and Arloc Sherman, “A Guide to Statistics on Historical Trends in Income Inequality,” Center on Budget and Policy Priorities, March 5, 2012, https://www.cbpp.org/files/11-28-11pov.pdf.
[4] The adjustment for population growth is made to account for the fact that with a growing population, income must increase to keep average household income constant. Additional growth is necessary to raise average living standards. The shares of growth reported in the text are the shares of the income available to raise living standards that go to different income groups.
[5] The last economic expansion began in November 2001 and ended in December 2007. However, the real income of the top 1 percent of households did not reach a trough until 2002 and that of the bottom 90 percent until 2003. For the purposes of this paper, we measure income growth between 2002 and 2007. If we had chosen 2001 as the base year, the share of income gains accruing to the top 1 percent and bottom 90 percent of households would have been 76 percent and 2 percent, respectively. If we had chosen 2003, those respective shares would have been 59 percent and 20 percent. As footnote 2 explains, the CBO data might show somewhat different differential growth between the top 1 percent and the bottom 90 percent, but a large disparity would still exist.
[6] CBO data are more comprehensive than Piketty-Saez — especially for the bottom 90 percent of households — because they are not based exclusively on tax return data. CBO combines tax data with Census data to offer a richer account of incomes lower down the income distribution. The CBO data cited here account for such things as government cash transfers, public and private non-cash benefits (such as government health and nutrition assistance benefits and employer-paid health insurance benefits), and federal taxes. For more on the differences between the data analyzed by Piketty and Saez and CBO, please see Stone et al., 2011.
More from the Authors

Areas of Expertise