TANF Benefits Fell Further in 2011 and Are Worth Much Less Than in 1996 in Most States
Cash assistance benefits for the nation's poorest families with children fell again in purchasing power in 2011 and are now at least 20 percent below their 1996 levels in 34 states, after adjusting for inflation. While most states froze benefit levels in 2011, six states and the District of Columbia cut them, reducing assistance for more than 700,000 low-income families that represent over one-third of all low-income families receiving such assistance nationwide.[1]
The benefits are provided through the Temporary Assistance for Needy Families (TANF) program which was established by the 1996 welfare law. The data cited here are for state fiscal year 2011 (July 2010 to June 2011 in most states). In all but two states, benefit levels are now below 1996 levels, after adjusting for inflation, and these declines came on top of even larger declines over the previous quarter century; between 1970 and 1996, cash assistance benefit levels for poor families with children fell by more than 40 percent in real terms in two-thirds of the states.
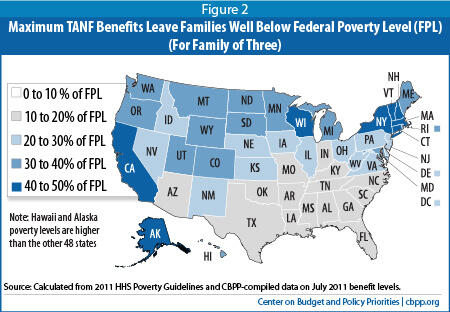
Benefits fall below 50 percent of the poverty line in all states. They fall below 30 percent of the poverty line in the majority of states.
A key goal of the 1996 welfare reform law that replaced the old Aid to Families with Dependent Children program (AFDC) with TANF was to place greater emphasis on work while continuing to provide a safety net to families with children that are unable to work because jobs are not available or they are addressing a personal or family crisis. The program's effectiveness as a safety net depends on the extent to which very poor families are actually enrolled in it and on the level of benefits and the quality of employment and other services that they receive. TANF has been performing inadequately on both of these dimensions for some time, but the situation has worsened during the recent economic downturn because of the combination of increased need and large state budget shortfalls.
Between December 2007 and December 2009, state TANF caseloads increased by just 13 percent nationally, lagging far behind the increases in SNAP (food stamp) caseloads, the number of unemployed, and the number of people in families with children that live below the poverty line. [2] Large numbers of families that qualify for TANF benefits to meet basic needs are not receiving them. In 1996, for every 100 poor families with children, 68 received cash assistance through the AFDC program. In 2009, for every 100 such families in poverty, only 27 received any cash assistance through TANF. And for the shrunken group that does receive assistance, benefits — which already were low when TANF was established and left families far below the poverty line — are now considerably lower in real terms in most states and are continuing to decline in value year by year (see Appendices 1a and 3).
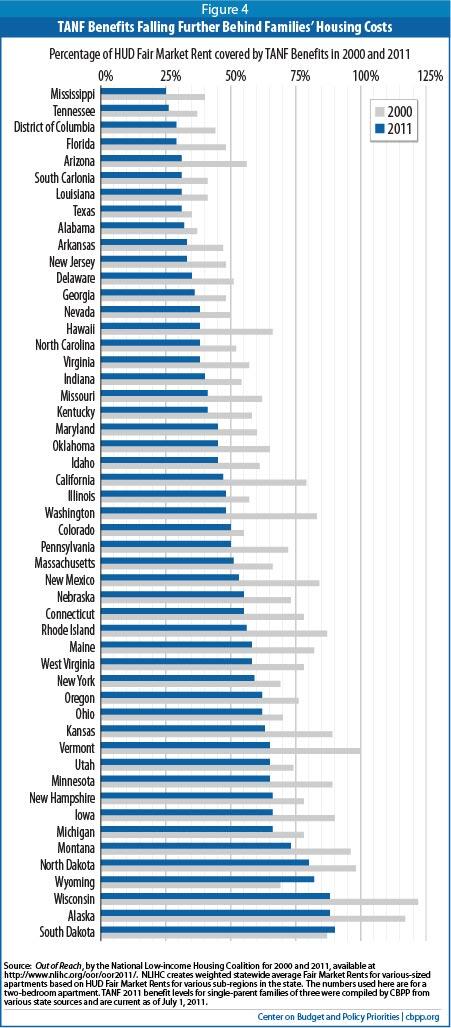
The first purpose of TANF is to provide assistance to needy families so that children may be cared for in their homes or those of relatives, but the cash assistance benefits do not provide sufficient income to fulfill this goal. There is not a single state in the nation in which the TANF benefit level for a family of three with no other income is at least equal to the Fair Market Rent for a two-bedroom apartment. The Fair Market Rent is HUD's estimate of the amount needed to cover the rent and utility costs of a modest housing unit in a given local area. In fact, in a majority of states, TANF benefits amount to less than half of the Fair Market Rent.
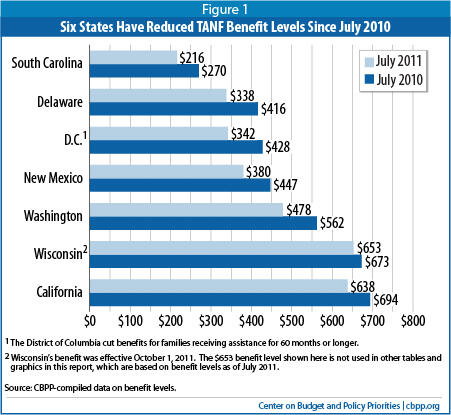
The recent round of TANF benefit cuts includes California, New Mexico, South Carolina, Washington and Wisconsin, which reduced benefit levels for fiscal year 2011, and Delaware, which reduced benefits in October 2010.[3] The District of Columbia also reduced TANF benefit levels for families that have received benefits for at least 60 months.
This was the largest number of states to reduce TANF benefit levels in nominal terms since TANF's creation in 1996. The cuts arose from the intersection of multiple factors:
- Facing record budget shortfalls as well as increased demands on spending due to the recession and its aftermath, states made cuts in a range of areas.
- Additional federal aid provided to states by the 2009 Recovery Act (including aid provided through a new TANF Emergency Fund), which helped carry state budgets through the recession, came to an end.[4]
- Unlike AFDC, the TANF block grant provides flat funding, which does not increase in response to increased need. In addition, Congress failed in 2011, for the first time since TANF's creation, to fully fund the Supplemental Grants that 17 mostly poor states have received every year since 1996. On top of that, Congress failed to adequately replenish the TANF Contingency Fund, created under the 1996 welfare law to provide additional money to states in hard economic times, and that Fund was entirely exhausted in December 2010 and had no funds whatsoever for the final 9 months of federal fiscal year 2011.
- Another key factor is that basic federal TANF block grant funding has eroded substantially in inflation-adjusted terms over the years available. The value of the TANF block grant has declined about 30 percent in real value since 1996.
- Still another major factor is that states now use a much smaller share of the diminished TANF funds they receive for cash assistance to poor families than they did in TANF's early years. In 1997, three of every four federal and state TANF dollars went to cash assistance for these families. Today, only one in four TANF dollars does. States shifted substantial portions of these funds to other purposes in the years when the economy was stronger and need was less, and — for political and other reasons — have been unable (or have declined) to shift funds back when need grew sharply as the economy weakened.
With no additional TANF funds available from the federal government to help states respond to the large increase in the number of impoverished families as a result of the economic downturn, and with tight state budgets, state cuts in TANF cash assistance accelerated in 2011.
Unprecedented TANF Benefit Cuts in 2011
Six states and the District of Columbia have cut benefit levels since July 2010:
- California, New Mexico, South Carolina, Washington, and Wisconsin reduced cash assistance benefits in 2011. California cut benefits by 8 percent, New Mexico and Washington by 15 percent, and South Carolina by 20 percent, in nominal terms. (The cuts in inflation-adjusted dollars were still larger.) Wisconsin cut benefits by $20 per month for many TANF families.
- In Delaware, TANF benefit levels fell in October 2010 when a temporary increase financed by the TANF Emergency Contingency Fund expired with the end of the Contingency Fund. Benefits for a family of three decreased from $416 a month to $338, back to the same nominal level as in 1996. This represents a decline of 30 percent since 1996 in the purchasing power of the benefits (i.e., after adjusting for inflation).
- The District of Columbia cut benefits by 20 percent on April 1, 2011 for families that have received assistance for 60 months or longer. A family of three subject to the decrease saw its benefits cut from $428 to $342.
Three states — Oregon, Texas and Wyoming — have increased their benefit levels since July 2010.[5] In Oregon and Texas, however, benefits remain well below their 1996 levels in purchasing power.
Benefits Leave Families Far Below Poverty Line
TANF benefit levels are so low that they are not sufficient in any state to raise a family's income above 50 percent of the poverty line. [6] (See Figure 2 and Appendix 2.) In 14 states, monthly benefit levels are less than $300 for a family of three (less than $3,600, or 20 percent of the poverty line, on an annual basis).[7]
Because TANF benefits have declined substantially, they do much less to help families escape deep poverty than they did in 1996. A majority of states — 29 of them — have benefit levels below 30 percent of the poverty line; back in 1996, only 16 states did. In all but two states, a poor family relying solely on TANF to provide the basics for its children (such as during a period of joblessness, illness, or disability) is further below the poverty line today than in 1996. (See Appendix 2.)
Some families can combine TANF with earned income to help meet basic needs. Nearly all states have adopted "make work pay" policies under which TANF benefits phase out gradually as family earnings increase. Even so, families become ineligible for TANF cash assistance at very low income levels in nearly all states. Moreover, not all TANF families are able to supplement benefits with earnings; many families include parents with significant disabilities or other barriers to work.
Benefits Have Failed to Keep Pace with Inflation
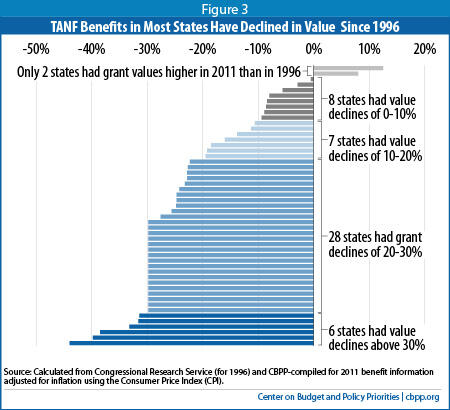
When inflation is taken into account, the value of TANF benefits is lower now than in 1996 in the District of Columbia and every state except Maryland and Wyoming. (See Figure 3 and Appendix 3.) More specifically:
- When adjusted for inflation, cash assistance benefits have declined by 20 percent or more in 34 states since 1996.
- In the 17 states that have the same nominal benefit levels now as in 1996, benefits are worth almost 30 percent less in inflation-adjusted terms than in 1996.
- In six states, TANF benefits are below 1996 levels in nominal terms. This year's cuts added New Mexico and Washington to this group. When adjusted for inflation, New Mexico's benefit level has declined by about 31 percent since 1996, while Washington's has declined by about 39 percent.
The decline in the value of benefits under TANF follows decades of decline in the real value of AFDC benefits. From 1970 to 1996, AFDC benefit levels fell by more than 20 percent in all but one state, after adjusting for inflation, and by more than 40 percent in two-thirds of states. [8]
Benefits Are Not Sufficient to Cover Housing Costs
TANF benefits cover only a fraction of the estimated costs of housing for a family, and housing is only one of the basic needs that a family must meet. In 2011, the monthly TANF benefit level for a family of three is less than the estimated cost of a modest two-bedroom apartment (based on HUD Fair Market Rents or FMRs) in all states, and less than half of the FMR in 26 states. (See Figure 4.) Some TANF families receive housing subsidies, but most do not. Only one in four eligible low-income households receives any federal housing assistance because of program funding limitations.[9]
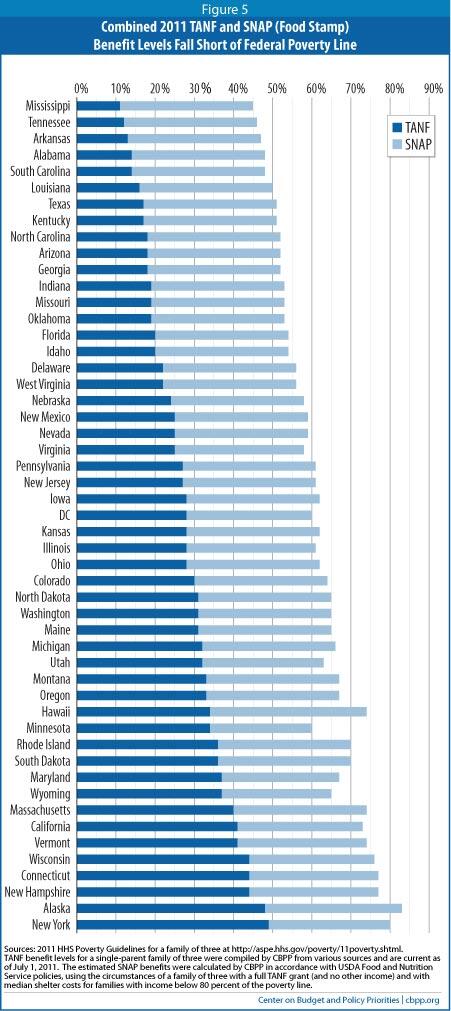
Between 2000 and 2011, the median Fair Market Rent of all 50 states and the District of Columbia increased from $580 to $773, while the median TANF benefit increased from $379 to just $428. (These figures are in nominal dollars — i.e., they are not adjusted for inflation.) As TANF benefits decline in real dollars in most states, they cover a smaller and smaller share of housing costs over time, as Figure 5 shows.
The share of the Fair Market Rent that TANF benefit levels cover has decreased quite sharply in some states. Vermont's TANF benefit level, for example, equaled the FMR for a two-bedroom apartment in 2000 but covered only two-thirds of the FMR by 2011. (See Appendix 4.)
SNAP Benefits Help Fill the Gap, But a Substantial Shortfall Remains
Unlike TANF, the Supplemental Nutrition Assistance Program (SNAP, formerly known as food stamps) has provided a strong safety net for many unemployed families and individuals during the recession. In most states, combined TANF and SNAP benefits do a better job of pulling families out of deep poverty than TANF alone. About 80 percent of TANF cases receive SNAP benefits consistently.[10] In 2010, the average monthly SNAP benefit for households with TANF income was $428 a month.[11] Still, SNAP and TANF benefits combined are below the poverty line in all states and below 75 percent of the poverty line in 45 states. (See Figure 5.) In nearly all states, the gap between combined TANF and SNAP benefits and the poverty line is substantial.
Moreover, the current SNAP benefit levels reflect a temporary increase provided under the 2009 Recovery Act that is now phasing down and will end on October 31, 2013, leaving TANF families further below the poverty line from that point forward. In addition, to simplify the comparison, the SNAP benefit levels used for this comparison overstate the size of the SNAP benefit that many TANF families in a state actually receive. [12]
More TANF Cuts May Be Coming
A stagnant economy and significant state budget shortfalls have caused states to make deep cuts in their TANF programs in recent years. Unfortunately, the fiscal outlook for states' TANF programs in 2012 is as bad as 2011 — in some cases, worse. Some 42 states had to close budget shortfalls for FY 2012 and a number of states will face gaps in coming months.[13] For example, Washington State, which made deep TANF cuts last year including a 15 percent reduction of benefit levels, is facing a new $2 billion shortfall for the remainder of FY 2012 and the Governor has convened a special legislative session in November to consider additional cuts; further TANF cuts are under consideration. Washington's situation is not unique. States are coming out of a very deep fiscal hole, and have a long way to go before they fully recover. [14]
So far, Congress has extended TANF only for the first quarter of federal fiscal year 2012. The extension included $612 million for the TANF Contingency Fund but no funding for the TANF Supplemental Grants, so the 17 Supplemental Grant states will receive less TANF funding, even in nominal dollars, than in any year since TANF's creation.
State legislatures and TANF agencies will once again be working under tight fiscal conditions when they develop their budgets for 2013. TANF's block grant structure, with broad state flexibility, makes it an attractive revenue source for filling funding gaps for a broad range of state programs that do not have a dedicated funding source — and it offers no protection for state cash assistance programs. Therefore, the cuts that six states made to benefit levels in 2011 may be followed by larger, more damaging changes in 2012.
| Appendix 1: TANF Benefit Levels as of July 2011 (Single-Parent Family of Three) | ||||||
| July 1996 | July 2000 | July 2005 | July 2010 | July 2011 | Change from 1996-2011 (in inflation adjusted dollars) | |
| Alabama | 164 | 164 | 215 | 215 | 215 | -8.0% |
| Alaska | 923 | 923 | 923 | 923 | 923 | -29.8% |
| Arizona | 347 | 347 | 347 | 278 | 278 | -43.8% |
| Arkansas | 204 | 204 | 204 | 204 | 204 | -29.8% |
| California | 596 | 626 | 723 | 694 | 6381 | -24.8% |
| Colorado | 356 | 356 | 356 | 462 | 4622 | -8.9% |
| Connecticut | 636 | 636 | 636 | 674 | 6743 | -25.6% |
| Delaware | 338 | 338 | 338 | 416 | 3384 | -29.8% |
| D.C. | 415 | 379 | 379 | 428 | 4285 | -27.6% |
| Florida | 303 | 303 | 303 | 303 | 303 | -29.8% |
| Georgia | 280 | 280 | 280 | 280 | 280 | -29.8% |
| Hawaii | 712 | 570 | 570 | 610 | 6106 | -39.8% |
| Idaho | 317 | 293 | 309 | 309 | 309 | -31.6% |
| Illinois | 377 | 377 | 396 | 432 | 4327 | -19.5% |
| Indiana | 288 | 288 | 288 | 288 | 288 | -29.8% |
| Iowa | 426 | 426 | 426 | 426 | 426 | -29.8% |
| Kansas | 429 | 429 | 429 | 429 | 429 | -29.8% |
| Kentucky | 262 | 262 | 262 | 262 | 262 | -29.8% |
| Louisiana | 190 | 190 | 240 | 240 | 240 | -11.3% |
| Maine | 418 | 461 | 485 | 485 | 485 | -18.5% |
| Maryland | 373 | 417 | 482 | 574 | 5748 | 8.0% |
| Massachusetts | 565 | 565 | 618 | 618 | 618 | -23.2% |
| Michigan | 459 | 459 | 459 | 492 | 492 | -24.7% |
| Minnesota | 532 | 532 | 532 | 532 | 532 | -29.8% |
| Mississippi | 120 | 170 | 170 | 170 | 170 | -0.5% |
| Missouri | 292 | 292 | 292 | 292 | 292 | -29.8% |
| Montana | 438 | 469 | 405 | 504 | 504 | -19.2% |
| Nebraska | 364 | 364 | 364 | 364 | 364 | -29.8% |
| Nevada | 348 | 348 | 348 | 383 | 383 | -22.7% |
| New Hampshire | 550 | 575 | 625 | 675 | 675 | -13.8% |
| New Jersey | 424 | 424 | 424 | 424 | 424 | -29.8% |
| New Mexico | 389 | 439 | 389 | 447 | 3809 | -31.4% |
| New York | 577 | 577 | 691 | 753 | 75310 | -8.4% |
| North Carolina | 272 | 272 | 272 | 272 | 272 | -29.8% |
| North Dakota | 431 | 457 | 477 | 477 | 477 | -22.3% |
| Ohio | 341 | 373 | 373 | 434 | 434 | -10.6% |
| Oklahoma | 307 | 292 | 292 | 292 | 292 | -33.2% |
| Oregon | 460 | 460 | 460 | 485 | 50611 | -22.8% |
| Pennsylvania | 421 | 421 | 421 | 421 | 421 | -29.8% |
| Rhode Island | 554 | 554 | 554 | 554 | 554 | -29.8% |
| South Carolina | 200 | 204 | 205 | 270 | 21612 | -24.2% |
| South Dakota | 430 | 430 | 501 | 555 | 555 | -9.4% |
| Tennessee | 185 | 185 | 185 | 185 | 185 | -29.8% |
| Texas | 188 | 201 | 223 | 260 | 26013 | -2.9% |
| Utah | 416 | 451 | 474 | 498 | 498 | -16.0% |
| Vermont | 597 | 622 | 640 | 640 | 64014 | -24.7% |
| Virginia | 354 | 354 | 389 | 389 | 389 | -22.8% |
| Washington | 546 | 546 | 546 | 562 | 47815 | -38.5% |
| West Virginia | 253 | 328 | 340 | 340 | 340 | -5.6% |
| Wisconsin | 517 | 673 | 673 | 673 | 67316 | -8.6% |
| Wyoming | 360 | 340 | 340 | 561 | 57717 | 12.5% |
| 1 California benefit level cut was effective July 1, 2011. California has two regional variations in benefit levels; the number used here represents the higher benefit level. 2 Last year we cited Colorado's benefit level as being $467. This was incorrect. The benefit level was $462 in 2010 and remains so in 2011. 3 This number is for Region A, which covers the highest cost area of the state. Most families of three in CT receive a maximum benefit of $576 a month. 4 Delaware instituted a temporary TANF benefit increase from $338 to $416 monthly for a family of three, effective November 2009. The temporary increase was funded with TANF Emergency Funds. The increase ended on September 30, 2010. On October 1, 2010, the TANF benefit reverted to $338 for a family of three. 5 The District of Columbia cut benefits by 20 percent effective April 1, 2011 for families that have received assistance for 60 months or longer. A family of three subject to the decrease will see its benefit cut from $428 to $342. 6 Hawaii has a two-tiered system of benefit levels — a lower benefit level for families that are required to participate in work activities and a higher level for families that are exempt from work activities. As of July 1, 2010, benefits for a family of three are $610 (work-required families) and $763 (work-exempt families), respectively. 7 This is the benefit level for most of the state of Illinois; the benefit levels are lower in the southern part of the state compared to the central part of the state. 8 Maryland did not have its annual increase based on inflation this year. 9 New Mexico's benefit level cut was effective January 1, 2011. 10 The listed benefit level is for New York City. As of July 2011 for a family of three, New York's benefit is made up of a $300 statewide monthly basic allowance (for recurring needs), $30 statewide home energy allowance, $23 statewide supplemental home energy allowance and then the portion for rent which varies from $259 - $447 depending on the county of residence. There is a statutory grant increase scheduled for July, 2012. The grant for recurring needs for a family of three will go up $35 a month on July 1, 2012. It was actually scheduled for July 1, 2011, but the Governor amended the statute to defer the grant increase as part of FY 2012's budget. 11 The cooperation incentive ended on Sept 30, 2010, but the grant level was increased to make up for some of that loss. 12 Pennsylvania's benefit levels vary by county. The listed number is the highest, not the most typical, benefit level. 13 Texas' monthly cash grant is adjusted annually according to the federal poverty level. While there had been no increase between July 2009 and July 2011, a slight benefit increase was effective October 1, 2011; benefits for a family of three increased from $260 to $263 per month. Appendix 1a reflects TANF benefit levels as of July 1, 2011. 14 Vermont has two regional benefit levels, a higher one for Chittenden County and a lower one for the rest of the state. In the 2008 version of this paper, CBPP used the benefit levels cited in Congressional Research Service reports, which are for Chittenden County and include a housing supplement. In this version of the report, we list the benefit level for outside Chittenden County and do not add the housing supplement; we also have changed the historic benefit levels listed here to correspond to the circumstances of the benefit levels we use for 2010. The source of the historic benefit levels is the Urban Institute Welfare Rules Database. 15 Washington State's benefit level cut was effective February 1, 2011. 16 Wisconsin is reducing benefits for some categories of recipients effective October 1, 2011. For example, the $673 listed here for those in Community Service Jobs was reduced to $653 in October 1, 2011. Some categories of W-2 recipients (caretakers of newborns and pregnant women with at-risk pregnancies and no other children in their care) will remain at $673. 17 Wyoming's benefit level increase was effective July 1, 2011. Sources: Congressional Research Service Reports "TANF Cash Benefits as of January 1, 2004" (data for 1996 and 2000) and "The Temporary Assistance for Needy Families (TANF) Block Grant: Responses to Frequently Asked Questions" (data for 2005) (except for Vermont, as noted in footnote 14). Data for 2008, 2010, and 2011 were compiled by CBPP from various sources. | ||||||
| Appendix 2: TANF Benefit Levels as a Percentage of the Federal Poverty Line | ||
| State | 1996 | 2011 |
| Alabama | 15.2% | 13.9% |
| Alaska | 68.3% | 47.8% |
| Arizona | 32.1% | 18.0% |
| Arkansas | 18.9% | 13.2% |
| California | 55.1% | 41.3% |
| Colorado | 32.9% | 29.9% |
| Connecticut | 58.8% | 43.6% |
| Delaware | 31.2% | 21.9% |
| D.C. | 38.4% | 27.7% |
| Florida | 28.0% | 19.6% |
| Georgia | 25.9% | 18.1% |
| Hawaii | 57.2% | 34.3% |
| Idaho | 29.3% | 20.0% |
| Illinois | 34.9% | 28.0% |
| Indiana | 26.6% | 18.7% |
| Iowa | 39.4% | 27.6% |
| Kansas | 39.7% | 27.8% |
| Kentucky | 24.2% | 17.0% |
| Louisiana | 17.6% | 15.5% |
| Maine | 38.6% | 31.4% |
| Maryland | 34.5% | 37.2% |
| Massachusetts | 52.2% | 40.0% |
| Michigan | 42.4% | 31.9% |
| Minnesota | 49.2% | 34.5% |
| Mississippi | 11.1% | 11.0% |
| Missouri | 27.0% | 18.9% |
| Montana | 40.5% | 32.6% |
| Nebraska | 33.7% | 23.6% |
| Nevada | 32.2% | 24.8% |
| New Hampshire | 50.8% | 43.7% |
| New Jersey | 39.2% | 27.5% |
| New Mexico | 36.0% | 24.6% |
| New York | 53.3% | 48.8% |
| North Carolina | 25.1% | 17.6% |
| North Dakota | 39.8% | 30.9% |
| Ohio | 31.5% | 28.1% |
| Oklahoma | 28.4% | 18.9% |
| Oregon | 42.5% | 32.8% |
| Pennsylvania | 38.9% | 27.3% |
| Rhode Island | 51.2% | 35.9% |
| South Carolina | 18.5% | 14.0% |
| South Dakota | 39.8% | 35.9% |
| Tennessee | 17.1% | 12.0% |
| Texas | 17.4% | 16.8% |
| Utah | 38.5% | 32.3% |
| Vermont | 58.5% | 41.4% |
| Virginia | 32.7% | 25.2% |
| Washington | 50.5% | 31.0% |
| West Virginia | 23.4% | 22.0% |
| Wisconsin | 47.8% | 43.6% |
| Wyoming | 33.3% | 37.4% |
| Source: 2011 HHS Poverty Guidelines for a family of three at http://aspe.hhs.gov/poverty/11poverty.shtml TANF benefit levels for a single-parent family of three were compiled by CBPP from various sources and are current as of July 1, 2011. | ||
| Appendix 3: Changes in Real (Inflation-Adjusted) Benefit Levels Comparing 2011 to 1996, 2000, 2005, and 2010 | ||||
| State | 1996-2011 | 2000-2011 | 2005-2011 | 2010-2011 |
| Alabama | -8.0% | 0.5% | -13.2% | -2.4% |
| Alaska | -29.8% | -23.3% | -13.2% | -2.4% |
| Arizona | -43.8% | -38.6% | -30.4% | -2.1% |
| Arkansas | -29.8% | -23.3% | -13.2% | -2.4% |
| California | -24.8% | -21.9% | -23.4% | -10.3% |
| Colorado | -8.9% | -0.5% | 12.7% | -2.4% |
| Connecticut | -25.6% | -18.8% | -8.0% | -2.4% |
| Delaware | -29.8% | -23.3% | -13.2% | -20.7% |
| D.C. | -27.6% | -13.4% | -1.9% | -2.4% |
| Florida | -29.8% | -23.3% | -13.2% | -2.4% |
| Georgia | -29.8% | -23.3% | -13.2% | -2.4% |
| Hawaii | -39.8% | -18.0% | -7.1% | -2.4% |
| Idaho | -31.6% | -19.2% | -13.2% | -2.4% |
| Illinois | -19.5% | -12.2% | -5.3% | -2.4% |
| Indiana | -29.8% | -23.3% | -13.2% | -2.4% |
| Iowa | -29.8% | -23.3% | -13.2% | -2.4% |
| Kansas | -29.8% | -23.3% | -13.2% | -2.4% |
| Kentucky | -29.8% | -23.3% | -13.2% | -2.4% |
| Louisiana | -11.3% | -3.2% | -13.2% | -2.4% |
| Maine | -18.5% | -19.4% | -13.2% | -2.4% |
| Maryland | 8.0% | 5.5% | 3.4% | -2.4% |
| Massachusetts | -23.2% | -16.2% | -13.2% | -2.4% |
| Michigan | -24.7% | -17.8% | -6.9% | -2.4% |
| Minnesota | -29.8% | -23.3% | -13.2% | -2.4% |
| Mississippi | -0.5% | -23.3% | -13.2% | -2.4% |
| Missouri | -29.8% | -23.3% | -13.2% | -2.4% |
| Montana | -19.2% | -17.6% | 8.1% | -2.4% |
| Nebraska | -29.8% | -23.3% | -13.2% | -2.4% |
| Nevada | -22.7% | -15.6% | -4.4% | -2.4% |
| New Hampshire | -13.8% | -10.0% | -6.2% | -2.4% |
| New Jersey | -29.8% | -23.3% | -13.2% | -2.4% |
| New Mexico | -31.4% | -33.6% | -15.2% | -17.1% |
| New York | -8.4% | 0.0% | -5.4% | -2.4% |
| North Carolina | -29.8% | -23.3% | -13.2% | -2.4% |
| North Dakota | -22.3% | -20.0% | -13.2% | -2.4% |
| Ohio | -10.6% | -10.8% | 1.0% | -2.4% |
| Oklahoma | -33.2% | -23.3% | -13.2% | -2.4% |
| Oregon | -22.8% | -15.7% | -4.5% | 1.8% |
| Pennsylvania | -29.8% | -23.3% | -13.2% | -2.4% |
| Rhode Island | -29.8% | -23.3% | -13.2% | -2.4% |
| South Carolina | -24.2% | -18.8% | -8.5% | -22.0% |
| South Dakota | -9.4% | -1.1% | -3.8% | -2.4% |
| Tennessee | -29.8% | -23.3% | -13.2% | -2.4% |
| Texas | -2.9% | -0.8% | 1.2% | -2.4% |
| Utah | -16.0% | -15.4% | -8.8% | -2.4% |
| Vermont | -24.7% | -21.1% | -13.2% | -2.4% |
| Virginia | -22.8% | -15.8% | -13.2% | -2.4% |
| Washington | -38.5% | -32.9% | -24.0% | -17.0% |
| West Virginia | -5.6% | -20.5% | -13.2% | -2.4% |
| Wisconsin | -8.6% | -23.3% | -13.2% | -2.4% |
| Wyoming | 12.5% | 30.1% | 47.4% | 0.3% |
| Source: Calculated from figures in Appendix 1 adjusted for inflation using the Consumer Price Index (CPI); Out of Reach, by the National Low-income Housing Coalition for 2000 and 2011, available at http://www.nlihc.org/oor/oor2011/. NLIHC creates weighted statewide average Fair Market Rent for various-sized apartments based on HUD Fair Market Rents for various sub-regions in the state. The numbers used here are for a two-bedroom apartment. TANF 2010 benefit levels for single-parent families of three were compiled by CBPP from various sources and are current as of July 1, 2011. | ||||
| Appendix 4: TANF Benefit Levels as a Percentage of Fair Market Rents Comparing 2000 and 2011 | ||
| State | 2000 | 2011 |
| Alabama | 36.6% | 32.4% |
| Alaska | 117.0% | 88.3% |
| Arizona | 55.8% | 30.7% |
| Arkansas | 47.4% | 33.1% |
| California | 79.1% | 46.9% |
| Colorado | 55.5% | 50.0% |
| Connecticut | 78.0% | 55.5% |
| Delaware | 51.4% | 34.7% |
| D.C. | 43.9% | 29.3% |
| Florida | 47.8% | 29.5% |
| Georgia | 48.4% | 36.5% |
| Hawaii | 66.4% | 37.7% |
| Idaho | 60.9% | 45.2% |
| Illinois | 56.7% | 47.8% |
| Indiana | 54.1% | 40.4% |
| Iowa | 90.1% | 65.7% |
| Kansas | 88.8% | 62.7% |
| Kentucky | 58.2% | 41.3% |
| Louisiana | 40.5% | 31.0% |
| Maine | 81.9% | 57.6% |
| Maryland | 59.7% | 44.6% |
| Massachusetts | 66.2% | 51.1% |
| Michigan | 77.9% | 66.0% |
| Minnesota | 88.5% | 64.8% |
| Mississippi | 40.0% | 24.7% |
| Missouri | 62.3% | 41.2% |
| Montana | 95.5% | 73.4% |
| Nebraska | 73.2% | 54.8% |
| Nevada | 50.0% | 37.7% |
| New Hampshire | 78.1% | 65.7% |
| New Jersey | 48.3% | 33.2% |
| New Mexico | 84.1% | 53.1% |
| New York | 69.2% | 59.4% |
| North Carolina | 51.5% | 37.9% |
| North Dakota | 97.9% | 79.6% |
| Ohio | 69.7% | 61.6% |
| Oklahoma | 65.2% | 44.9% |
| Oregon | 75.8% | 61.6% |
| Pennsylvania | 72.0% | 50.3% |
| Rhode Island | 86.8% | 55.6% |
| South Carolina | 41.1% | 30.9% |
| South Dakota | 86.9% | 89.5% |
| Tennessee | 37.1% | 26.4% |
| Texas | 34.7% | 31.3% |
| Utah | 74.2% | 64.8% |
| Vermont | 100.5% | 64.6% |
| Virginia | 56.5% | 38.1% |
| Washington | 83.2% | 48.1% |
| West Virginia | 77.7% | 57.8% |
| Wisconsin | 122.1% | 88.1% |
| Wyoming | 69.4% | 82.1% |
| Source: Out of Reach, by the National Low-income Housing Coalition for 2000 and 2011, available at http://www.nlihc.org/oor/oor2011/. NLIHC creates weighted statewide average Fair Market Rents for various-sized apartments based on HUD Fair Market Rents for various sub-regions in the state. The numbers used here are for a two-bedroom apartment. TANF 2011 benefit levels for single-parent families of three were compiled by CBPP from various state sources and are current as of July 1, 2011. | ||
| Appendix 5: 2011 TANF and SNAP Benefit Levels as a Percentage of the Federal Poverty Line | ||
| State | TANF as a Percent of FPL | SNAP + TANF as a Percent of FPL |
| Alabama | 13.9% | 48% |
| Alaska | 47.8% | 83% |
| Arizona | 18.0% | 52% |
| Arkansas | 13.2% | 47% |
| California | 41.3% | 73% |
| Colorado | 29.9% | 64% |
| Connecticut | 43.6% | 76% |
| Delaware | 21.9% | 56% |
| DC | 27.7% | 60% |
| Florida | 19.6% | 54% |
| Georgia | 18.1% | 52% |
| Hawaii | 34.3% | 74% |
| Idaho | 20.0% | 54% |
| Illinois | 28.0% | 61% |
| Indiana | 18.7% | 53% |
| Iowa | 27.6% | 62% |
| Kansas | 27.8% | 62% |
| Kentucky | 17.0% | 51% |
| Louisiana | 15.5% | 50% |
| Maine | 31.4% | 65% |
| Maryland | 37.2% | 67% |
| Massachusetts | 40.0% | 74% |
| Michigan | 31.9% | 66% |
| Minnesota | 34.5% | 61% |
| Mississippi | 11.0% | 45% |
| Missouri | 18.9% | 53% |
| Montana | 32.6% | 67% |
| Nebraska | 23.6% | 58% |
| Nevada | 24.8% | 59% |
| New Hampshire | 43.7% | 76% |
| New Jersey | 27.5% | 62% |
| New Mexico | 24.6% | 59% |
| New York | 48.8% | 80% |
| North Carolina | 17.6% | 52% |
| North Dakota | 30.9% | 65% |
| Ohio | 28.1% | 62% |
| Oklahoma | 18.9% | 53% |
| Oregon | 32.8% | 67% |
| Pennsylvania | 27.3% | 61% |
| Rhode Island | 35.9% | 70% |
| South Carolina | 14.0% | 48% |
| South Dakota | 35.9% | 70% |
| Tennessee | 12.0% | 46% |
| Texas | 16.8% | 51% |
| Utah | 32.3% | 63% |
| Vermont | 41.4% | 75% |
| Virginia | 25.2% | 59% |
| Washington | 31.0% | 65% |
| West Virginia | 22.0% | 56% |
| Wisconsin | 43.6% | 75% |
| Wyoming | 37.4% | 66% |
| Sources: 2011 HHS Poverty Guidelines for a family of three at http://aspe.hhs.gov/poverty/11poverty.shtml. TANF benefit levels for a single-parent family of three were compiled by CBPP from various sources and are current as of July 1, 2011. The estimated SNAP benefits were calculated by CBPP in accordance with USDA Food and Nutrition Service policies using the circumstances of a family of three with a full TANF grant (and no other income) and with median shelter costs for families with income below 80 percent of the federal poverty line. | ||
End Notes
[1] Three states increased benefits in 2011, but, in two of these states, benefit levels have still not kept up with inflation over the past 15 years.
[2] LaDonna Pavetti, Ph.D., Danilo Trisi, and Liz Schott, "TANF Responded Unevenly to Increase in Need During Downturn," Center on Budget and Policy Priorities, January 25, 2011, https://www.cbpp.org/cms/index.cfm?fa=view&id=3379.
[3] CBPP collected the TANF benefit level for each state as of July 2011. The data in the Appendix reflects the July 2011 benefit levels. However, in our discussion, we highlight changes made to benefit levels since July 2010, which include changes made in October 2011.
[4] The TANF Emergency Contingency Fund helped many states sustain — and, in a few cases, increase — their TANF benefit levels during 2009 and 2010. However, this additional funding ended September 2010.
[5] Oregon increased benefits effective October 1, 2010 to partially make up for the expiration of a supplemental "cooperation incentive" payment; some families ended up with a net reduction in benefits. Texas increased benefits effective October 1, 2011; Wyoming increased benefits effective July 1, 2011.
[6] The 2011 FPL for a family of three is $1,544 per month; Alaska and Hawaii have higher poverty levels (see http://aspe.hhs.gov/poverty/11poverty.shtml).
[7] The 14 states with benefit levels less than $300 for a family of three are: Alabama, Arizona, Arkansas, Georgia, Indiana, Kentucky, Louisiana, Mississippi, Missouri, North Carolina, Oklahoma, South Carolina, Tennessee, and Texas.
[8] 1996 Green Book , U.S. House of Representatives Ways and Means Committee, Table 8-15, http://frwebgate.access.gpo.gov/cgi-bin/getdoc.cgi?dbname=104_green_book&docid=f:wm014_08.pdf .
[9] Worst Case Housing Needs 2009: A Report to Congress , U.S. Department of Housing and Urban Development Office of Policy Development and Research, February 2011.
[10] Temporary Assistance for Needy Families (TANF) Eighth Annual Report to Congress . US Department of Health and Human Services, Office of Family Assistance, June 2009, http://www.acf.hhs.gov/programs/ofa/data-reports/annualreport8/chapter10/chap10.htm .
[11] Characteristics of Supplemental Nutrition Assistance Program Households: Fiscal Year 2010 , US Department of Agriculture Office of Research and Analysis, September 2010, http://www.fns.usda.gov/ora/menu/Published/SNAP/FILES/Participation/2010Characteristics.pdf .
[12] For Figure 5, CBPP calculated typical SNAP benefits assuming that a family's shelter costs are the same as the median shelter costs for families with incomes at or below 80 percent of the poverty line. A family's SNAP benefit amount is calculated based on its income and deductions, with the capped deduction for high shelter costs playing a significant role. For over half of the states, the estimated SNAP benefit used in Figure 5 is the maximum monthly benefit for a family of three ($526). The SNAP benefit that an individual TANF family actually qualifies for, based on its particular circumstances often is lower, however, than the estimate used here, because many TANF households do not incur shelter expenses high enough to qualify them for the maximum SNAP benefit.
[13] Elizabeth McNichol, Phil Oliff, and Nicholas Johnson, "States Continue to Feel Recession's Impact," Center on Budget and Policy Priorities, June 17, 2011, https://www.cbpp.org/cms/index.cfm?fa=view&id=711.
[14] Elizabeth McNichol, "Economic Recovery Unlikely to Lift State Revenues out of Deep Hole," Center on Budget and Policy Priorities, November 11, 2011, http://www.offthechartsblog.org/economic-recovery-unlikely-to-lift-state-revenues-out-of-deep-hole/ .
More from the Authors

Areas of Expertise