Economic Downturn and Bush Policies Continue to Drive Large Projected Deficits
Economic Recovery Measures, Financial Rescues Have Only Temporary Impact
We have since updated this paper. To view the new paper, click here.
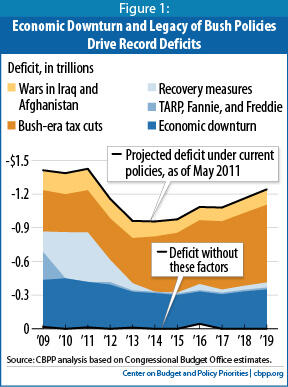
Some lawmakers, pundits, and others continue to say that President George W. Bush’s policies did not drive the projected federal deficits of the coming decade — that, instead, it was the policies of President Obama and Congress in 2009 and 2010. But, the fact remains: the economic downturn, President Bush’s tax cuts and the wars in Afghanistan and Iraq explain virtually the entire deficit over the next ten years (see Figure 1).
The deficit for fiscal year 2009 — which began more than three months before President Obama’s inauguration — was $1.4 trillion and, at 10 percent of Gross Domestic Product (GDP), the largest deficit relative to the economy since the end of World War II. At $1.3 trillion and nearly 9 percent of GDP, the deficit in 2010 was only slightly lower. If current policies remain in place, deficits will likely resemble those figures in 2011 and hover near $1 trillion a year for the next decade.
The events and policies that pushed deficits to these high levels in the near term were, for the most part, not of President Obama’s making. If not for the Bush tax cuts, the deficit-financed wars in Iraq and Afghanistan, and the effects of the worst recession since the Great Depression (including the cost of policymakers’ actions to combat it), we would not be facing these huge deficits in the near term. By themselves, in fact, the Bush tax cuts and the wars in Iraq and Afghanistan will account for almost half of the $20 trillion in debt that, under current policies, the nation will owe by 2019. The stimulus law and financial rescues will account for less than 10 percent of the debt at that time.
Having said that, policymakers should not mistake the causes of the swollen deficits that we face in the decade ahead — nor make policy based on mistaken impressions.
Recession Caused Sharp Deterioration in Budget Outlook
Whoever won the presidency in 2008 was going to face a grim fiscal situation, a fact already well known as the presidential campaign got underway. The Congressional Budget Office (CBO) presented a sobering outlook in its 2008 summer update,[1] and during the autumn, the news got relentlessly worse. Fannie Mae and Freddie Mac, the two government-sponsored enterprises (GSEs) that became embroiled in the housing meltdown, failed in early September; two big financial firms — AIG and Lehman Brothers — collapsed soon thereafter; and others teetered. In December 2008, the National Bureau of Economic Research confirmed that the nation was in recession and pegged the starting date as December 2007. By the time CBO issued its new projections on January 7, 2009 — two weeks before Inauguration Day — it had already put the 2009 deficit at well over $1 trillion.[2]
The recession battered the budget, driving down tax revenues and swelling outlays for unemployment insurance, food stamps, and other safety-net programs.[3] Using CBO’s August 2008 projections as a benchmark, we calculate that the changed economic outlook alone accounts for over $400 billion of the deficit each year in 2009 through 2011 and slightly smaller amounts in subsequent years. Those effects persist; even in 2018, the deterioration in the economy since the summer of 2008 will account for over $300 billion in added deficits, much of it in the form of additional debt-service costs.
Financial Rescues, Stimulus Added to Deficits in Near Term
The government put Fannie Mae and Freddie Mac into conservatorship in September 2008.[4] In October of that year, the Bush Administration and Congress enacted a rescue package to stabilize the financial system by creating the Troubled Asset Relief Program (TARP). Together, TARP and the GSEs accounted for almost $250 billion (including extra debt-service costs) of fiscal year 2009’s record deficit. Their contribution to deficits then fades quickly, however (see Figure 1).
In February 2009, the new Obama Administration and Congress enacted a major package — the American Recovery and Reinvestment Act (ARRA) — to arrest the economy’s plunge. Mainstream economists overwhelmingly argued that to combat the recession, the federal government should loosen its purse strings temporarily to spur demand, with a mix of assistance to the unemployed, aid to strapped state and local governments, tax cuts, spending on infrastructure, and other measures. By design, this package added to the deficit. Since then, policymakers have enacted several other measures — including tax cuts for businesses, modest additional temporary aid to states, a partial payroll-tax holiday for workers, and further extensions of unemployment benefits — to spur recovery and aid the unemployed.[5] By our reckoning, the combination of ARRA and these other measures account for $1.4 trillion of the nearly $13 trillion in deficits over the 2009-2019 period (including the associated debt service costs). Their effects are highly concentrated in 2009 through 2011 and fade thereafter, delivering a boost to the economy during its most vulnerable period.[6]
Tax Cuts, War Costs Do Lasting Harm to Budget Outlook
Some commentators blame major legislation adopted in 2008-2010 — the stimulus bill and other recovery measures and the financial rescues — for today’s record deficits. Yet those costs pale next to other policies enacted since 2001 that have swollen the deficit. Those other policies may be less conspicuous now, because many were enacted some years ago and they have long since been absorbed into CBO’s and other organizations’ budget projections.
Just two policies dating from the Bush Administration — tax cuts and the wars in Iraq and Afghanistan — accounted for over $500 billion of the deficit in 2009 and will account for $7 trillion in deficits in 2009 through 2019, including the associated debt-service costs. [7] By 2019, we estimate that these two policies will account for almost half — nearly $10 trillion — of the $20 trillion in debt that will be owed under current policies.[8] (The Medicare prescription drug benefit enacted in 2003 also will substantially increase deficits and debt, but we are unable to quantify these impacts due to data limitations.) These impacts easily dwarf the stimulus and financial rescues, which will account for less than $2 trillion (less than 10 percent) of the debt at that time. Furthermore, unlike those temporary costs, these inherited policies (especially the tax cuts and the drug benefit) do not fade away as the economy recovers.
Without the economic downturn and the fiscal policies of the previous Administration, the budget would be roughly in balance over the next decade. That would have put the nation on a much sounder footing to address the demographic challenges and the cost pressures in health care that darken the long-run fiscal outlook.[9]
A Simple Step to Stabilize the Fiscal Outlook
The key question is: where do we go from here? It’s too late to undo the damage caused by the tax cuts and wars over the last decade, which have left us with a large overhang of debt. (In fact, that debt legacy — and the resulting interest costs — are a key reason, along with an aging population and rising health-care costs, that it’s unrealistic and ill-advised to restrict total federal spending to the average outlay levels that prevailed over the 1970-2008 period, as some have proposed.[10]) But it’s feasible to enact measures now — to take effect once the economy has recovered more fully — that would put the budget on a sustainable path without jeopardizing the economic recovery.
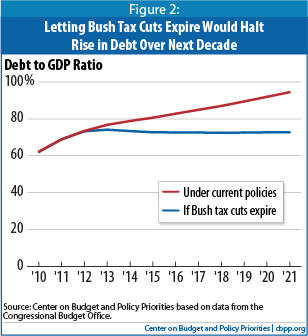
The most pressing need is to arrest the relentless rise in the ratio of federal debt to GDP. One simple way to make significant progress toward that goal would be to let the 2001 and 2003 tax cuts expire after 2012.[11]
Congress should either let these tax cuts lapse when they are scheduled to expire — for everybody, not just for people with incomes over $200,000 for an individual or $250,000 for a couple — or pay for those portions it wishes to extend. (It would, in fact, be desirable to continue some elements of the tax cuts, while offsetting their cost.) The economy should have recovered sufficiently by the end of 2012 to absorb the reduction in purchasing power. By that one simple step, Congress would put deficits and debt on a sustainable path for the next decade, as Figure 2 shows.
Any changes in eligibility or benefits in Medicare and Social Security will need to be designed carefully and phased in gradually, with ample notice to workers and recipients. Letting the Bush tax cuts lapse would stabilize the debt quickly and give policymakers time to get the rest of the job done right.
Technical Note
Baseline projections depict the likely path of the federal budget if current policies remain unchanged. We base our estimates on CBO’s latest ten-year projections, published in March 2011, with several adjustments to reflect what will happen if current tax and spending policies continue (see Table 1).
Specifically, our baseline includes the budgetary effects of continuing the tax cuts — originally enacted in the George W. Bush administration and extended in December 2010 — that are scheduled to expire after 2012 (including tax cuts for upper-income taxpayers), renewing other so-called “tax extenders” such as the research and development tax credit, and continuing relief from the Alternative Minimum Tax (AMT). Our baseline also assumes the effects of continuing to defer scheduled cuts in payments for Medicare providers (including a 28 percent reduction scheduled for 2012), as has routinely occurred in recent years, and instead freezing reimbursements at today’s rates. We also account for a gradual phase-down of operations in Iraq and Afghanistan. In all cases we based our adjustments on estimates published by CBO.[12]
| TABLE 1: Projected Deficits Under Current Policies and Selected Components (By fiscal year, in billions of dollars; details may not add to totals due to rounding) | ||||||||||||||
| 2009 | 2010 | 2011 | 2012 | 2013 | 2014 | 2015 | 2016 | 2017 | 2018 | 2019 | 2001-2008 | 2009-2019 | ||
| Projected Deficits Under Current Policiesa | ||||||||||||||
| CBO baseline | 1,413 | 1,294 | 1,399 | 1,081 | 692 | 513 | 538 | 635 | 590 | 585 | 665 | 2,006 | 9,404 | |
| Extend tax cutsb | 0 | 0 | 0 | 14 | 195 | 358 | 376 | 374 | 377 | 380 | 386 | 0 | 2,461 | |
| Continue AMT reliefc | 0 | 0 | 0 | 9 | 105 | 99 | 110 | 123 | 138 | 154 | 173 | 0 | 912 | |
| Cancel scheduled physician-fee cutsd | 0 | 0 | 0 | 12 | 19 | 19 | 21 | 24 | 25 | 28 | 31 | 0 | 179 | |
| Adjust for phase-down in Iraq and Afghanistane | 0 | 0 | 0 | -21 | -54 | -87 | -113 | -129 | -137 | -142 | -147 | 0 | -830 | |
| Additional debt service | 0 | 0 | 0 | * | 5 | 17 | 36 | 57 | 81 | 107 | 135 | 0 | 439 | |
| Total adjustments | 0 | 0 | 0 | 15 | 270 | 407 | 430 | 449 | 484 | 527 | 578 | 0 | 3,161 | |
| CBPP baseline | 1,413 | 1,294 | 1,399 | 1,095 | 962 | 921 | 968 | 1,084 | 1,075 | 1,112 | 1,243 | 2,006 | 12,565 | |
| Selected Componentsf | ||||||||||||||
| Economic downturn | 418 | 449 | 404 | 393 | 318 | 317 | 300 | 287 | 307 | 332 | n.a. | 0 | n.a. | |
| TARP, Fannie, and Freddie | 249 | -66 | -26 | 22 | 13 | 12 | 13 | 13 | 14 | 15 | 17 | 0 | 276 | |
| ARRA | 182 | 318 | 172 | 61 | 53 | 38 | 34 | 35 | 36 | 38 | 48 | 0 | 1,015 | |
| Other recovery measures | 0 | 93 | 270 | 137 | 11 | -66 | -25 | 19 | -8 | -2 | -2 | 0 | 426 | |
| Bush-era tax cuts | 368 | 338 | 375 | 370 | 402 | 493 | 532 | 569 | 608 | 649 | 692 | 1,943 | 5,396 | |
| War costs | 178 | 188 | 191 | 175 | 153 | 134 | 121 | 118 | 123 | 130 | 138 | 674 | 1,648 | |
| Source: CBPP calculations based on data from CBO. a. Congressional Budget Office, An Analysis of the President’s Budgetary Proposals for Fiscal Year 2012, April 2011, Table 1-5; The Budget and Economic Outlook, January 2011, Table 1-7. b. Assumes continuation of all income-tax and estate and gift tax provisions scheduled to expire on December 31, 2012, as well as other expiring tax provisions. c. Assumes indexation of AMT thresholds for inflation. Includes interaction with assumed extension of expiring tax cuts. d. Assumes that Medicare’s physician payment rates are maintained at 2011 levels. e. Assumes reduction to 45,000 troops by 2015. f. All components include the associated debt-service costs. Note: CBO=Congressional Budget Office; AMT=Alternative Minimum Tax; TARP=Troubled Asset Relief Program; Fannie and Freddie=Fannie Mae and Freddie Mac. *denotes less than $500 million. “n.a.” denotes not available. | ||||||||||||||
We calculated major components of the deficits as follows:
- Economic downturn — This category includes all changes in the deficit that CBO has labeled “economic” in the numerous reports [13] that it has issued since September 2008, which total $1.3 trillion over the 2009-2018 period. It also includes the bulk of revenue changes that CBO has classified as “technical.” In the revenue area, so-called technical changes essentially refer to trends in revenue collections that CBO’s analysts cannot tie directly to published macroeconomic data. (Those data become available with a lag and are subject to major revision; weak revenues are often a tipoff that the economy is worse than the official statistics suggest. Furthermore, some key determinants of revenues — such as capital gains on stock-market transactions — are tied to the economy, but those influences are not captured by the standard macroeconomic indicators.) Because the economic-versus-technical distinction is somewhat arbitrary for revenues, we have ascribed most of CBO’s large, downward “technical” reestimates of revenues to the economic downturn. We add the associated debt-service costs. The technical reestimates to revenues and the associated debt-service costs add $1.8 trillion and $0.4 trillion, respectively, to this category over the 2009-2018 period.
Combined, the factors that we ascribe to the economic downturn account for $3.5 trillion in extra deficits in 2009 through 2018. [14] - TARP, Fannie, and Freddie — The Treasury spent $247 billion for these entities in 2009 ($151 billion for TARP and $96 billion for purchases of stock in Fannie Mae and Freddie Mac). In 2010, TARP actually reduced the deficit — by $110 billion — while Fannie and Freddie cost $40 billion. Projections for 2011 through 2021 come from CBO’s March 2011 baseline. We computed the additional debt-service costs, which total $75 billion over the 2009-2019 period. (By 2014, virtually the entire cost shown in Table 1 represents debt-service costs.)
- Recovery measures — When ARRA was passed, it bore a “headline” cost of $787 billion as officially estimated by CBO. [15] In January 2011, CBO revised that figure to $821 billion, chiefly to reflect higher costs due to such economic variables as the unemployment rate and food prices, partially offset by rescissions and other legislation curtailing ARRA’s original provisions.[16] We removed the portion of ARRA costs ascribed to indexing the AMT for another year.[17] Annual AMT “patches” have been a fixture since 2001, and ARRA just happened to provide the vehicle. The AMT provision accounted for $70 billion of ARRA’s $821 billion cost, leaving $751 billion. CBPP then added the cost of several smaller, discrete recovery measures that were enacted in late 2009 and 2010, totaling $317 billion in the 2010-2019 period (heavily concentrated in 2010 through 2012). These measures include:
- Laws enacted in late 2009 to extend tax carryback provisions for businesses, the first-time homebuyer tax credit, and COBRA tax subsidies for unemployed workers (P.L. 111-92 and P.L. 111-118);
- Extensions of unemployment insurance benefits and COBRA subsidies in P.L. 111-144;
- The Hiring Incentives to Restore Employment Act, P.L. 111-147;
- Further extensions of unemployment insurance in P.L. 111-157 and P.L. 111-205;
- State fiscal relief in P.L. 111-226;
- Tax relief for small businesses in P.L. 111-240;
- Numerous provisions of last December’s tax law (P.L. 111-312) not related to extension of the 2001 and 2003 Bush tax cuts, including temporary extensions of certain earned-income, child, and educational tax credits originally enacted in ARRA; investment incentives; unemployment compensation benefits; and a one-year payroll tax holiday that shaved the contribution rate to Social Security by 2 percentage points (with the trust funds compensated by a general-fund transfer).
We then added the associated debt-service costs, which amount to $264 billion and $109 billion, respectively, on ARRA and on the subsequent recovery measures, over the 2009-2019 period.
- Bush-era tax cuts — Through 2011, the estimated impacts come from adding up past estimates of various changes in tax laws enacted since 2001, chiefly the Economic Growth and Tax Relief Reconciliation Act of 2001 (EGTRRA), the Jobs and Growth Tax Relief Reconciliation Act of 2003 (JGTRRA), the 2008 stimulus package, and a series of annual AMT patches. Those estimates were based on the economic and technical assumptions used when CBO and the Joint Committee on Taxation (JCT) originally “scored” the legislation, but the numbers would not change materially using up-to-date assumptions. Most of the Bush tax cuts were scheduled to expire after December 2010 but were continued for another two years in last December’s tax compromise. We added the cost of extending them from estimates prepared by CBO and JCT.[18] Together, the tax cuts account for $1.7 trillion in extra deficits in 2001 through 2008, and $3.7 trillion over the 2009-2019 period. Finally, we added the extra debt-service costs caused by the Bush-era tax cuts, amounting to more than $200 billion through 2008 and another $1.7 trillion over the 2009-2019 period — nearly $330 billion in 2019 alone.
- War costs — Spending for operations in Iraq and Afghanistan and related activities cost $610 billion through fiscal 2008, according to CBO ($575 billion for the Department of Defense and $35 billion for international affairs), plus another $160 billion in 2009 and $170 billion in 2010. [19] We based estimates of costs in 2011 through 2019 on CBO’s projections, adjusted for a phase-down to 45,000 troops; those costs come to just over $700 billion.[20] We add the associated debt-service costs, which came to $64 billion through 2008 and will total another $607 billion over the 2009-2019 period ($105 billion in 2019 alone).
What About the Medicare Prescription Drug Benefit?
One of the major domestic initiatives of the Bush Administration was enactment of the Medicare Prescription Drug, Improvement, and Modernization Act of 2003 (known informally as the Medicare Modernization Act, or MMA). The MMA created a new prescription-drug benefit in Medicare, known as Medicare Part D. This legislation was only partly paid for, and it added significantly to the deficit that President Obama inherited. Why is it absent from this analysis?
The Congressional Budget Office initially estimated that the MMA would add to the deficit by $395 billion over its first decade, spanning the years between 2004 and 2013. (Medicare’s chief actuary pegged the net cost significantly higher — $534 billion over that period.) CBO’s estimate consisted of $552 billion in net spending — new benefits, partially offset by premiums and by receipts from the states — for the drug benefit itself, minus $157 billion in savings in Medicaid and other federal programs. Although that “headline” estimate spanned ten years, costs were negligible in the first two years, because the new benefit took effect in January 2006.
Part D outlays are coming in somewhat lower than CBO and the Medicare actuary expected, but it is not possible to update the original price tag for the entire MMA.a CBO now expects the net cost of Medicare Part D over that initial 2004-2013 period to be about $375 billion (as compared to the original $552 billion figure). But, it is not possible to tell whether the savings in Medicaid and other programs have deviated from CBO’s original estimate of $157 billion. While Part D is a new, identifiable account in the federal budget, those other effects represent relatively small changes in large, ongoing programs.
In short, we did not include the costs of the prescription-drug program in this analysis because we could not estimate those net costs with the same confidence that we could estimate costs, based on CBO analyses, for other Bush-era policies — namely, the tax cuts and the wars in Iraq and Afghanistan. Over the 2009-2019 period that is this paper’s focus, CBO now expects net outlays for Part D to total approximately $825 billion (over $115 billion in 2019 alone), but some fraction of that will be offset by savings in Medicaid and other programs that we are not able to estimate. Nevertheless, it is clear that, as noted above, enactment of the prescription-drug program added materially to the deficit that the current administration inherited.
a Edwin Park, “Lower-Than-Expected Medicare Drug Costs Reflect Decline in Overall Drug Spending and Lower Enrollment, Not Private Plans,” Center on Budget and Policy Priorities, May 6, 2011.
Conspicuously missing from this list is the Medicare prescription-drug program that Congress enacted in 2003. That new program has also added significantly to deficits through 2019, but data limitations leave us unable to quantify its net budgetary effects (see the box above).
Allowing the Bush tax cuts to expire — or extending some portions while fully offsetting their cost — would reduce deficits by $3.8 trillion over the next decade.[21] That consists of $2.5 trillion from not extending the tax cuts themselves, about $650 billion from an interaction with continued AMT relief, and another $650 billion in debt-service savings. As Table 2 indicates, that strategy would, by itself, stabilize the ratio of federal debt to GDP for the next decade (at about 73 percent of GDP).
| TABLE 2: Effects on Federal Deficits and Debt of Allowing Bush-Era Tax Cuts to Expire (By fiscal year, in billions of dollars; details may not add to totals due to rounding) | |||||||||||||
| 2011 | 2012 | 2013 | 2014 | 2015 | 2016 | 2017 | 2018 | 2019 | 2020 | 2021 | 2012-2021 | ||
| Federal deficit | |||||||||||||
| CBPP baseline deficit | 1,399 | 1,095 | 962 | 921 | 968 | 1,084 | 1,075 | 1,112 | 1,243 | 1,345 | 1,430 | 11,234 | |
| Allow tax cuts to expire | 0 | -2 | -129 | -298 | -335 | -354 | -372 | -390 | -408 | -426 | -444 | -3,159 | |
| Debt-service savings | 0 | 0 | -3 | -11 | -25 | -43 | -64 | -87 | -112 | -139 | -168 | -652 | |
| Resulting deficit | 1,399 | 1,093 | 830 | 612 | 608 | 687 | 638 | 635 | 723 | 781 | 817 | 7,424 | |
| Federal debt held by the public | |||||||||||||
| CBPP baseline | 10,363 | 11,531 | 12,595 | 13,611 | 14,676 | 15,853 | 17,019 | 18,223 | 19,554 | 20,988 | 22,506 | ||
| Without extension of tax cuts | 10,363 | 11,504 | 12,160 | 12,670 | 13,236 | 13,911 | 14,546 | 15,172 | 15,866 | 16,594 | 17,322 | ||
| Federal debt as a percent of GDP | |||||||||||||
| CBPP baseline | 68.9 | 73.5 | 76.8 | 78.9 | 80.7 | 82.8 | 85.0 | 87.0 | 89.5 | 92.0 | 94.5 | ||
| Without extension of tax cuts | 68.9 | 73.3 | 74.1 | 73.4 | 72.7 | 72.7 | 72.6 | 72.5 | 72.6 | 72.7 | 72.8 | ||
| Source: CBPP calculations based on data from CBO. | |||||||||||||
This report updates an analysis last conducted by CBPP in June 2010.[22] It thus takes into account nearly a year’s worth of revisions by CBO and of actions by Congress. The results are nevertheless very similar. Very observant readers will note that we now show a slightly higher cost associated with the Bush-era tax cuts over the 2009-2019 period. That is chiefly because we now include the latest AMT patch, enacted in P.L. 111-312, as part of that cost, and because of other new data from CBO.
Despite the apparent precision of the effects shown in Table 1, users should be aware of their limitations. This project involves tallying up estimates that were done at different times and that employed different economic and technical assumptions. For example, CBO does not generally revisit the effects of legislation once it is enacted, so many of the measures depicted in the table surely ended up costing more — or less — than initially “scored.” [23] Useful details (such as a breakdown of expiring tax provisions by particular provision and original enactment date) are unavailable. And more than two years into the new Administration, President Obama has continued (with modifications) some policies that were begun in the Bush era, blurring the exact division of those policies’ budgetary effects. In short, readers should be aware that these estimates are not definitive. Notwithstanding their limitations, however, they paint a clear picture of what lies behind the nation’s current fiscal woes.
End Notes
[1] Congressional Budget Office, The Economic and Budget Outlook: An Update (September 2008). As CBO itself acknowledged, its baseline employed some arguably unrealistic assumptions about the expiration of the Bush tax cuts and other policies; several other organizations pegged future deficits much higher than CBO’s official estimates. See, for example, the Concord Coalition, “Setting Expectations: Why Baselines Matter in the Presidential Campaign and for the Fiscal Future” (September 11, 2008); Cato Institute, “$1 Trillion Budget Deficit by 2017?” (September 11, 2008).
[2] Congressional Budget Office, The Budget and Economic Outlook: Fiscal Years 2009 to 2019 (January 2009).
[3] At the same time, the recession pushed down inflation and interest rates, which generated some offsetting savings.
[4] That occurred on September 7, 2008 — too late for inclusion in the CBO report issued just two days later.
[5] See the technical note at the end of this paper for the list of measures that we include here.
[6] CBO estimates that ARRA boosted the number of people employed in the United States by 1 ½ million to 3 ½ million in the middle of 2010 (more, if measured on a full-time-equivalent basis) and that real (inflation-adjusted) GDP was about 1.7 percent to 4.4 percent higher than it would have been if ARRA had not been enacted. Under CBO’s latest analysis, ARRA’s impact on real GDP and employment peaked in the middle of 2010. Congressional Budget Office, Estimated Impact of the American Recovery and Reinvestment Act on Employment and Economic Output from October 2010 Through December 2010 , February 2011, Table 1.
[7] As explained in the technical note at the end of the paper, this analysis assumes that expiring tax cuts will be extended and necessary funding will be provided to phase down operations in Iraq and Afghanistan.
[8] See Table 1 in the technical note at the end of this paper. These debt estimates simply sum up the policies’ effects on deficits over the two separate periods (2001-2008 and 2009-2019) shown there, including the associated interest costs.
[9] See Kathy Ruffing, Kris Cox, and James Horney, “The Right Target: Stabilize the Federal Debt,” Center on Budget and Policy Priorities, January 12, 2010.
[10] Paul N. Van de Water, “Corker-McCaskill Spending Cap Doesn’t Account for Basic Changes in Society and Government,” Center on Budget and Policy Priorities, February 1, 2011; Edwin Park, Kathy Ruffing, and Paul N. Van de Water, “Proposed Cap on Federal Spending Would Force Deep Cuts in Medicare, Medicaid, and Social Security,” Center on Budget and Policy Priorities, April 15, 2011.
[11] The tax cuts were originally slated to expire after 2010. In December 2010 lawmakers extended them for two years, through 2012. The legislation also included a two-year extension of some tax cuts in ARRA, a one-year reduction in the Social Security payroll tax for employees, and other temporary provisions. See Gillian Brunet and Chuck Marr, “Unpacking the Tax Cut-Unemployment Compromise,” Center on Budget and Policy Priorities, December 10, 2010.
[12] The baseline appears in Congressional Budget Office, An Analysis of the President’s Budgetary Proposals for Fiscal Year 2012 (April 2011). CBO’s baseline does not yet, however, incorporate the continuing resolution (P.L. 112-10) that contained final appropriations for most government departments for the remainder of 2011. CBO estimates that the law’s enactment would reduce federal outlays over the 2011-2021 period by $20 billion to $25 billion below what would result from setting 2011 appropriations at the 2010 level, as CBO’s baseline assumed. See Congressional Budget Office, “H.R. 1473, the Department of Defense and Full-Year Continuing Appropriations Act of 2011 (Additional Information),” April 14, 2011.
The adjustments appear in Table 1-7, “Budgetary Effects of Selected Policy Alternatives Not Included in CBO’s Baseline,” in Congressional Budget Office, The Economic and Budget Outlook (January 2011). CBO did not update this table in its March 2011 revisions. For a similar use of these adjustments to depict the budget outlook under current policies, see Alan J. Auerbach and William G. Gale, “Tempting Fate: The Federal Budget Outlook,” February 8, 2011 (available at www.brookings.edu).
[13] Congressional Budget Office, The Economic and Budget Outlook (January 2009);A Preliminary Analysis of the President’s Budget and an Update of CBO’s Budget and Economic Outlook (March 2009);The Budget and Economic Outlook: An Update (August 2009); The Economic and Budget Outlook (January 2010); An Analysis of the President’s Budgetary Proposals for Fiscal Year 2011 (March 2010); The Economic and Budget Outlook: An Update (August 2010); The Economic and Budget Outlook (January 2011); and An Analysis of the President’s Budgetary Proposals for Fiscal Year 2012 (April 2011).
[14] Estimates are not available for 2019 because CBO’s August 2008 projections ended in 2018. For Figure 1, we assumed that this category would amount to $350 billion in 2019, a continuation of the previous few years’ pattern.
[15] See Congressional Budget Office, cost estimate for H.R. 1, American Recovery and Reinvestment Act of 2009 (February 13, 2009, online at www.cbo.gov) and Joint Committee on Taxation, “Estimated Budget Effects Of The Revenue Provisions Contained In The Conference Agreement For H.R. 1, The ‘American Recovery And Reinvestment Tax Act Of 2009’” (February 12, 2009, online at www.jct.gov).
[16] See Box 1-2, “Updated Estimates of the Budgetary Effects of the American Recovery and Reinvestment Act of 2009” in CBO January 2011.
[17] That one-year fix — made necessary by the interaction of the AMT and the 2001 and 2003 tax cuts — is instead combined with the “Bush-era tax cuts,” below.
[18] Table 1-7, CBO January 2011. Although they are dwarfed by the cost of the 2001 and 2003 tax-cut provisions, we removed from CBO’s estimate three ARRA provisions — enhancements to the earned-income and child tax credits and enactment of an American Opportunity Tax Credit for students — that were extended in December 2010, because they did not date from the Bush era. We assume these three provisions cost about $22 billion a year.
[19] CBO January 2010, “Funding for Operations in Iraq and Afghanistan and Other Related Activities” (Box 1-1); CBO January 2011, “Funding for Operations in Afghanistan and Iraq and for Related Activities” (Box 3-2).
[20] CBO January 2011, Table 1-7.
[21] These effects are from CBO’s Table 1-7, op. cit. For simplicity, we include the entire line labeled “Extend Certain Income Tax and Estate and Gift Tax Provisions Scheduled to Expire on December 31, 2012” in CBO’s table. In fact, a small portion — about $22 billion a year, less than 10 percent of the total — actually reflects the assumed extension of certain earned-income, child, and education tax-credit provisions that were enacted in ARRA and temporarily renewed in December 2010.
[22] Kathy Ruffing and James Horney, “Critics Still Wrong on What’s Driving Deficits in Coming Years,” Center on Budget and Policy Priorities, June 28, 2010.
[23] ARRA is an exception to the rule that CBO doesn’t revisit the effects of past legislation. CBO has regularly updated its estimates of ARRA, as amended, partly in response to the transparency and accountability provisions of that Act. See, for example, Box 1-2 in CBO’s January 2011 report, op. cit.
More from the Authors

Areas of Expertise