A Hand Up: How State Earned Income Tax Credits Help Working Families Escape Poverty in 2011
Summary
The federal Earned Income Tax Credit, which began in 1975 and has been expanded several times since then, is often heralded as the most effective anti-poverty program in the United States, particularly for children in working families. In 2009 alone, it lifted 6.5 million working families, including 3.3 million children, out of poverty.
The credit effectively boosts the income of working families earning low wages by offsetting their income and payroll taxes and increasing their workforce participation. In other words, it makes work pay by allowing low- and moderate-income families to keep more of what they earn.
State EITCs build on the success of the federal credit. They reduce state income taxes and help families pay for state and local sales and property taxes, which hit lower-income households hardest. They enhance the federal EITC’s positive effects on workforce participation and boost the after-tax incomes of working families, further reducing poverty.
The first state EITC was offered in 1987 in Maryland. Since that time, 22 additional states plus the District of Columbia have followed suit, creating their own EITCs. They are effective and straightforward to design and administer. And over the years, they have received support from Republican and Democratic leadership and have been championed by business, labor, faith-based, and social service advocacy groups.
Today, with working families battered by economic problems as never before, state EITCs play a particularly important role. Families use EITCs to fill in for the loss of wages that can result from reductions in hours or layoffs. As long as they are still working at least some hours a year, families can benefit from the EITC.
I. Helping Make Work Pay: The Federal Earned Income Tax Credit
The federal EITC is a central element of national and bipartisan efforts to boost income from work and lessen poverty among working families with children, a set of goals often called the “make work pay” strategy.
This and subsequent expansions reflected an understanding that a majority of poor families are poor despite work. In 2009, the last year for which data are available, some 6.2 million families with children had incomes below the federal poverty line. Of these families, 3.6 million — or 59 percent — included at least one non-elderly, nondisabled adult worker. [2] The EITC has long served as a way to recognize and reward the work of these families.
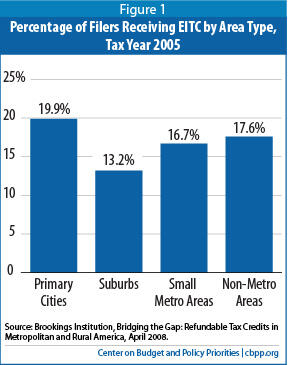
But the EITC is not just for working-poor families. It also has helped to make work pay for the many working families with incomes just above the federal poverty line that also have difficulty making ends meet. The official federal poverty line, currently about $23,000 for a family of four, falls well short of what it takes to provide a family with even the most basic necessities in most, if not all, parts of the country. [3] The EITC helps working families make ends meet in states big and small and in areas rural and urban (see Table 1 and Figure 1).
| Table 1: Number of Families And Individuals That Received The Federal EITC For Tax Year 2008, By State | |||
| State | EITC Recipients | State | EITC Recipients |
| Alabama | 524,097 | Montana | 78,427 |
| Alaska | 38,488 | Nebraska | 122,890 |
| Arizona | 487,002 | Nevada | 196,012 |
| Arkansas | 301,909 | New Hampshire | 70,926 |
| California | 2,730,012 | New Jersey | 535,511 |
| Colorado | 308,255 | New Mexico | 210,347 |
| Connecticut | 190,504 | New York | 1,622,113 |
| Delaware | 66,152 | North Carolina | 864,536 |
| District of Columbia | 50,144 | North Dakota | 40,669 |
| Florida | 1,852,940 | Ohio | 896,168 |
| Georgia | 1,022,957 | Oklahoma | 329,642 |
| Hawaii | 97,062 | Oregon | 258,435 |
| Idaho | 120,054 | Pennsylvania | 856,884 |
| Illinois | 954,070 | Rhode Island | 75,871 |
| Indiana | 504,631 | South Carolina | 477,905 |
| Iowa | 194,022 | South Dakota | 60,067 |
| Kansas | 195,577 | Tennessee | 626,531 |
| Kentucky | 386,058 | Texas | 2,417,062 |
| Louisiana | 516,934 | Utah | 164,055 |
| Maine | 94,901 | Vermont | 42,141 |
| Maryland | 375,444 | Virginia | 552,941 |
| Massachusetts | 353,061 | Washington | 399,088 |
| Michigan | 758,244 | West Virginia | 152,595 |
| Minnesota | 308,262 | Wisconsin | 347,667 |
| Mississippi | 398,579 | Wyoming | 33,807 |
| Missouri | 489,968 | ||
| Source: Internal Revenue Service, SOI Tax Stats - Historic Table 2, 2008. | |||
Credit Design and Value
The federal EITC is designed to offset federal income taxes and Social Security payroll taxes, supplement earnings, and encourage and reward work. The EITC’s design also reflects the reality that larger families face higher living expenses than smaller families. To accomplish these goals, the credit phases in as a family’s income rises (at a rate higher for larger families), hits a maximum limit as a family’s earnings approach the poverty line, and then phases out at a gradual rate as a family’s earnings continues to rise.
Working families with incomes below the federal poverty line receive the largest benefits. [4] Because the EITC phases out gradually as income rises, many families with incomes above the poverty line also benefit. [5] Families with three or more children receive larger benefits than one- or two-child families, and married couples receive more than single parents.
Mechanics of the Federal EITC in 2011
The federal EITC has the following features:
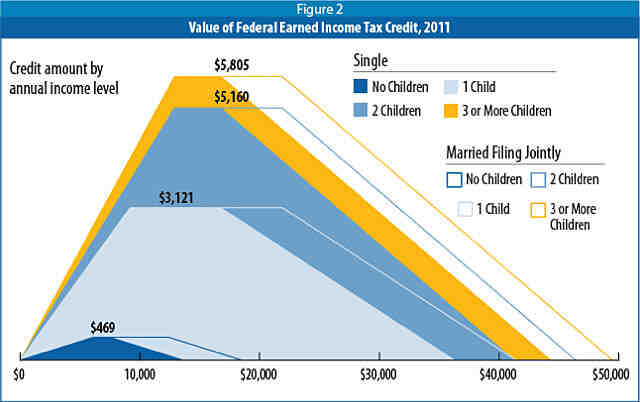
- Maximum benefits . As shown in Figure 2, the maximum federal benefit for families with one child is $3121. For families with two children, the maximum is $5,160 and for families with three children, the maximum is $5,805. The maximum benefit for workers without a qualifying child is much lower: $469.
- Phase-in with earnings . For families with very low earnings, the dollar amount of the EITC increases as earnings rise. For example, families with one child receive an EITC equal to 34 cents for each dollar up to $9,180 of earnings, at which point their maximum benefit equals $3,121. Families with two children receive a credit equal to 40 cents for each dollar earned and families of three earn a credit equal to 45 cents per dollar earned, up to $12,900. Families continue to be eligible for the maximum credit until income reaches $16,840 (or $21,970 for married-couple families), after which point the amount they receive goes down until it reaches zero when family income surpasses the eligibility level.
- Maximum eligibility . For single-parent families with one child, eligibility for the EITC ends when income exceeds $36,372; the maximum is $41,502 for married couple families. Single parent families with two children remain eligible until their income exceeds $41,341; eligibility is extended to $46,471 for married couple families with two children. Single-parent families with three or more children will reach their eligibility limit when their income exceeds $44,404; married couple families of this size will reach their eligibility limit at $49,534.
As with most other provisions of the federal tax code, EITC benefit amounts and eligibility levels are adjusted each year by the IRS for inflation. Some aspects of the credit, such as the higher benefit for families with three or more children, are scheduled to expire after 2012.
How the Federal EITC Achieves Its Goals
The federal EITC accomplishes several policy goals -- reducing taxes, supplementing wages, and reducing poverty for low- and moderate-income working families. With the passage of the American Recovery and Reinvestment Act of 2009, the federal EITC and a number of other credits were expanded to provide additional aid to low-income workers and their families. Combined with an increased federal minimum wage of $7.25 that phased in between 2007 and 2009, these expansions have enhanced the federal government’s ability to meet the EITC’s policy goals. The following examples illustrate how the EITC achieves these goals[6]:
- The federal EITC reduces taxes on low- and moderate-income families both by offsetting federal income taxes and by offsetting some or all of the federal payroll taxes that finance the Social Security and Medicare programs.
Example One. A single parent with one child, working full time throughout the year at a wage of $12 per hour, earns $24,960 per year. This worker owes $886 in 2011 federal income taxes which are withheld from the paycheck during the year. The family also qualifies for an EITC of $1,824. The EITC allows the family to get back the $886 it paid in income taxes and to receive an additional refund of $938. The EITC refund serves to offset some of the worker’s $1,909 in payroll taxes that also were paid during the year. [7] - For many recipients, especially families just entering the workforce and those with very low earnings, the EITC goes beyond offsetting taxes paid. In so doing, it effectively acts as a wage supplement.
Example Two. A single parent with one child working full-time at the minimum wage of $7.25 per hour earns $15,080 annually. This worker does not owe any federal income tax, but qualifies for a 2011 EITC of $3,121. The parent pays $1,154 in payroll taxes, so the EITC refund offsets those taxes and provides an additional $1,967 as a wage supplement. [8] - The EITC lifts families out of poverty and reduces the extent of poverty and economic hardship. For instance, a minimum-wage job plus the EITC provides enough cash income to support some families at a level above the poverty line.
An example of how the EITC lifts a family out of poverty may be provided by the full-time minimum-wage worker with one child described above. Without the federal EITC, this family would have after-tax income of $13,926, about $1,419 below the federal poverty line of $15,345. The EITC lifts the family’s cash income to $18,047, about $2,702 above the poverty line. [9]
For larger families, however, even a full-time job at the federal minimum wage and the EITC together are not sufficient to lift the family from poverty. As discussed in the next chapter, a state EITC can help bridge that gap.
These examples also help illustrate the importance of the refundability of the EITC. If it were not refundable, the EITC could not offset payroll taxes — which represent a much larger burden on low-income working families than the income tax — nor serve as a wage supplement to families with little or no income tax liability.
Research evidence confirms that the EITC has been effective at meeting the goals of making work pay better and reducing poverty among working families.
- The wage supplement offered by the EITC has encouraged hundreds of thousands of welfare recipients to enter the workforce. Several academic studies, using a variety of sources of data, show that the EITC more than any other factor accounted for the increase in workforce participation among single mothers since the late 1990s (see box below).
- The additional income provided by the EITC in 2009 lifted 6.5 million people out of poverty, including 3.3 million children. The EITC lifts more working families out of poverty than any other government program. [10]
- Families can use their EITCs to make investments that may over the long term reduce their dependence on government benefits. In 1996, a team of researchers from Syracuse University and the Center for Law and Human Services surveyed close to 1,000 EITC recipients. Over half of those surveyed spent some or all their EITC refunds on financial investments or human capital investments, including paying for tuition or other education expenses, increasing access to jobs through car repairs and other transportation improvements, moving to a new neighborhood, or putting money in a savings account.[11] 2005 research conducted in the Cleveland area found that half of EITC filers would use the funds to pay bills. [12]
- Research indicates that tax refunds, including federal and state EITC refunds, can be used to promote asset building in low-income families. [13] Data from various studies indicate that many low-income individuals value saving and assets. For example, research suggests that low-income individuals can save and accumulate assets in Individual Development Accounts (IDAs).[14] IDAs are special savings accounts designed to help low-income individuals build assets to reach certain goals such as buying a home, pursuing post-secondary education, or starting a business. In addition, there is evidence that some low-income families save part of their tax refunds. The Chicago study described above, for instance, found that 33 percent of EITC recipients planned to save a portion of their tax refunds. This suggests that tax refunds might be effectively linked to a variety of asset-building initiatives.
Research Findings on the Effectiveness of the EITC
Several recent studies indicate that the EITC has positive effects in inducing more single parents to go to work, reducing welfare receipt, and moderating the growing income gaps between rich and poor Americans. According to this research, the EITC:
- Increases Work Among Single Parents – The 1990s expansions to the federal EITC increased the employment of single parents substantially, according to a number of studies. For example, Harvard economist Jeffrey Liebman conducted a series of studies on the EITC. He noted that workforce participation among single women with children has risen dramatically since the mid-1980s.a In 1984, some 72.7 percent of single women with children worked during the year. In 1996, some 82.1 percent did. The increase has been most pronounced among women with less than a high school education. During this same period there was no increase in work effort among single women without children.
A number of researchers have found that the large expansions of the EITC since the mid-1980s have been a major factor behind the trend toward greater workforce participation. Studies by Liebman and University of California economist Nada Eissa find a sizable EITC effect in inducing more single women with children to work.b In addition, a study by Northwestern University economists Bruce Meyer and Dan Rosenbaum finds that a large share of the increase in employment of single mothers in recent years can be attributed to expansions of the EITC. They find that the EITC expansions explain more than half of the increase in employment among single mothers over the 1984-1996 period. Of note, Meyer and Rosenbaum found evidence that state EITCs also contributed to workforce participation increases in states where credits were available.
A recent study confirms a very strong connection between the size of a family’s EITC benefit and its likelihood of employment. Authors V. Joseph Holtz, Charles H. Mullin, and John Karl Scholz examined administrative data and IRS records for several hundred thousand California welfare recipients during the 1990s. They found that families with two or more children experienced noticeably faster rates of employment growth than families with one child because the larger families were eligible for greater EITC payments. The study found that an EITC increase of roughly $400 increased rates of employment by 3.2 percentage points. “Our paper shows that the EITC can be an important tool in efforts to increase employment of welfare recipients,” the authors concluded.d - Reduces Poverty and Income Disparities – In 2009, the federal EITC lifted 6.5 million people out of poverty and without the EITC the poverty rate among children would have been nearly one-third higher. In fact, the EITC lifts more children out of poverty than any other single program or category of programs.
Research by Liebman also has found that the EITC moderates the gap between rich and poor. During the past 20 years, the share of national income received by the poorest fifth of households with children has declined, while the share of income received by the top fifth has risen sharply. Liebman found that the EITC offsets between one-fourth and one-third of the decline that occurred during this period in the share of income the poorest fifth of households with children receive. - Helps Families Make Ends Meet – A majority of the families with children who receive EITCs are not technically poor, but may nonetheless face significant economic challenges. One study documents the EITC’s broad reach, finding that between 1989 and 2006, about half of all taxpayers with children claimed the EITC at some point. Research also shows that many families use it to pay for basic necessities like housing, utilities, food, and basic household appliances, and that some families use their EITC to make purchases or investments that can help them maintain their jobs and their homes or to improve their employability so they have a better chance of moving into the middle class. The research indicates, for example, that a significant share of families use part of their EITC to repair or replace a car needed to get to work, to make essential but costly repairs to a home, such as repairing a leaking roof, or to pay for more education or job training.f
Sources:
a Jeffrey B. Liebman, “The Impact of the Earned Income Tax Credit on Incentives and Income Distribution,” in James M. Poterba, ed., Tax Policy and the Economy, Vol. 12, MIT Press, 1998.
b Nada Eissa and Jeffrey B. Liebman, “Labor Supply Response to the Earned Income Tax Credit,” Quarterly Journal of Economics, May 1996, 112(2), pp. 605-637
c Bruce D. Meyer and Dan T. Rosenbaum, “Welfare, The Earned Income Tax Credit, and the Labor Supply of Single Mothers,” September 1999, and “Making Single Mothers Work,” National Tax Journal 53 (4, part 2), December 2000.
d V. Joseph Holtz, Charles H. Mullin, and John Karl Scholz, “Examining the Effects of the Earned Income Tax Credit on the Labor Market Participation of Families on Welfare,” NBER Working Paper #11968, January 2006.
e Robert Greenstein, The Earned Income Tax Credit: Boosting Employment, Aiding the Working Poor, Center on Budget and Policy Priorities, August, 2005.
f “The Earned Income Tax Credit: Safety Net or Bootstrap." National Tax Association Conference on Taxation, National Tax Association. Philadelphia, PA. November 21, 2008; Timothy M. Smeeding, Katherin E. Ross, and Michael O’Connor, “The EITC: Expectation, Knowledge, Use, and Economic and Social Mobility,” National Tax Journal, December 2000.
II. Why Nearly Half of States Have Followed in the Federal Government’s Footsteps
Just as the federal EITC helps offset federal taxes paid by low-income working families, state Earned Income Tax Credits can help relieve the substantial burden of state and local taxes levied on working-poor and near-poor families in every state. State EITCs also help advance the same goals as the federal EITC by further encouraging work and lifting additional working families out of poverty.
Twenty-three states and the District of Columbia have enacted their own EITCs to supplement the federal program by boosting the incentive to work, boosting low wages, and reducing poverty. In addition, San Francisco [15], New York City, and Maryland’s Montgomery County also offer local EITCs available to residents along with the state and federal programs.
Over the years, EITCs have been enacted in states with Republican and Democratic leadership and the credits are supported by business groups, labor, faith-based organizations, and social service advocates.
The national recession has slowed, but not stopped, the expansion of state EITCs. Some states recently have expanded their EITCs: New Mexico and North Carolina in 2008, and Michigan and Kansas in 2010. Washington in 2008 became the first of the nine states without a broad-based income tax to enact a state EITC, but benefits have been postponed until tax year 2012. Just one state--New Jersey--has reduced the size of its credit, to 20 percent of the federal credit from 25 percent, effective in 2011. (As of March 2011, four states--Illinois, Iowa, Maine, and Oregon--were considering credit increases; Connecticut was considering a new credit. A small number of additional states – Kansas, Michigan, North Carolina, and Wisconsin -- were considering reducing their credits.)
The EITC is playing an important part in fighting poverty during the current downturn. State EITCs, in concert with the federal credit, are helping to provide relief and support to working families that have seen their wages eroded, hours cut back, or that have lost a family wage earner due to recession.
State EITCs Provide Needed Tax Relief
State EITCs play an important role in providing relief from state and local taxes paid by low-income working families, just as the federal EITC offsets federal income and payroll taxes. In every state, low-income working families pay a substantial share of their income in state and local taxes. State EITCs thus can help ensure that state taxes do not push working families closer to or deeper into poverty.
In 2009, 13 of the 42 states with a personal income tax levied the tax on below-poverty married couple families of four and 11 states taxed the income of single parent families of three. The average tax burden in these states was $174 for a two-child family of four and $129 for a two-child family of three with earnings at the poverty line. [16] Offering an EITC is an effective way to reduce income taxes on such families. Without state EITCs, the number of states taxing the income of single parents below the poverty line would increase to 21 from 11, and the number of states taxing the income of married couple families below the poverty line would double to 26 from 13.
While the personal income tax payments of poor families are notable in many states, other state and local taxes often increase even more the tax payments of poor families.
Most states rely to a large extent on revenue from sales and excise taxes. These taxes are regressive, which means they absorb a larger proportion of the incomes of lower-income households than of higher-income households. In 2007, the average state and local tax burden on the poorest fifth of married, non-elderly families was 10.9 percent of income. By contrast, the wealthiest one percent of such families spent an average of 5.2 percent of income for state and local taxes.[17] Sales and excise taxes alone accounted for more than two thirds of the state and local taxes paid by the poorest families.
Creating or expanding state EITCs can help states offset tax increases that disproportionately impact the poor. Continued revenue crises due to the recession have led many states to increase taxes and they are demonstrating little inclination to reduce their reliance on sales and excise taxes. Since the recession began, nine states increased their general sales tax rates and 22 states enacted increases in their excise taxes. In Kansas, for example, a 1 percentage point increase in the state sales tax was partially offset by a 1 percentage point increase in the state’s EITC, to 18 percent of the federal credit from 17 percent.
State EITCs Complement Welfare-to-Work Strategies
The effectiveness of state EITCs in supplementing wages and encouraging workforce participation is of particular relevance to the design of state welfare programs. Many welfare recipients who take jobs continue to have very low incomes, often below the poverty line. Evidence from several studies shows that although most welfare recipients who find jobs are employed close to full-time, many of them earn wages at or only slightly above the minimum wage. Moreover, many do not qualify for paid vacation or sick leave, forcing them to take unpaid leave for reasons such as a child’s illness. National data show that three in five former welfare recipients work 35 hours or more per week. The typical welfare leaver earns about $7.75 in hourly wages and has a family income of around $12,400 annually. [18] Such low earnings are insufficient to lift a single-parent family of three above the poverty line even with the federal EITC. A combination of the federal EITC and a state EITC, however, can close the poverty gap for many welfare recipients as they struggle to remain in the workforce.
States have demonstrated a strong policy interest in subsidizing the efforts of welfare recipients to enter and remain in the workforce. During the welfare-to-work reforms of the mid-to-late 1990s, the vast majority of states adopted policies to gradually phase out welfare benefits for families as their earnings increased. These policies helped ease the transition for families moving from welfare to work. Many states also expanded access to child care and to health insurance for working-poor families. Despite some recent retrenchment due to recession, states have by and large supported policies that help make work pay.
States also have an interest in supporting the work efforts of low- and moderate-income families who have left the welfare rolls or who have never received welfare benefits. EITCs help families meet the ongoing expenses associated with working — such as transportation — and may allow families to cope with unforeseen costs that otherwise might drive them onto public assistance.
Federal policies encourage use of a state EITC to assist families as parents enter the workforce and to support the work efforts of lower-income families. The federal rules for the Temporary Assistance to Needy Families program, the welfare block grant to states enacted in 1996, allow the refundable portion of state EITCs to be financed with federal TANF funds or with the “maintenance of effort” (MOE) funds states must spend to access the federal TANF funds. Using TANF or MOE funds to help finance state EITCs is discussed in greater detail in Chapter V.
State EITCs Lift Additional Families Out of Poverty and Boost Living Standards
Despite the success of the federal EITC in reducing poverty among working families, wages plus the EITC do not guarantee an escape from poverty for all families.
One problem is that the wages of low-earning U.S. workers have been stagnant for some time; the wages of workers at the 20th percentile, for instance, grew at an average annual rate of 0.5 percent from 1979 to 2007, after adjusting for inflation. Low wages lead to low household income. The modest income growth for the bottom fifth of households contrasts starkly with the gains for the wealthiest households. Between 1979 and 2007, the after-tax income of the poorest American households grew just 16 percent overall, compared with 281 percent for the top one percent of households.[19]
- Full-time, year-round work cannot be relied upon to bring a family above the poverty line even after the federal EITC is taken into account. [20]
Example Three. A family of four with two children and a full-time, year-round worker earning $8.00 per hour has earnings of about $16,000 per year. After subtracting the employee share of payroll taxes and adding the 2011 EITC for which the family qualifies of $5,160 (plus a federal child tax credit of $1,950), the family’s cash income equals $21,886, or about $692 below the poverty line for a two-parent family of four. [21] - Many low-wage working parents are not able--for a variety of reasons--to work full-time, year-round. In 2008, nearly 1.4 million working-age people in families with children spent time out of the labor force because of illness or disability, family reasons, school, or because they could not find full-time work (or any work).[22] In addition to economic factors, many parents lose earnings when they take unpaid leave to fulfill their child-rearing responsibilities. Families in which parents work less than full time or less than all year can fall into poverty even if they receive the federal EITC and even if the parent earns above the minimum wage.
Example Four. A single parent with two children working year-round (50 weeks) but not quite full-time (34 hours per week) at the minimum wage of $7.25 per hour has an annual income of about $12,325. After subtracting payroll tax and adding the $4,930 federal EITC for which that family qualifies, the family’s cash income totals $16,312, or about $1,626 below the 2011 poverty line for a single parent family of three. [23] The child tax credit lowers that gap to $227. If the parent works fewer weeks in the year or fewer hours per week, the poverty gap expands.
State EITCs can build on the success of the federal EITC in combating poverty and economic hardship among working families with children. Closing or at least substantially reducing the poverty gap for many working families, such as the families described in the examples above, is within the reach of many states.
- The family of four earning $16,000 per year described in Example Three above falls $692 below the federal poverty line even with the federal EITC. A state EITC equal to about 13 percent of the federal EITC would lift the family’s income above the poverty line.
- The family of three with annual earnings of $12,325 described in Example Four falls $227 below the poverty line even with the federal EITC and child tax credit. A state EITC equal to about 5 percent of the federal EITC would lift that family’s income above the poverty line.
State EITCs are also well-designed to assist the many families with incomes somewhat above the poverty line who continue to experience economic hardship. The EITC phases out gradually as income rises, with benefits accruing to families with incomes up to about $36,000 to $50,000 depending on household type and number of children. For this reason, a majority of families with children who receive the EITC have incomes above the poverty line.
The details of how state EITC programs work are described in Chapters IV and V.
| Table 2: State Earned Income Tax Credits Based on The Federal EITC | ||
| State | Percentage of Federal Credit (Tax Year 2010 Except as Noted) | Refundable? |
| Delaware | 20% | No |
| District of Columbia | 40% | Yes |
| Illinois | 5% | Yes |
| Indiana | 9% | Yes |
| Iowa | 7% | Yes |
| Kansas | 18% | Yes |
| Louisiana | 3.5% | Yes |
| Maine | 5% | No |
| Marylanda | 25% | Yes |
| Massachusetts | 15% | Yes |
| Michigan | 20%f | Yes |
| Minnesotab | Average 33% | Yes |
| Nebraska | 10% | Yes |
| New Jersey | 20% | Yes |
| New Mexico | 10% | Yes |
| New Yorkc | 30% | Yes |
| North Carolinad | 5% | Yes |
| Oklahoma | 5% | Yes |
| Oregone | 6% | Yes |
| Rhode Island | 25% | Partiallyg |
| Vermont | 32% | Yes |
| Virginia | 20% | No |
| Washington | Not yet implemented; scheduled to go 10% in 2012f | Yes |
| Wisconsin | 4% — one child | Yes |
| 14% — two children | ||
| 43% — three children No credit for childless workers | ||
| Notes: From 1999 to 2001, Colorado offered a 10% refundable EITC financed from required rebates under the state’s “TABOR” amendment. Those rebates, and hence the EITC, were suspended beginning in 2002 due to lack of funds and again in 2005 as a result of a voter-approved five-year suspension of TABOR. In 2011 when the TABOR suspension expires and given sufficient revenues, rebates will resume. A new law passed in 2010, however, would prioritize EITC refunds over rebates and over use of surplus revenues to fund an income tax cut also scheduled for 2011. a Maryland also offers a non-refundable EITC set at 50 percent of the federal credit. Taxpayers in effect may claim either the refundable credit or the non-refundable credit, but not both. b Minnesota’s credit for families with children, unlike the other credits shown in this table, is not expressly structured as a percentage of the federal credit. Depending on income level, the credit for families with children may range from 25 percent to 45 percent of the federal credit; taxpayers without children may receive a 25 percent credit. c Should the federal government reduce New York’s share of the TANF block grant, the New York credit would be reduced automatically to the 1999 level of 20 percent. d North Carolina's EITC is scheduled to expire in 2013. e Oregon's EITC is scheduled to expire at the end of 2013. f Washington’s EITC is worth 10 percent of the federal EITC or $50, whichever is greater. g Rhode Island made a very small portion of its EITC refundable effective in TY 2003. In 2006, the refundable portion was increased from 10 percent to 15 percent of the nonrefundable credit (i.e., 3.75 percent of the federal EITC) | ||
III. Designing a State Earned Income Tax Credit
Twenty-three states as well as the District of Columbia have enacted state EITCs that build on the strengths of the federal EITC. Table 2 describes the structures of existing state EITCs; Table 3 provides recent participation data.
Twenty-two state EITCs piggyback on the federal EITC; these states use federal eligibility rules for families with children and express the state credit as a specified percentage of the federal credit. Minnesota follows federal eligibility rules but does not express its credit as a percentage of the federal credit. For families with children, the Minnesota benefit structure is slightly different from the structure of federal credit; families in Minnesota use a separate tax table in their state tax forms to determine their EITC amount. (See box on page 24 for discussion of the Minnesota EITC.)[24]
An EITC that piggybacks on the federal credit is relatively easy for a state to administer and also is easy for families to claim. To determine its state EITC benefit, a family need only write its federal benefit on its state return and then multiply the federal amount by the state EITC percentage.
A state that chooses to piggyback on the federal credit has four decisions to make in designing a state EITC.
- Should the credit be refundable or non-refundable? That is, will taxpayers be able to receive the credit even if they have little or no state income tax liability?
- At what percentage of the federal credit will the state credit be set?
- Will low-income workers without children, who presently receive a small federal credit, be eligible for the state credit?
- Will the state credit be adjusted for family size beyond the federal family-size adjustment?
Each of these decisions will affect the cost of the credit; financing a state credit is discussed in the next chapter.
| Table 3: State EITC Participation | |||
| State with EITC | Number of EITC Claims | Amount of Credit Claimed (millions) | Tax Year |
| Delaware | 66,152 | $6,000,000 | 2008 |
| District of Columbia | 50,677 | $36,700,000 | 2008 |
| Illinois | 946,867 | $78,903,000 | 2006 |
| Indiana | 465,945 | $58,765,170 | 2008 |
| Iowa | 206,300 | $25,000,000 | 2008 |
| Kansas | 197,810 | $62,368,216 | 2007 |
| Louisiana | 516,934 | $42,819,000 | 2007 |
| Maine | 50,000 | $4,149,911 | 2009 |
| Maryland | 375,444 | $180,593,500 | 2008 |
| Massachusetts | 366,914 | $94,200,000 | 2008 |
| Michigan | 782,000 | $338,000,000 | 2009 |
| Minnesota | 308,262 | $179,800,000 | 2009 |
| Nebraska | 122,890 | $21,350,000 | 2008 |
| New Jersey | 535,511 | $209,859,800 | 2008 |
| New Mexico | 210,347 | $42,662,600 | 2008 |
| New York | 1,439,375 | $811,117,000 | 2008 |
| North Carolina | 864,536 | $90,933,150 | 2009 |
| Oklahoma | 329,642 | $30,243,000 | 2007 |
| Oregon | 226,358 | $25,000,000 | 2008 |
| Rhode Island | 75,682 | $9,428,414 | 2008 |
| Vermont | 38,943 | $20,295,601 | 2007 |
| Virginia | 387,692 | $96,201,482 | 2007 |
| Washington | 399,088 | $72,516,900 | 2008 |
| Wisconsin | 236,691 | $95,900,000 | 2008 |
| Source: Most recent published and unpublished data and estimates available from state revenue offices and data from the IRS Statistics of Income for tax year 2008. | |||
Refundable Versus Non-Refundable EITCs
If a state EITC is refundable, a family receives a refund check for the amount that the EITC exceeds the taxes that family owes. For example, if a taxpayer owes $80 in state income taxes and qualifies for a $200 state EITC, the EITC wipes out the $80 owed and the remaining $120 is sent to the taxpayer in the form of a refund check. (If the $80 of income tax were withheld during the year, the taxpayer would receive the entire $200 as a check. Nevertheless, the EITC would offset $80 in tax liability and provide a $120 income supplement.)
Minnesota’s EITC Phases Out at Higher Income Levels than Federal Credit
Until 1998, Minnesota’s EITC was set at a straight percentage of the federal credit. But in 1998 the state changed the structure of its state EITC (known as the “Working Families Credit”) to respond to a specific concern about the impact of tax and transfer programs on the state’s working poor. A 1997 analysis of Minnesota welfare recipients had found that an increase in wages or hours beyond full-time minimum-wage work did not necessarily make families better off than they were when earning the minimum wage. The reason was that over certain income ranges, additional earnings brought increased taxes and triggered a loss in cash assistance and food stamps. This became known as the “no net gain” problem.
The solution was to build into the state EITC an additional phase-in range for families facing higher taxes and loss of assistance due to higher earnings. The Minnesota credit is the same as it would be if it were simply set at 25 percent of the federal credit up to about $13,000 in income. At an income of $13,000, the federal credit plateaus for families with two or more children and then begins to decline in value as their income exceeds about $17,000 for single parent families and $22,000 for married couple families. Unlike the federal credit, however, the Minnesota credit plateaus for families with incomes between $13,000 and $19,000 and then increases in value until income reaches about $22,000. The credit plateaus again until income reaches $23,000 for single parent families and $26,000 for married couple families, at which point the credit begins to phase out.
The Minnesota credit is not completely decoupled from the federal credit. The credit for workers without children remains set at a flat rate of 25 percent of the federal credit. Eligibility rules still follow the federal eligibility rules, and the maximum income a family may have to qualify for the credit is the same as the federal maximum.
If the credit were non-refundable, the family’s $80 income tax liability would still be eliminated. The remaining $120 of the credit, however, would be forfeited.
The distinction between refundable and non-refundable credits is important because families with very low earnings, such as most families moving off welfare, owe little or nothing in state income taxes in many states. These families thus would receive little or no benefit from a non-refundable EITC. Moreover, because it only can offset taxes owed, a non-refundable EITC does not supplement a family’s income above its earnings and thus does not lift any families with below-poverty wages out of poverty. A refundable EITC, by contrast, can be used to boost the incomes of low-income working families, including those making the transition from welfare to work, as the federal EITC does. Making a state EITC refundable also allows it to be used to offset sales and excise taxes paid by low-income families. In addition, a refundable credit can be financed in part with federal welfare block-grant funds; this option is discussed in the next chapter.
The importance of refundability is reflected in the decision of most states to make their EITCs refundable. Only three of the states with an EITC — Delaware, Maine, and Virginia — have enacted non-refundable credits.
Setting the Size of a State EITC
Choosing the percentage of the federal EITC at which the state credit is set should be based on several considerations. One consideration is the cost to the state treasury. Another is the level of state income tax relief desired. A third factor is the size of the desired income boost for poor families that qualify for a refund. The state may wish, for example, to enact a credit that lifts particular types of families above the poverty line.
EITCs in states with refundable credits generally range from 3.5 percent to 40 percent of the federal credit. The two exceptions are the credits in Wisconsin and Minnesota. The Wisconsin EITC, as discussed below, ranges from 4 percent of the federal credit for families with one child to 43 percent of the federal credit for families with three or more children. The Minnesota EITC, which is structured in part independently of the federal credit, effectively ranges from 25 percent to 45 percent of the federal credit, averaging about 33 percent.
Table 6 shows the benefit to families at various levels of earnings of a refundable EITC set at 15 percent or 25 percent of the federal credit. For example, a family of four with two children and one minimum-wage worker qualifies for a federal EITC of $5,160 in 2011. If the family lives in a state with a 25 percent state EITC, the family receives a state credit of $1,290 ($1,290 equals 25 percent of $5,160). If the state credit is set at 15 percent of the federal credit, the family’s state credit is $774 (15 percent of $5,160).
Adjustments for Family Size
A state EITC may be designed to provide greater adjustment for family size than is provided by the federal credit. Under the Recovery Act and the recent extension of its EITC provisions, the federal EITC provides a higher maximum benefit to families with three or more children than to families with two children, about $700 higher. The federal EITC benefit for families with two children is about $2,000 higher than that for families with just one child. If the Recovery Act expansions to the federal EITC are not made permanent, families with three or more children will be treated the same as families with two children, despite their higher levels of poverty and costs of living.
| Table 4: Earned Income Tax Credit Amounts By Family Income Levels, 2011 | ||||
| Gross Earnings | Federal EITC | 25% State EITC | 15% State EITC | |
| Family of four with two children | ||||
| Half-time minimum wage | $7,540 | $3,016 | $754 | $452 |
| Full-time minimum wage | $15,080 | $5,160 | $1,290 | $774 |
| Wages equal federal poverty line | $22,578 | $5,032 | $1,258 | $755 |
| Wages equal 150% of poverty line | $33,867 | $2,654 | $664 | $398 |
| Family of three with one child | ||||
| Half-time minimum wage | $7,540 | $2,564 | $641 | $385 |
| Full-time minimum wage | $15,080 | $3,121 | $780 | $468 |
| Wages equal federal poverty line | $17,920 | $3,121 | $780 | $468 |
| Wages equal 150% of poverty line | $26,880 | $2,337 | $584 | $351 |
| Source: Center on Budget and Policy Priorities. | ||||
Because wages do not adjust for family size, larger low- and moderate-income working families often fall further below an adequate standard of living than smaller families with the same number of workers. Adjusting a state EITC for family size beyond the federal family-size adjustment can help larger working families keep pace with the cost of basic living expenses.
In most states with an EITC, the state EITC is set at the same percentage of the federal credit for all family sizes. In these states, the state EITC does not alter the family-size differential in the federal credit.
Wisconsin takes a different approach and varies its state EITC by family size. The Wisconsin EITC is set at four percent of the federal credit for families with one child, 14 percent for families with two children, and 43 percent of the federal credit for families with three or more children. This approach directs a greater share of EITC benefits to large families, while adding only modestly to the credit’s complexity. Because large families are a modest share of all EITC-eligible families, Wisconsin’s approach does not necessarily make the credit more costly. The average Wisconsin EITC benefit is roughly 18 percent of the federal credit, a level well within the range of other refundable state EITCs.
Workers Without Qualifying Children
Another decision that must be made in designing a state EITC is whether or not to extend the credit to low-income workers who do not have a qualifying child living with them. Such workers between the ages of 25 and 64 were made eligible for a modest federal EITC for the first time as part of the 1993 expansion.
On one hand, workers without qualifying children generally receive only small amounts from a state EITC. For example, in a state with an EITC established at 15 percent of the federal credit, the maximum state credit for a worker without a qualifying child is $69. Some low-income workers without a qualifying child may not make the effort to claim the credit if they owe no state income tax and are not otherwise required to file a state tax return. Because their benefits are small, however, the cost of including workers without qualifying children in a state EITC also is likely to be small. For people struggling to get by, even a small credit can be helpful.
Local Earned Income Tax Credits
Like states, local governments may enact Earned Income Tax Credits. Three major local governments — Montgomery County, Maryland, San Francisco, California and New York City — presently are offering such credits.
- Montgomery County, Maryland – A large suburban county adjoining the District of Columbia, Montgomery County enacted a refundable EITC in 1999. The credit was enacted in response to growing concerns about the large number of working poor families in the county and the difficulty of making ends meet in a jurisdiction with a high cost of living. The credit equals the state’s refundable credit, which in 2005 equaled 20 percent of the federal credit.
Unlike most localities nationwide, Maryland’s counties levy their own income taxes. It should be noted, however, that having a local EITC does not depend on the local jurisdiction having an income tax. Initially, the state sent EITC checks to Montgomery County residents who claimed the state credit and the county reimbursed the state. Currently, the credit is administered as part of the state’s tax form. These methods could work for any county or city in a state that has a state EITC. In FY2005, 20,700 Montgomery County taxpayers received credits for an average credit of $380.
- San Francisco, California – Available starting in tax year 2004, the City of San Francisco launched a city-level, refundable EITC. The credit was set between 10% and 12% of the federal credit depending on the amount of funding available. Eligible recipients complete a short form that is sent to City Hall. Recipients receive their credits through the mail. In its first year of the credit, almost 11,000 persons applied for the credit, totaling about $2.25 million. The credit was later reduced to a flat benefit of $100 regardless of income or family size. However, eligibility for the credit continues to be based on federal guidelines (Note that the state of California does not have an EITC.)
- New York City – Available starting in tax year 2004, the City of New York offers a tax credit applied to New York City income tax. The tax credit is set at 5% of the federal credit and is refundable. Eligible taxpayers complete a city EITC form as part of their city income tax filing.
Ease of administration is another factor in the decision of whether or not to include workers without a qualifying child in a state EITC. Excluding such workers requires additional instructions on state tax forms, and increases the likelihood of confusion among childless filers, who may claim the credit based on their eligibility for the federal credit. At the same time, states may face an increase in the number of returns they must process if a refundable state EITC is extended to these residents, since federal EITC recipients without qualifying children have very low incomes and in many states owe no income tax.
At present, Wisconsin is the only state in which workers without qualifying children are excluded by statute from the refundable EITCs.
IV. Financing a State Earned Income Credit
State EITCs have been financed in a variety of ways, including with surplus General Fund dollars available due to revenue growth; additional revenue generated by tax increases; or funds freed up by forgoing other less well-targeted tax cuts. For example, states that are considering enacting a tax increase to cope with a shortfall in revenues may choose to enact an EITC to offset the burden of that tax increase on low-income families. Another option for financing part of the cost of a refundable state EITC is to use funds made available through the federal welfare block grant (this option is discussed later on). It is important for policymakers considering a state-level EITC to know its cost, which can be estimated by using the simple three-step process outlined below.
Estimating the Cost of a Refundable State EITC
The Center’s methodology for estimating the cost of a state EITC employs two data sources. First, Internal Revenue Service statistics on the value of all federal EITC claims filed by residents of each state are used to determine the state’s share of total U.S. EITC claims. The most recent full-year data, shown in the second column of Table 1, are for claims made for the 2008 tax year. [25]
Second, projections by the congressional Joint Committee on Taxation (JCT) of the future cost of the federal EITC provide a base for estimating the cost of a state EITC. For fiscal year 2012, the JCT estimates that the federal EITC will cost some $54.1 billion, including both the tax expenditure (non-refundable) and outlay (refundable) portions. [26]
Using these data, the cost of a refundable state EITC is relatively easy to estimate.
Step 1: Estimate the total value of federal EITC claims in a given state for a future fiscal year.
To estimate the total value of the federal EITC in a state in a future fiscal year, we first use the IRS data on EITC claims to divide the value of EITC claims in a given state by the value of all U.S. EITC claims. This percentage is the share of the federal EITC cost attributable to that state in the base year (2008). Then, to estimate the cost of the federal EITC in the state for a future year, we apply that percentage to the JCT’s projected total cost of the federal EITC for the chosen year. For example, for tax year 2008, Alabama EITC claims were $1.24 billion, or 2.44 percent of the nationwide total. Assuming that Alabama’s share of federal EITC claims remains constant, Alabama’s federal EITC claims in fiscal year 2012 would be 2.44 percent of $54.1 billion, or $1.32 billion, as shown in the fourth column of Table 1.
Step 2: Multiply the expected value of the state’s federal EITC claims by the percentage at which the state credit is to be set.
Most states’ EITCs provide benefits as a set percentage of what the federal program pays. This percentage generally ranges from 3.5 percent to 40 percent, depending on the state. To estimate the cost of a state EITC, multiply the federal EITC cost for the state, as determined in Step 1, by the percentage at which the state EITC is to be set. This calculation yields an estimate of what the state credit would cost in a given fiscal year if everyone who received the federal credit also received the state credit.
Step 3: Adjust the estimate for the fact that not all federal EITC claimants will claim the state credit.
In practice, a substantial portion of those who receive the federal EITC fail to claim state EITCs. This is especially true in the first few years after a state credit is enacted, when awareness of it may be limited. [27] In addition, some eligible families have the IRS compute their federal credit and may not receive a state EITC if the state does not compute the state credit amount for them. For these and other reasons, the cost of a refundable state EITC, especially in its initial years, is likely to be lower than the full cost of the federal credit multiplied by the state percentage. To account for this, the cost estimate should be reduced by at least 10 percent.
The Results
The estimated fiscal year 2012 costs to states of implementing a refundable EITC for tax year 2011 set at 5, 10, or 20 percent of the federal credit are shown in the last three columns of Table 1. Other percentages may be calculated based on those numbers (for instance, the cost of a 15 percent credit would be one-and-a-half times the cost of a 10 percent credit) and the methodology outlined above may be used for other years using the projections of federal cost presented in Table 1.
None of these figures includes the costs of changing tax forms to include a space to claim an EITC, or the costs of processing and administering EITC claims; these are likely to increase the overall cost of the credit by less than 1 percent. The estimates presented here apply only to credits that are refundable and that are set at a flat percent of the federal EITC.
| Table 5: Estimated Cost of Refundable State Earned Income Tax Credits | |||||||
| State | Amount of Federal EITC Claims, TY 2008 ($ millions) | Percent of Total U.S. EITC Claims, TY 2008 | Estimated Cost of Federal EITC in FY 2012 ($ millions) | Estimated Cost of State EITC in FY 2012 | |||
| Set at 5% of Federal Credit* ($ millions) | Set at 10% of Federal Credit* ($ millions) | Set at 20% of Federal Credit* ($ millions) | |||||
| Alabama | 1,236,759 | 2.44% | 1,320 | 59 | 119 | 238 | |
| Alaska | 61,815 | 0.12% | 66 | 3 | 6 | 12 | |
| Arizona | 1,001,197 | 1.97% | 1,069 | 48 | 96 | 192 | |
| Arkansas | 655,575 | 1.29% | 700 | 31 | 63 | 126 | |
| California | 5,481,142 | 10.81% | 5,851 | 263 | 527 | 1,053 | |
| Colorado | 563,786 | 1.11% | 602 | 27 | 54 | 108 | |
| Connecticut | 345,990 | 0.68% | 369 | 17 | 33 | 66 | |
| Delaware** | 128,227 | 0.25% | 137 | 6 | 12 | 25 | |
| Florida | 3,825,237 | 7.54% | 4,084 | 184 | 368 | 735 | |
| Georgia | 2,339,271 | 4.61% | 2,497 | 112 | 225 | 450 | |
| Hawaii | 172,619 | 0.34% | 184 | 8 | 17 | 33 | |
| Idaho | 232,570 | 0.46% | 248 | 11 | 22 | 45 | |
| Kentucky | 768,208 | 1.51% | 820 | 37 | 74 | 148 | |
| Maine** | 166,539 | 0.33% | 178 | 8 | 16 | 32 | |
| Mississippi | 963,186 | 1.90% | 1,028 | 46 | 93 | 185 | |
| Missouri | 980,059 | 1.93% | 1,046 | 47 | 94 | 188 | |
| Montana | 141,891 | 0.28% | 151 | 7 | 14 | 27 | |
| Nevada | 373,849 | 0.74% | 399 | 18 | 36 | 72 | |
| New Hampshire | 119,381 | 0.24% | 127 | 6 | 11 | 23 | |
| North Dakota | 73,092 | 0.14% | 78 | 4 | 7 | 14 | |
| Ohio | 1,780,167 | 3.51% | 1,900 | 86 | 171 | 342 | |
| Pennsylvania | 1,611,545 | 3.18% | 1,720 | 77 | 155 | 310 | |
| South Carolina | 1,025,672 | 2.02% | 1,095 | 49 | 99 | 197 | |
| South Dakota | 112,124 | 0.22% | 120 | 5 | 11 | 22 | |
| Tennessee | 1,307,355 | 2.58% | 1,396 | 63 | 126 | 251 | |
| Texas | 5,517,268 | 10.88% | 5,890 | 265 | 530 | 1,060 | |
| Utah | 320,501 | 0.63% | 342 | 15 | 31 | 62 | |
| Virginia** | 1,076,990 | 2.12% | 1,150 | 52 | 103 | 207 | |
| West Virginia | 287,082 | 0.57% | 306 | 14 | 28 | 55 | |
| Wyoming | 59,426 | 0.12% | 63 | 3 | 6 | 11 | |
| Other | 55,063 | 0.11% | 59 | 3 | 5 | 11 | |
| States That Have Enacted Refundable EITCs | |||||||
| DC | 94,078 | 0.19% | 100 | ||||
| Illinois | 1,979,163 | 3.90% | 2,113 | ||||
| Indiana | 998,418 | 1.97% | 1,066 | ||||
| Iowa | 358,193 | 0.71% | 382 | ||||
| Kansas | 372,693 | 0.73% | 398 | ||||
| Louisiana | 1,223,396 | 2.41% | 1,306 | ||||
| Maryland | 722,374 | 1.42% | 771 | ||||
| Massachusetts | 622,413 | 1.23% | 664 | ||||
| Michigan | 1,526,648 | 3.01% | 1,630 | ||||
| Minnesota | 548,208 | 1.08% | 585 | ||||
| Nebraska | 233,344 | 0.46% | 249 | ||||
| New Jersey | 1,049,299 | 2.07% | 1,120 | ||||
| New Mexico | 426,626 | 0.84% | 455 | ||||
| New York | 3,241,226 | 6.39% | 3,460 | ||||
| North Carolina | 1,818,663 | 3.59% | 1,942 | ||||
| Oklahoma | 673,746 | 1.33% | 719 | ||||
| Oregon | 463,283 | 0.91% | 495 | ||||
| Rhode Island | 148,347 | 0.29% | 158 | ||||
| Vermont | 68,657 | 0.14% | 73 | ||||
| Washington | 725,169 | 1.43% | 774 | ||||
| Wisconsin | 642,777 | 1.27% | 686 | ||||
| U.S. Total | 50,720 | 100.00% | 54,147 | ||||
| * Estimates of state EITCs assume participation rate equal to 90% of federal participation. ** Delaware, Maine, and Virginia already offer non-refundable credits. Since the cost shown is the total cost of a refundable credit, the added cost of making the credit refundable in these states would be substantially less. Source: State claims taken from IRS Statistics of Income Bulletin, Tax Year 2008: Historical Table 2, May 2010. FY 2012 cost calculated based on Joint Committee on Taxation estimates of federal tax expenditures. | |||||||
Financing State EITCs through the Temporary Assistance for Needy Families Block Grant
One-third of states finance a portion of the cost of their state EITC’s by using federal funds from the Temporary Assistance for Needy Families block grant, or by counting some state funds expended for an EITC toward meeting the “maintenance of effort” (MOE) required under TANF. For 2009, the most recent year for which data are available, 17 states and the District of Columbia used TANF or MOE funds (or both) for some of the refundable portion of the state’s EITC. This number is higher than in past years. [28]
How It Works
Under federal regulations, states may use TANF or MOE funds only for the portion of an EITC that provides a refund in excess of tax liability and only for families with children. EITC benefits financed with TANF funds are not considered “assistance” under TANF rules; this means the federal “time limit” (the requirement that most adult welfare recipients may not receive federally-funded welfare payments for more than 60 months in their lifetimes) and the requirement that families assign their child support rights do not apply to EITC benefits funded with TANF. In addition, the TANF work participation requirements do not extend to those receiving only TANF-funded EITC payments and, thus, when a state’s TANF work participation rate is calculated to determine if the state has the required proportion of TANF assistance recipients engaged in work activities, families receiving only TANF-funded EITC payments are not considered.
Some states have used the surplus TANF funds that became available when welfare caseloads declined in the late 1990s to create or expand EITC’s to help families enter and remain in the workforce. At that time, financing a portion of a refundable EITC with TANF or MOE funds was an attractive option.
But the situation now has changed, because today, very few states have TANF surpluses. This is because, with very minor exceptions, each state gets the same TANF block grant today as it received in the mid-1990s. Since then, inflation has eroded the value of the TANF block grant, joblessness resulting from the recession has made more people in need of cash assistance and other services, and states have committed portions of their TANF grants to other purposes such as child care and child welfare. There are more demands on a shrinking pot of funds.
In other words, the fact that refundable EITCs are a permissible use of welfare funds under the federal law does not mean that TANF funds are always an appropriate financing mechanism for states considering new EITCs or EITC expansions.
Maintaining Funding in the Face of Shrinking Federal Funds
The number of states that are using TANF or MOE funds to provide a portion of the EITC has grown in recent years. Some states created a new refundable EITC; others expanded the amount of the benefit; and some newly claimed their existing EITC as state MOE or TANF spending. The American Recovery and Reinvestment Act created a TANF Emergency Fund that reimbursed states for 80 percent of increased spending on state EITCs (as a type of short-term non-recurrent benefit) in 2009 and 2010. But that Emergency Fund has now expired.
To a significant degree, the use of TANF funds to pay for state EITCs was an artifact of state budget-office decisions on how a state can maximize federal dollars, rather than a deliberate policy decision as to how TANF dollars can best assist low-income families.
When federal dollars were more plentiful, it made sense to utilize state EITCs to draw them down. Now that federal dollars have declined, it does not necessarily mean that states must either cut back on their EITCs or cut other TANF-funded services and assistance. Rather, it may mean that states must revert to using their own general fund dollars to finance both the refundable and non-refundable shares of the credit, as was the original intent in most states that enacted EITCs.
Of course, if an EITC is funded through the general fund, it may be susceptible to cutbacks as states consider strategies for balancing their budgets in the face of record revenue shortfalls. However, it is entirely appropriate for states to look at all the credits, exemptions, and deductions that exist in the tax code – not just the EITC – to determine whether those provisions are important to achieving a state’s policy goals.
State tax codes include many costly state tax preferences that are obsolete or ineffective. In such cases, funds would be better spent on an EITC--a policy with a proven track record. The extensive body of research documenting the success of EITCs, combined with the high importance to states of helping working families with children get ahead in today’s challenging economic climate, suggests that many states are likely to choose to continue to preserve their state EITCs.
End Notes
[2] An adult is counted as a worker only if she or he worked 14 weeks or more per year.
[3] The cost of basic necessities in various parts of the country for families with children is documented in Sylvia A. Allegretto, Basic Family Budgets, Economic Policy Institute Briefing Paper #165, September 1, 2005.
[4] The EITC is available to both single-parent and two-parent families with children. Two-parent families can receive the EITC whether both parents work or whether one parent works while the other parent stays home to care for the children, so long as the family’s income is below the EITC limit.
[5] The 2011 federal poverty line is about $23,000 for a family of four.
[6] The Recovery Act expanded a number of tax credits for working families. Congress extended the Recovery Act’s expansions of the EITC and Child Tax Credit (CTC); as a result, the expansions will remain in place through 2012. If the expansions are not made permanent, the effectiveness of the federal EITC in reducing poverty and supplementing wages will be lessened.
[7] The calculations of payroll tax in this analysis do not include the portion of the payroll tax paid directly by the employer that matches the employee’s share; the employee and employer each pay 7.65 percent of earnings. Although the employer share of the tax is not reflected in workers’ nominal earnings — in this case $12 an hour — economists generally hold that both the employer and employee share of the payroll tax are in effect reductions in employee wages. The history of the EITC indicates it was designed specifically to offset both shares of the payroll tax.
[8] As in the preceding example, the calculation of payroll taxes does not include the employer share of payroll taxes.
[9] This calculation reflects earnings of $15,080, minus $1,154 for the employee share of payroll tax, plus the $3,121 EITC and the $1,000 child tax credit. (The federal child tax credit is refundable up to 15 percent of a family’s earnings above $3,000. Prior to the Recovery Act, the earnings threshold was set at $10,000.) This income measurement differs from the measurement used by the Census Bureau in its official poverty calculations. The official federal poverty threshold is based on cash income; both earned and unearned, but does not include the value of in-kind benefits or the effects of taxes on disposable income. Nevertheless, many analysts agree that the payroll taxes and EITC benefits should be counted in addition to wages for the purpose of determining how far a family with a full-time minimum wage worker falls below the poverty line.
[10] Center simulation of 2009 policies using Census data from the March 2004-2006 Current Population Surveys and other sources. For a description of the methods used, see Arloc Sherman, “Stimulus Keeping 6 Million Americans Out of Poverty in 2009, Estimates Show,” September 9, 2009.
[11] Timothy M. Smeeding, Katherin E. Ross, and Michael O’Connor, “The EITC: Expectation, Knowledge, Use, and Economic and Social Mobility,” National Tax Journal, December 2000.
[12] David Rothstein, Who Takes Credit? Earned Income Tax Credit Recipients in Cleveland., Policy Matters Ohio, November 2005.
[13] For more information see “Promoting Asset Building Through the Earned Income Tax Credit,” State IDA Policy Briefs, Vol. 1, No. 1, Center for Social Development and Corporation for Enterprise Development.
[14] M. Schreiner, M. Clancy, & M. Sherraden, Saving performance in the American Dream Demonstration, St. Louis, MO: Washington University in St. Louis, Center for Social Development, 2002.
[15] San Francisco’s credit eligibility is based on federal eligibility guidelines, but the credit is a flat amount per filer ($100).
[16] Center on Budget and Policy Priorities, The Impact of State Income Taxes on Low-Income Families in 2009, April 2010. This report is updated annually.
[17] Institute on Taxation and Economic Policy, Who Pays?: A Distributional Analysis of the Tax Systems in All 50 States, 3rd Edition, November 2009, p. 118.
[18] See Gregory Acs and Pamela Loprest, TANF Caseload Composition and Leavers Synthesis Report, Urban Institute, March 28, 2007; U.S. General Accounting Office, Welfare Reform: Information on Former Recipients’ Status, April 1999; Sarah Brauner and Pamela Loprest,Where Are They Now? What States' Studies of People Who Left Welfare Tell Us, Urban Institute, May 1999; and Sharon Parrott, Welfare Recipients Who Find Jobs: What Do We Know About Their Employment and Earnings?, Center on Budget and Policy Priorities, November 1998.
[19] CBPP calculations of Congressional Budget Office data.
[20] Full-time work is defined here as 40 hours per week, 50 weeks per year.
[21] This estimate of the “poverty gap” and the one that follows do not include the value of food stamps, which are nearly equivalent to cash, because many working-poor families do not receive food stamp benefits. According to the USDA about half of working families that are eligible for Food Stamps are not receiving them.
[22] “POV24. Reason For Not Working or Reason For Spending Time Out of the Labor Force-Poverty Status of People Who Did Not Work or Who Spent Time Out of the Labor Force.” U.S. Census Bureau http://www.census.gov/hhes/www/cpstables/032009/pov/new24_100_01.htm .
[23] This example does not include cash assistance a family may receive either while working or unemployed. In a majority of states, such a family would be ineligible for cash assistance while the parent is working. If the parent received cash assistance during a period of unemployment, the typical state’s welfare benefits would fail to make up for the lost wages, leaving the family well below poverty for the year.
[24] Unlike other states, Iowa uses 2008 federal guidelines (adjusted for inflation) to determine eligibility for the state credit. This means that the EITC changes enacted under the Recovery Act (described in Chapter II above) do not carry through to this state’s EITC.
[25] All but a tiny fraction of federal EITCs for a given year are claimed and paid when taxes are filed in January through April of the following year. As a result, nearly all of the federal cost for tax year 2011 EITCs will be incurred in federal fiscal year 2012, which ends September 30, 2011. Similarly, in most states the cost of tax year 2011 claims will fall in the state fiscal year that ends in 2012.
[26] Estimates of the future cost of the federal EITC come from the Joint Committee on Taxation’s “Estimates of Federal Tax Expenditures for Fiscal Years 2009-2013,” and “Estimated Budget Effects of the Revenue Provisions Contained in the President's Fiscal Year 2011 Budget Proposal.” The federal EITC for tax years 2009 and 2010 was expanded in the 2009 American Recovery and Reinvestment Act and extended to 2011 and 2012 by Congress, thereby slightly raising the cost.
[27] Compared to the cost each state would have incurred if every family claiming the federal credit also claimed the state credit, the actual cost of a newly enacted state EITC in its first year of availability was about 81 percent in Vermont, 83 percent in New York, 85 percent in Wisconsin, 88 percent in Oklahoma, 90 percent in Kansas and Minnesota, 91 percent in Colorado, and 97 percent in Massachusetts. In the second year of availability in each state, the cost in Vermont rose to 85 percent, the cost in New York rose to 90 percent, and the cost in Minnesota rose to 93 percent relative to the full-participation cost.
[28] These states include Illinois, Indiana, Iowa, Kansas, Maryland, Massachusetts, Minnesota, Michigan, Nebraska, New Jersey, New Mexico, New York, North Carolina, Rhode Island, Vermont, and Wisconsin. Colorado also counts back-filed EITC claims toward its MOE requirements (the state’s credit was suspended in 2002).
More from the Authors

Areas of Expertise