Tax Data Show Richest 1 Percent Took a Hit in 2008, But Income Remained Highly Concentrated at the Top
Recent Gains of Bottom 90 Percent Wiped Out
The Piketty-Saez data has been updated. An analysis of the new data as of March 7, 2012 can be found here: https://www.cbpp.org/cms/index.cfm?fa=view&id=3697.
An analysis of recently released IRS data on pre-tax income by economists Thomas Piketty and Emmanuel Saez [1] shows that:
- The average income of the top 1 percent of households fell by 20 percent from 2007 to 2008, after adjusting for inflation, wiping out almost half of the gains this group achieved between 2002 and 2007 (see Figure 1). Image
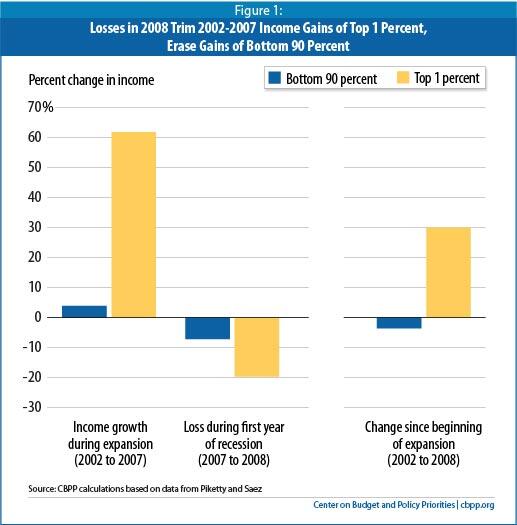
- The average income of the bottom 90 percent of households fell 7 percent from 2007 to 2008, in inflation-adjusted dollars, the largest one-year drop for this group since 1938. The loss in 2008 more than wiped out the increase from 2002 to 2007, leaving the average income for the bottom 90 percent of households at its lowest level since 1996.
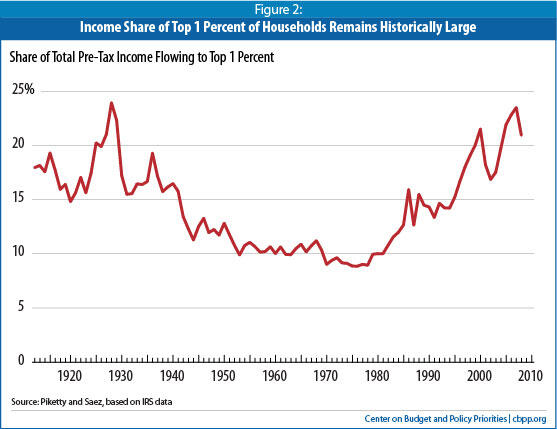
- Income remained highly concentrated, with the top 1 percent of households receiving 21 percent of total income, which is somewhat below recent peaks but still among the highest percentages since the late 1920s.
High Concentration Persists at the Very Top
Piketty and Saez’s unique data series on income inequality, based on IRS files, is particularly valuable because it provides detailed information on income gains at the top of the income scale and extends back to 1913.[2] These data show that in the past decade, income concentration has reached levels last seen over 80 years ago (see Figure 2).
Two-thirds of the nation’s total income gains in the economic expansion from 2002 to 2007 flowed to the top 1 percent of U.S. households, and that top 1 percent held a larger share of income in 2007 than at any time since 1928. During those years, the real (inflation-adjusted) income of the top 1 percent of households grew more than ten times faster than the income of the bottom 90 percent of households. [3]
The gains for the top one one-hundredth of 1 percent (0.01 percent) of U.S. households were even more dramatic. The average annual income of that small group rose by 123 percent — or $20 million per household — from 2002 to 2007 (see Table 1). Even after incurring large losses in 2008, the wealthiest 0.01 percent of households held 5 percent of total income — about the level reached at the peak of the last expansion in 2000, and higher than the prior peak in 1928.
| TABLE 1: Average Income Gains, Adjusted for Inflation | ||||||
| Income Gain During Expansion (2002 to 2007) | Loss During First Year of Recession (2007 to 2008) | Change Since Beginning of Expansion (2002 to 2008) | ||||
| Bottom 90 percent | $1,250 | 4% | -$2,420 | -7% | - $1,170 | -4% |
| Top 1 percent | $541,140 | 62% | -$279,200 | -20% | $261,930 | 30% |
| Top 0.01 percent | $20,072,720 | 123% | -$9,045,980 | -25% | $11,026,750 | 68% |
| Note: In 2008, the bottom 90 percent of households were those with incomes below about $110,000. The top 1 percent were those with incomes above about $370,000, and the top 0.01 percent were those with incomes above about $9,140,000. Calculations are in current 2008 dollars. | ||||||
Such disproportionate growth helps explain why after the first year of the worst recession since the 1930s, households at the top of the income distribution still had incomes higher than in 2002, while households in the bottom 90 percent of the distribution lost all gains from the recent expansion and had the lowest incomes they have seen in over a decade.
Longer-Term Trends in Income Concentration
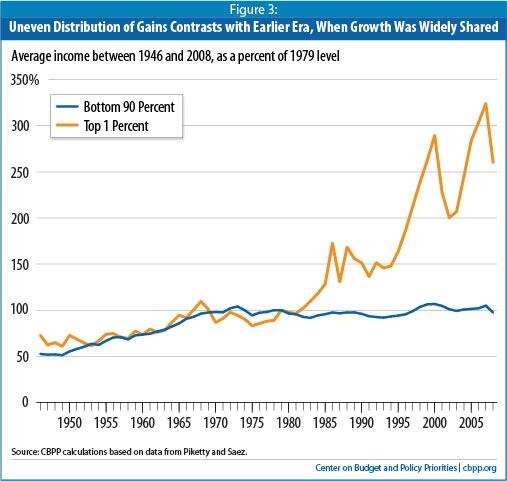
The uneven distribution of economic gains in recent years continues a longer-term trend that began in the late 1970s. In the generation following World War II, robust economic gains were shared widely, with the incomes of the bottom 90 percent actually increasing more rapidly in percentage terms, on average, than the incomes of the top 1 percent. But since the late 1970s, the incomes of the bottom 90 percent of households have essentially stagnated while the incomes of the top 1 percent have soared. (See Figure 3.)
In fact, the average pre-tax income for the bottom 90 percent of households is almost $900 below what it was in 1979, while the average pre-tax income for the top 1 percent is over $700,000 above its 1979 level.[4]
With the latest IRS data, we now have both a complete picture of income concentration during the recent economic expansion, which ended in December 2007, and a glimpse of the recession’s effects on income concentration. Based on national income and product account data and other indicators, Saez predicts that next year's analysis will show that top incomes fell modestly in 2009.[5]
It remains to be seen whether the highest-income households will again capture a highly disproportionate share of income gains as the economy begins to recover, as they did after the dot.com collapse and subsequent 2001 recession (see Figure 3). Saez notes, however, that historically income concentration tends to bounce back after economic downturns unless major policy changes — such as those enacted during the New Deal — occur. So it would not be surprising, in the absence of significant policy or behavioral changes, for income concentration to return to recent levels and continue rising after the current recession ends.
End Notes
[1] Piketty and Saez rely on detailed Internal Revenue Service micro-files for available years, extending the full series to 1913 using aggregate data and statistical techniques. Their July 2010 revision incorporates the detailed micro-files for 2008 that have recently become available. For details on their methods, see Thomas Piketty and Emmanuel Saez, “Income Inequality in the United States: 1913-1998,” Quarterly Journal of Economics, February 2003, or, for a less technical summary, see http://elsa.berkeley.edu/~saez/saez-UStopincomes-2007.pdf. Their most recent estimates are available at http://elsa.berkeley.edu/~saez/TabFig2008.xls.
[2] The IRS data used by Piketty and Saez have some limitations, one of the most important of which is that they do not include people who do not file income tax returns. These people are included in the data used by the Census Bureau in its annual calculation of median household income, but the Census data have incomplete information about income at the very top of the distribution. Also, neither Piketty-Saez nor Census adjusts incomes for family size, which can distort trends when average family size is changing over time. The Congressional Budget Office publishes an analysis combining the data used by Piketty-Saez and Census to estimate average federal tax rates paid by households in various income categories, as well as before- and after-tax household income adjusted for family size. CBO thus provides the most comprehensive analysis of income distribution, but is not as timely as the Piketty-Saez analysis. The most recent CBO report uses 2007 data and provides historical data only back to 1979. (See http://www.cbo.gov/publications/collections/collections.cfm?collect=13.)
[3] The last economic expansion began in November 2001 and ended in December 2007. However, the real income of the top 1 percent of households did not reach a trough until 2002 and that of the bottom 90 percent until 2003. For the purposes of this paper, we measure income growth between 2002 and 2007. If we had chosen 2001 as the base year, the share of income gains accruing to the top 1 percent of households would have been 76 percent and that of the bottom 90 percent of households would have been 2 percent. If we had chosen 2003, those respective shares would have been 59 percent and 20 percent.
[4] As discussed earlier, the Piketty-Saez data are particularly useful for analyzing long-term trends at the very top of the income distribution. They have some limitations for the bottom 90 percent, however, an important one of which is that they do not include households that do not file income tax returns. Other data sources show modestly larger or smaller gains for the bottom 90 percent, but all show a sharp discrepancy in income growth between the top 1 percent of households and everyone else.
[5] Emmanuel Saez, “Striking It Richer: The Evolution of Top Incomes in the United States,” Pathways Magazine, Stanford Center for the Study of Poverty and Inequality, Winter 2008 (updated July 17, 2010), http://elsa.berkeley.edu/~saez/saez-UStopincomes-2008.pdf.
More from the Authors

Areas of Expertise