TANF Benefits Are Low and Have Not Kept Pace With Inflation
Benefits Are Not Enough to Meet Families’ Basic Needs
TANF cash assistance programs provide critical income support to some of the nation’s most vulnerable families with children. How well these programs do at protecting children from deep poverty and material deprivation depends on both the extent to which very poor families are actually enrolled in the program and the level of benefits and quality of services the program provides. During this recession, state TANF caseloads have increased modestly in the nation as a whole, lagging far behind much larger increases in SNAP (food stamp) caseloads and in the number of unemployed. The national picture masks significant variation among states, with significant caseload increases in some states, flat or near-flat caseloads in some states, and decreased caseloads in other states.[1]
For those who do receive assistance from TANF, the benefits they receive remain quite low and are not enough to provide for basic needs. TANF benefits alone do not lift families out of deep poverty (i.e. 50 percent of the federal poverty line). In all states, TANF maximum benefit levels for a family of three are less — sometimes much less — than half of the Federal Poverty Level (FPL) and less than the HUD Fair Market rent for a two-bedroom apartment. The first purpose of TANF is to provide assistance to needy families so that children may be cared for in their own homes or those of relatives. Yet the cash assistance benefits are not sufficient to fulfill this goal.
While many states have adjusted benefits upwards since the creation of TANF in 1996, these adjustments generally have not been enough to keep pace with inflation. Moreover, in more than one-third of states, TANF benefit levels (without regard to inflation) are the same as or lower than they were in 1996. TANF benefit increases have been fewer and smaller during the recession and last year three states — Arizona, California, and Hawaii — cut TANF benefit levels by a significant amount.
Benefits Leave Families Far Below Poverty Line
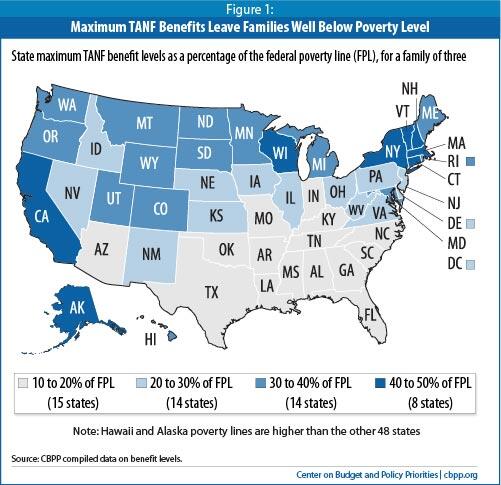
Benefit levels in state TANF programs are so low that a family cannot meet its basic needs. TANF benefit levels for a family of three, as of July 2010, are less than half of the Federal Poverty Level (FPL) in all states and below 30 percent of the FPL in over half of states. [2] (See Figure 1 and Appendix 1.)
Not only are TANF benefits low, but they also do less to help families out of extreme poverty than they did in 1996. In 2010, some 29 states have benefit levels below 30 percent of the FPL, nearly twice as many as had benefits below 30 percent of the poverty line in 1996. Moreover, in all but three states, a poor family relying solely on TANF to provide the basics for its children (such as during a period of joblessness, illness, or disability) is further below the poverty line today than in 1996.
In some cases, families can combine TANF with earned income to help meet basic needs. Nearly all states have adopted “make work pay” policies under TANF that have increased the amount of earnings that are disregarded when a recipient gets a job. Even so, families become ineligible for TANF cash assistance at very low income levels in nearly all states. Moreover, not all TANF families are able to supplement benefits with earnings; many families have parents with significant disabilities or other barriers to work and about half of TANF cases are child-only cases with no parent or caretaker relative included in the grant.[3]
TANF Benefit Levels Have Failed to Keep Pace with Inflation
Most states have adjusted their benefit levels upwards at least somewhat under TANF and many states have done so since 2005, but these increases generally have not kept pace with inflation.
- Some 31 states (including the District of Columbia) have higher TANF benefit levels (without adjusting for inflation) now than they did in 1996. Between January 2005 and July 2010, some 21 states raised their TANF benefit levels.
- In the remaining 20 states, benefit levels have been cut or have remained frozen under TANF. Four states have lower TANF benefit levels in 2010 than they did in 1996 (without adjusting for inflation). Some 16 states have the same TANF benefit levels in July 2010 as they had in 1996.
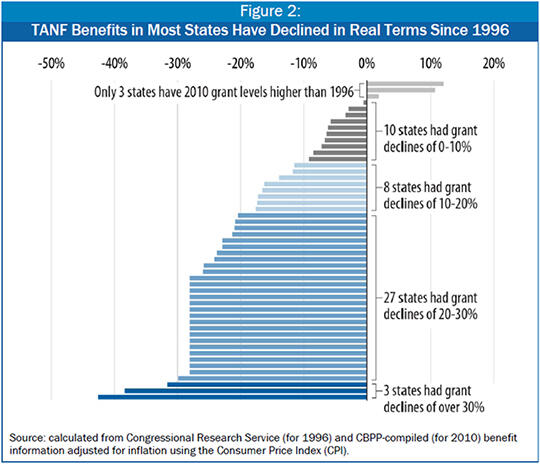
Even states that have raised benefit levels have not generally kept pace with the increased costs of basic necessities. When adjusted for inflation using the Consumer Price Index (CPI), 48 states (including DC) have lower real-dollar benefit levels now than they did in 1996. (See Figure 2 and Appendix 2.)[4]
- When adjusted for inflation, benefit levels have declined by 20 percent or more in 30 states since 1996.
- In the 16 states that have the same benefit levels now as in 1996, TANF benefits are worth 28 percent less in inflation-adjusted terms than they were in 1996.
The decline in the value of benefits under TANF follows decades of decline in real dollars of the value of Aid to Families with Dependent Children (AFDC) benefits. From 1970 to 1996, real-dollar AFDC benefit levels declined by more than 20 percent in all but one state and by more than 40 percent in two-thirds of states. [5]
TANF Benefits Are Not Sufficient to Cover Housing Costs
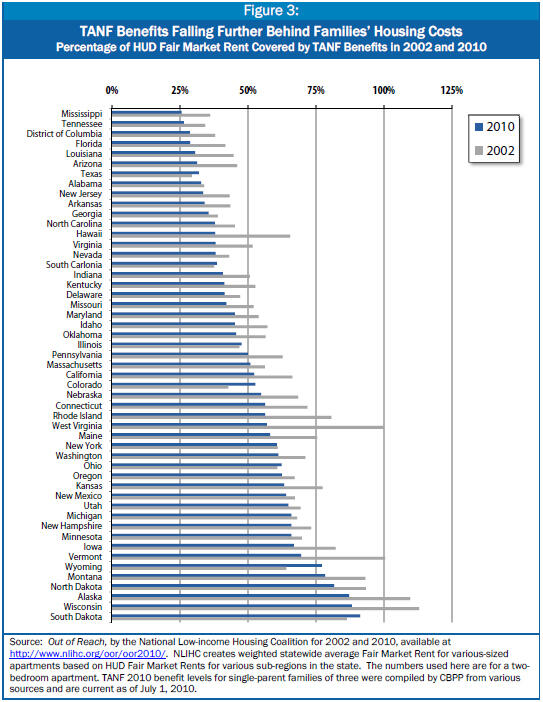
TANF benefits are a fraction of the estimated costs of housing for a family, and housing is only one of the basic needs that a family must meet with the TANF grant. In 2010, the monthly TANF benefit level for a family of three is less than the estimated cost of a two-bedroom apartment (based on HUD Fair Market Rents) in all states, and less than half of the Fair Market Rent amount in 24 states. (See Figure 3.) While some TANF families may receive housing subsidies, only one in four eligible low-income households receives federal housing assistance because of program funding limitations. [6] As TANF benefits decline in real dollars in most states, they cover a smaller share of housing costs over time, as Figure 3 shows.
SNAP Benefits Help Fill Gap, But Substantial Shortfall Remains
Even when TANF benefits are combined with food stamp (now renamed SNAP) benefits, the total benefits are below the federal poverty level in all states and less than 75 percent of the poverty line in over 40 states. (See Figure 4.) In nearly all states, the gap between combined TANF and SNAP benefits and the poverty line is substantial.
Moreover, the SNAP benefit levels used for this comparison are temporarily increased due to a provision in the Recovery Act; this increase will abate over the next few years and end in federal fiscal year 2014, leaving TANF families further below the poverty level. In addition, the estimated SNAP benefit levels used for this comparison likely overstate the amount of help from SNAP that many TANF families in a state will receive. [7]
The Recession, the Recovery Act, and TANF Benefit Levels
Some 48 states faced budget shortfalls in 2010 and, for over half of these states, the amount of the shortfall was over 20 percent of the state budget.[8] States are facing the worst revenue decline on record just as demand for state services, including assistance through the TANF program, is rising. TANF caseloads increased in all but six states between the start of the recession in December 2007 and December 2009.
Under the TANF block grant, states receive a fixed amount in federal funds each year (that amount has not changed since 1996); states are also required to maintain a level of state expenditures based on historic state spending. Federal TANF and state maintenance-of-effort (MOE) funds can be broadly used to meet any of the four purposes set forth in the TANF law, and many states use these funds for a range of child care, social service, child welfare, and other state programs. In 2009, less than 30 percent of combined federal TANF and state MOE funds were spent on basic assistance. As states have increasingly used TANF and MOE funds for other state obligations, efforts to expand — or even maintain, given increased need and fiscal pressures — TANF eligibility or benefits face stiff competition.
In general, states do not get more money when TANF caseloads increase or state budgets are tight, with two key exceptions:
- The 1996 law created a $2 billion TANF Contingency Fund to provide additional funds to a state facing hard economic times. This fund was used rarely until the current recession, was used heavily in 2008 and 2009, and was depleted in December 2009 (and recently a small amount of funding was added for 2011). About one-third of states drew on the Contingency
Fund, but many other states facing tough economic climates were unable to use the fund because of its complex state maintenance-of-effort requirements.Image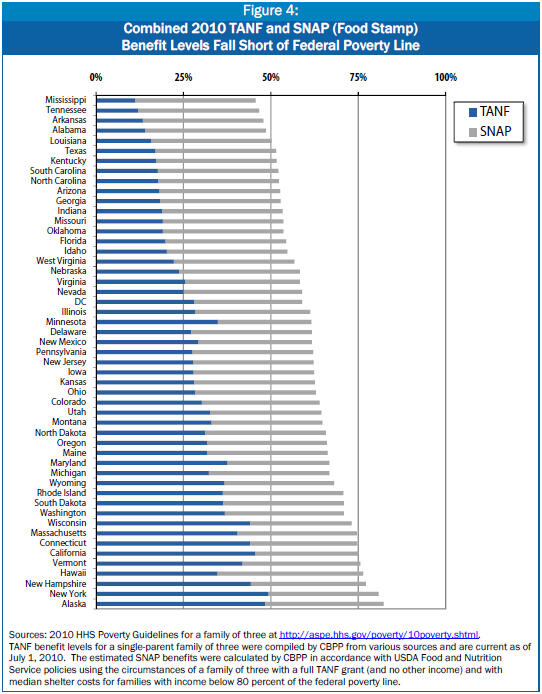
- The 2009 Recovery Act created a TANF Emergency Fund to cover 2009 and 2010 (it expired on September 30, 2010). The Emergency Fund provided additional federal TANF funds to a state to reimburse it for 80 percent of increased spending (relative to the lower of 2007 or 2008) on short-term. nonrecurrent benefits, subsidized employment, and (if there are increased caseloads) basic assistance.
The TANF Emergency Fund — which provides states with extra federal dollars for increased spending on basic assistance — has played an instrumental role in protecting TANF benefit levels and TANF eligibility policies from further erosion or deeper cuts. Some 45 states have received TANF Emergency Fund benefits for the basic assistance category. For these states, generally any increased spending on basic assistance — whether due to increased caseloads due to the recession or an increase in benefit levels or other eased eligibility policies — was subsidized by federal Emergency Fund dollars, which reimburse 80 percent of the increase over the base year. Conversely, any reduction in spending on basic assistance, whether due to cuts in benefit levels or tighter eligibility policies, generally saved only 20 percent of the estimated cost, as the other 80 percent would have been reimbursed by the federal TANF Emergency Fund.[9] Thus, cutting spending on basic assistance turns away federal stimulus dollars and brings fewer dollars into the local economy. As TANF families need to spend every dollar they get on basic needs, any increased spending on TANF basic assistance adds dollars to the local economy.
While a handful of states cut benefit levels or tightened eligibility policies during the recession, most states were able to avoid such changes. Policymakers and advocates in states credit the TANF Emergency Fund reimbursement with helping to protect the spending levels on basic assistance in the face of fiscal pressures to make cuts in human services budgets. In some states, the availability of the Emergency Fund helped support increased TANF benefits.
- Delaware implemented a temporary increase in benefits effective November 2009 which expired on September 30, 2010. Benefits for a family of three increased from $338 to $416 a month and reverted to $338 when the increase expired.
- New York State planned to implement a multi-stage increase in benefits, although full implementation is now in question given the state fiscal situation. The Contingency Funds and TANF Emergency Funds the state qualified for played an instrumental role in allowing the second stage of the increase to go into effect in 2010.
Despite the availability of help from the expiring TANF Emergency Fund and the Contingency Fund, three states reduced TANF benefit levels in 2009. Hawaii and Arizona each cut benefit levels by 20 percent; California made a smaller reduction but a proposal for another 15 percent reduction is pending. Additional states may consider benefit reductions in 2011 legislative sessions.
| APPENDIX 1: Changes in State TANF Benefit Levels (Single-Parent Family of Three) | ||||||
| STATE | July 1996 | Jan. 2000 | Jan. 2002 | Jan 2005 | July 2008 | July 2010 |
| Alabama | 164 | 164 | 164 | 215 | 215 | 215 |
| Alaska | 923 | 923 | 923 | 923 | 923 | 923 |
| Arizona | 347 | 347 | 347 | 347 | 347 | 2771 |
| Arkansas | 204 | 204 | 204 | 204 | 204 | 204 |
| California | 596 | 626 | 679 | 723 | 723 | 6942 |
| Colorado | 356 | 356 | 356 | 356 | 356 | 462 |
| Connecticut | 636 | 636 | 636 | 636 | 674 | 6743 |
| Delaware | 338 | 338 | 338 | 338 | 338 | 4164 |
| D.C. | 415 | 379 | 379 | 379 | 428 | 4285 |
| Florida | 303 | 303 | 303 | 303 | 303 | 303 |
| Georgia | 280 | 280 | 280 | 280 | 280 | 280 |
| Hawaii | 712 | 570 | 570 | 570 | 636 | 6106 |
| Idaho | 317 | 293 | 293 | 309 | 309 | 309 |
| Illinois | 377 | 377 | 377 | 396 | 432 | 4327 |
| Indiana | 288 | 288 | 288 | 288 | 288 | 288 |
| Iowa | 426 | 426 | 426 | 426 | 426 | 426 |
| Kansas | 429 | 429 | 429 | 429 | 429 | 429 |
| Kentucky | 262 | 262 | 262 | 262 | 262 | 262 |
| Louisiana | 190 | 190 | 240 | 240 | 240 | 240 |
| Maine | 418 | 461 | 485 | 485 | 485 | 485 |
| Maryland | 373 | 417 | 472 | 482 | 565 | 5748 |
| Massachusetts | 565 | 565 | 618 | 618 | 618 | 618 |
| Michigan | 459 | 459 | 459 | 459 | 489 | 492 |
| Minnesota | 532 | 532 | 532 | 532 | 532 | 532 |
| Mississippi | 120 | 170 | 170 | 170 | 170 | 170 |
| Missouri | 292 | 292 | 292 | 292 | 292 | 292 |
| Montana | 438 | 469 | 494 | 405 | 472 | 504 |
| Nebraska | 364 | 364 | 364 | 364 | 364 | 364 |
| Nevada | 348 | 348 | 348 | 348 | 383 | 383 |
| New Hampshire | 550 | 575 | 600 | 625 | 625 | 675 |
| New Jersey | 424 | 424 | 424 | 424 | 424 | 424 |
| New Mexico | 389 | 439 | 389 | 389 | 447 | 447 |
| New York | 577 | 577 | 577 | 691 | 691 | 7539 |
| North Carolina | 272 | 272 | 272 | 272 | 272 | 272 |
| North Dakota | 431 | 457 | 477 | 477 | 477 | 477 |
| Ohio | 341 | 373 | 373 | 373 | 410 | 434 |
| Oklahoma | 307 | 292 | 292 | 292 | 292 | 29210 |
| Oregon | 460 | 460 | 460 | 460 | 485 | 485 |
| Pennsylvania | 421 | 421 | 421 | 421 | 421 | 42111 |
| Rhode Island | 554 | 554 | 554 | 554 | 554 | 554 |
| South Carolina | 200 | 204 | 205 | 205 | 263 | 270 |
| South Dakota | 430 | 430 | 469 | 501 | 539 | 555 |
| Tennessee | 185 | 185 | 185 | 185 | 185 | 185 |
| Texas | 188 | 201 | 201 | 223 | 244 | 26012 |
| Utah | 416 | 451 | 474 | 474 | 498 | 498 |
| Vermont | 597 | 622 | 638 | 640 | 640 | 64013 |
| Virginia | 354 | 354 | 389 | 389 | 389 | 38914 |
| Washington | 546 | 546 | 546 | 546 | 562 | 562 |
| West Virginia | 253 | 328 | 453 | 340 | 340 | 340 |
| Wisconsin | 517 | 673 | 673 | 673 | 673 | 673 |
| Wyoming | 360 | 340 | 340 | 340 | 506 | 561 |
| 1 Arizona implemented a 20 percent benefit cut effective March 1, 2009. 2 California implemented a benefit cut effective July 1, 2009, reducing monthly benefits from $723 to $694 for a family of three. California has two regional variations in benefit levels; the number used here represents the higher benefit level. 3 Connecticut’s benefit levels vary across three regions. The listed number is for the highest benefit level, not the most typical level. 4 Delaware instituted a temporary TANF benefit increase from $338 to $416 monthly for a family of three, effective November 2009. The temporary increase was funded with TANF Emergency Funds. The increase ended on September 30, 2010. On October 1, 2010, the TANF benefit reverted to $338 for a family of three. 5 For the District of Columbia, a planned benefit increase to $437 went into effect October 1, 2008, but it was rescinded in December 2008. 6 Hawaii has a two-tiered system of benefits levels — a lower benefit level for families that are required to participate in work activities and a higher level for families that are exempt from work activities. As of July 1, 2010, benefits for a family of three are $610 (work-required families) and $763 (work-exempt families), respectively. Hawaii implemented a 20 percent reduction of benefits for both tiers effective September 2009. 7 Illinois implemented a 9 percent increase effective July 1, 2008 and benefits for a family of three were increased to $432 a month; they remain at this level. This is the benefit level for most of the state of Illinois; the benefit levels are lower in the southern part of the state compared to the central part of the state. 8 Maryland generally has an annual increase based on inflation, but this may not occur for state fiscal year 2011. 9 New York’s benefit levels vary by county; the listed benefit level is for New York City. 10 Currently, 95 percent of Oregon’s TANF recipients also receive a cooperative incentive of $43 a month. However, there are pending proposals to reduce or eliminate the incentive. 11 Pennsylvania’s benefit levels vary by county. The listed number is the highest, not the most typical, benefit level. 12 Texas’ monthly cash grant is adjusted annually according to the federal poverty level. There have been no changes to the FPL since 2009 and, therefore, no 2010 increase. 13 Vermont has two regional benefit levels, a higher one for Chittenden County and a lower one for the rest of the state. In the 2008 version of this paper, CBPP used the benefit levels cited in Congressional Research Service reports, which are for Chittenden County and include a housing supplement. In this version of the report, we list the benefit level for outside Chittenden County and do not add the housing supplement; we also have changed the historic benefit levels listed here to correspond to the circumstances of the benefit levels we use for 2010. The source of the historic benefit levels is the Urban Institute Welfare Rules Database. 14 In Virginia, the TANF benefit levels are dependent on geographic location. There are three locality groups. The listed benefit level represents the highest benefit level in the state. Sources: Congressional Research Service Reports “TANF Cash Benefits as of January 1, 2004” (data for 1996, 2000, and 2002) and “The Temporary Assistance for Needy Families (TANF) Block Grant: Responses to Frequently Asked Questions” (data for 20n05) (excerpt for Vermont, as noted in footnote 13). Data for 2008 and 2010 were compiled by CBPP from various sources. | ||||||
| APPENDIX 2: Changes in Real (Inflation-Adjusted) Benefit Levels Between 2010 and 1996, 2000, and 2005 for Single-Parent Family of Three | |||
| State | 1996-2010 | 2000-2010 | 2005-2010 |
| Alabama | -5.7% | 3.5% | -10.5% |
| Alaska | -28.1% | -21.1% | -10.5% |
| Arizona | -42.6% | -37.0% | -28.5% |
| Arkansas | -28.1% | -21.1% | -10.5% |
| California | -16.3% | -12.5% | -14.1% |
| Colorado | -6.7% | 2.4% | 16.2% |
| Connecticut | -23.8% | -16.4% | -5.1% |
| Delaware1 | -11.5% | -2.9% | 10.2% |
| D.C. | -25.8% | -10.9% | 1.1% |
| Florida | -28.1% | -21.1% | -10.5% |
| Georgia | -28.1% | -21.1% | -10.5% |
| Hawaii | -38.4% | -15.5% | - 4.2% |
| Idaho | -29.9% | -16.8% | -10.5% |
| Illinois | -17.6% | -9.6% | - 2.3% |
| Indiana | -28.1% | -3.3% | -10.5% |
| Iowa | -28.1% | -21.1% | -10.5% |
| Kansas | -28.1% | -21.1% | -10.5% |
| Kentucky | -28.1% | -21.1% | -10.5% |
| Louisiana | -9.2% | -0.3% | -10.5% |
| Maine | -16.6% | -17.0% | -10.5% |
| Maryland | 10.7% | 8.6% | 6.6% |
| Massachusetts | -21.3% | -13.7% | -10.5% |
| Michigan | -22.9% | -15.4% | -4.1% |
| Minnesota | -28.1% | -21.1% | -10.5% |
| Mississippi | 1.9% | -21.1% | -10.5% |
| Missouri | -28.1% | -21.1% | -10.5% |
| Montana | -17.2% | -15.2% | 11.4% |
| Nebraska | -28.1% | -21.1% | -10.5% |
| Nevada | -20.9% | -13.1% | -1.5% |
| New Hampshire | -11.7% | -7.3% | -3.3% |
| New Jersey | -28.1% | -21.1% | -10.5% |
| New Mexico | -17.4% | -19.6% | 2.9% |
| New York | -6.2% | 3.0% | -2.5% |
| North Carolina | -28.1% | -21.1% | -10.5% |
| North Dakota | -20.4% | -17.6% | -10.5% |
| Ohio | -8.5% | -8.2% | 4.2% |
| Oklahoma | -31.6% | -21.1% | -10.5% |
| Oregon | -24.2% | -16.8% | -5.6% |
| Pennsylvania | -28.1% | -21.1% | -10.5% |
| Rhode Island | -28.1% | -21.1% | -10.5% |
| South Carolina | -2.9% | 4.5% | 17.9% |
| South Dakota | -7.2% | 1.9% | -0.8% |
| Tennessee | -28.1% | -21.1% | -10.5% |
| Texas | -0.5% | 2.1% | 4.4% |
| Utah | -13.9% | -12.8% | -6.0% |
| Vermont | -22.9% | -18.8% | -10.5% |
| Virginia | -21.0% | -13.3% | -10.5% |
| Washington | -26.0% | -18.8% | -7.9% |
| West Virginia | -3.4% | -18.2% | -10.5% |
| Wisconsin | -6.4% | -21.1% | -10.5% |
| Wyoming | 12.1% | 30.2% | 47.7% |
| 1Using the TANF benefit level of $338 that has been in place since October 1, 2010, the changes in real (inflation-adjusted) benefit levels for Delaware are: -28.1% from 1996 – 2010, -21.1% from 2000 – 2010, and -10.5% from 2005 to 2010. Source: Calculated from figures in Appendix 1 adjusted for inflation using the Consumer Price Index (CPI). | |||
| APPENDIX 3: Percentage of HUD Fair Market Rent Covered by TANF Benefits in 2002 and 2010 | ||
| State | 2002 | 2010 |
| Alabama | 34% | 33% |
| Alaska | 110% | 87% |
| Arizona | 46% | 31% |
| Arkansas | 43% | 34% |
| California | 66% | 52% |
| Colorado | 43% | 53% |
| Connecticut | 72% | 56% |
| Delaware | 47% | 41%1 |
| D.C. | 38% | 29% |
| Florida | 42% | 29% |
| Georgia | 39% | 35% |
| Hawaii | 66% | 38% |
| Idaho | 57% | 45% |
| Illinois | 47% | 48% |
| Indiana | 51% | 41% |
| Iowa | 82% | 67% |
| Kansas | 77% | 63% |
| Kentucky | 53% | 41% |
| Louisiana | 45% | 31% |
| Maine | 75% | 58% |
| Maryland | 54% | 45% |
| Massachusetts | 56% | 51% |
| Michigan | 68% | 66% |
| Minnesota | 70% | 66% |
| Mississippi | 36% | 26% |
| Missouri | 52% | 42% |
| Montana | 93% | 78% |
| Nebraska | 68% | 55% |
| Nevada | 43% | 38% |
| New Hampshire | 73% | 66% |
| New Jersey | 43% | 34% |
| New Mexico | 67% | 64% |
| New York | 61% | 61% |
| North Carolina | 45% | 38% |
| North Dakota | 93% | 82% |
| Ohio | 61% | 62% |
| Oklahoma | 56% | 46% |
| Oregon | 67% | 63% |
| Pennsylvania | 63% | 50% |
| Rhode Island | 81% | 56% |
| South Carolina | 38% | 39% |
| South Dakota | 86% | 91% |
| Tennessee | 34% | 26% |
| Texas | 29% | 32% |
| Utah | 69% | 65% |
| Vermont | 100% | 70% |
| Virginia | 52% | 38% |
| Washington | 71% | 61% |
| West Virginia | 100% | 57% |
| Wisconsin | 113% | 88% |
| Wyoming | 64% | 77% |
| 1 Using the TANF benefit level of $338 for a family of three that has been in place since October 1, 2010, the percentage of HUD Fair Market Rent covered by TANF benefits in 2010 is 34%. Source: Out of Reach, by the National Low-income Housing Coalition for 2002 and 2010, available at http://www.nlihc.org/oor/oor2010/. NLIHC creates weighted statewide average Fair Market Rent for various-sized apartments based on HUD Fair Market Rents for various sub-regions in the state. The numbers used here are for a two-bedroom apartment. TANF 2010 benefit levels for single-parent families of three were compiled by CBPP from various sources and are current as of July 1, 2010. | ||
| APPENDIX 4: 2010 TANF and Food Stamp Benefit Levels as a Percent of the Federal Poverty Line | ||
| State | TANF as Percent of the Federal Poverty Line | Food Stamps and TANF as Percent of the Federal Poverty Line |
| Alabama | 14% | 49% |
| Alaska | 48% | 82% |
| Arizona | 18% | 53% |
| Arkansas | 13% | 48% |
| California | 45% | 75% |
| Colorado | 30% | 64% |
| Connecticut | 44% | 75% |
| Delaware | 27%1 | 62%1 |
| D.C. | 28% | 59% |
| Florida | 20% | 54% |
| Georgia | 18% | 53% |
| Hawaii | 35% | 76% |
| Idaho | 20% | 55% |
| Illinois | 28% | 61% |
| Indiana | 19% | 53% |
| Iowa | 28% | 62% |
| Kansas | 28% | 63% |
| Kentucky | 17% | 52% |
| Louisiana | 16% | 50% |
| Maine | 32% | 66% |
| Maryland | 38% | 67% |
| Massachusetts | 41% | 75% |
| Michigan | 32% | 67% |
| Minnesota | 35% | 62% |
| Mississippi | 11% | 46% |
| Missouri | 19% | 54% |
| Montana | 33% | 65% |
| Nebraska | 24% | 58% |
| Nevada | 25% | 59% |
| New Hampshire | 44% | 77% |
| New Jersey | 28% | 62% |
| New Mexico | 29% | 62% |
| New York | 49% | 81% |
| North Carolina | 18% | 52% |
| North Dakota | 31% | 66% |
| Ohio | 28% | 63% |
| Oklahoma | 19% | 54% |
| Oregon | 32% | 66% |
| Pennsylvania | 28% | 62% |
| Rhode Island | 36% | 71% |
| South Carolina | 18% | 52% |
| South Dakota | 36% | 71% |
| Tennessee | 12% | 47% |
| Texas | 17% | 52% |
| Utah | 33% | 64% |
| Vermont | 42% | 76% |
| Virginia | 25% | 58% |
| Washington | 37% | 71% |
| West Virginia | 22% | 57% |
| Wisconsin | 44% | 73% |
| Wyoming | 37% | 68% |
| 1 Using the TANF benefit level of $338 for a family of three that has been in place since October 1, 2010, TANF benefits are 22 percent of the poverty line and TANF and food stamp benefits combined are 57 percent of the poverty line. Sources: 2010 HHS Poverty Guidelines for a family of three at http://aspe.hhs.gov/poverty/10poverty.shtml. TANF benefit levels for a single-parent family of three were compiled by CBPP from various sources and are current as of July 1, 2010. The estimated SNAP benefits were calculated by CBPP in accordance with USDA Food and Nutrition Service policies using the circumstances of a family of three with a full TANF grant (and no other income) and with median shelter costs for families with income below 80 percent of the federal poverty line. | ||
End Notes
[1] For more information on state TANF programs’ response to the recession, see LaDonna Pavetti and Dottie Rosenbaum, “Creating a Safety Net That Works When the Economy Doesn’t: The Role of the Food Stamp and TANF Programs,” Center on Budget and Policy Priorities, February 25, 2010.
[2] The 2010 FPL for a family of three is $1526 per month; Alaska and Hawaii have higher poverty levels (see http://aspe.hhs.gov/poverty/10poverty.shtml). The 2010 Federal Poverty Guidelines were published by HHS on August 3, 2010, after congressional action delayed publication of the update, and are the same as the 2009 guidelines.
[3] HHS data on Characteristics and Financial Circumstances of TANF Recipients, Table 3 at http://www.acf.hhs.gov/programs/ofa/character/FY2008/tab03.htm.
[4] Figure 2 and Appendix 2 compare (in inflation-adjusted terms) the July 2010 TANF benefit level in each state to benefit levels in 1996, 2000, and 2005.
[5] 1996 Green Book , U.S. House of Representatives Ways and Means Committee, Table 8-15, http://frwebgate.access.gpo.gov/cgi-bin/getdoc.cgi?dbname=104_green_book&docid=f:wm014_08.pdf .
[6] Worst Case Housing Needs 2007: A Report to Congress , HUD Office of Policy Development and Research, May 2010.
[7] The combined TANF and SNAP benefit estimates in Figure 4 calculate SNAP levels assuming a family’s shelter costs are the same as the median shelter costs for families with incomes at or below 80 percent of the federal poverty line. A family’s SNAP benefit amount is calculated based on its income and deductions, with the capped deduction for high shelter costs playing a significant role; the maximum amount of SNAP benefits for a family of three was $526 in July 2010. For over half the states, the estimated SNAP benefit used in Figure 4 is the maximum monthly benefit for a family of three ($526). The amount of SNAP benefit that an individual TANF family qualifies based on its circumstances often may be lower than the estimate used here.
[8] See https://www.cbpp.org/slideshows/?fa=stateFiscalCrisis.
[9] The maximum amount that a state can receive from the TANF Emergency Fund for 2009 and 2010 combined is 50 percent of one year’s block grant amount; this limit applies to the combination of any Emergency Fund and Contingency Fund dollars a state receives for these years. A state’s increase in basic assistance spending would not be reimbursed at 80 percent if doing so would cause the state to exceed the maximum allocation.
More from the Authors