High-Income People Would Benefit Significantly From Extension of “Middle-Class” Tax Cuts
A fact generally overlooked in the debate over whether Congress should extend the high-income Bush tax cuts — i.e. those targeted exclusively at couples making over $250,000 and single individuals making over $200,000 — is that these households will still receive substantial tax cuts if Congress extends the so-called “middle-class” Bush tax cuts while letting the high-income tax cuts expire as scheduled.
This is because the 2001 tax law’s reductions in the lower tax brackets benefit not only people whose incomes fall within the lower brackets but also those whose incomes exceed those brackets. In fact, high-income people actually receive much larger benefits in dollar terms from the so-called “middle-class tax cuts” than middle-class people do.[1]
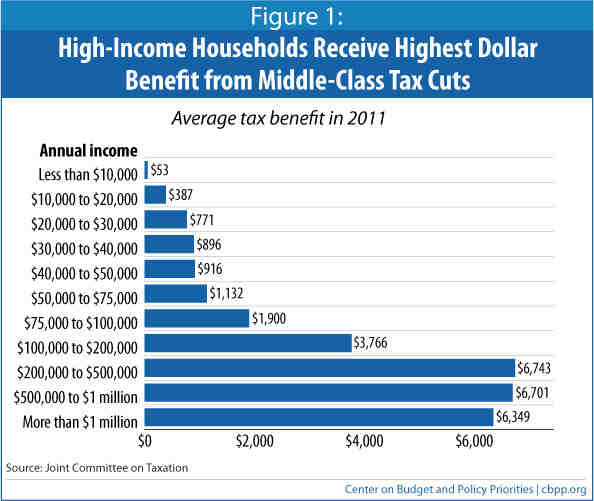
Specifically, recent estimates from the Joint Committee on Taxation show that extending just the middle-class tax cuts would provide more than $6,300 in tax cuts to households with incomes above $200,000, on average, compared to $1,132 in tax cuts for households with incomes between $50,000 and $75,000. The Joint Tax Committee estimates show:
- Households with incomes exceeding $1 million will receive an average tax cut of $6,349 in 2011 if the middle-class tax cuts are extended while the high-income tax cuts are allowed to expire. (They will receive an average tax cut of nearly $104,000 if the high-income tax cuts are extended as well.)
- The story is similar, if not quite as dramatic, for households that make between $500,000 and $1 million. They will receive an average tax cut of $6,701 if the middle-class tax cuts are excluded (and of $17,467 if the high-income tax cuts are also extended).
- For all other income categories, by contrast, the size of the tax cuts are about the same whether the high-income tax cuts are extended or not. Even for households with incomes between $200,000 and $500,000, the effects are similar. The Joint Tax Committee figures show that they would receive an average tax cut of $6,743 if only the middle-class tax cuts are extended, and of $7,152 if the high-income tax cuts are extended, as well.
The middle-class tax-cut package the Joint Tax Committee analyzed does not extend the reduction in the tax rate on dividends for couples with incomes over $250,000 (and singles over $200,000). President Obama has proposed, however, that the dividend top rate for high-income people be permanently set at 20 percent, rather than being allowed to return to its pre-2001 level of 39.6 percent. If Congress follows that approach and incorporates this proposal into a middle-class tax-cut package, the average tax cut that high-income households will receive from enactment of such a package will be considerably larger than the figures just cited, and the dollar amount by which the average tax cut going to high-income households exceeds the average tax cut for middle-income households will be significantly larger, as well.
Examination of Specific Tax Cut Provisions Tells the Same Story
Analysis by the Urban Institute-Brookings Institution Tax Policy Center tells a similar story. The Tax Policy Center (TPC) recently analyzed the average tax cut that households at different income levels would receive from a number of the specific provisions of the 2001 tax cut, as well as from continuation of Alternative Minimum Tax (AMT) relief. TPC found that:
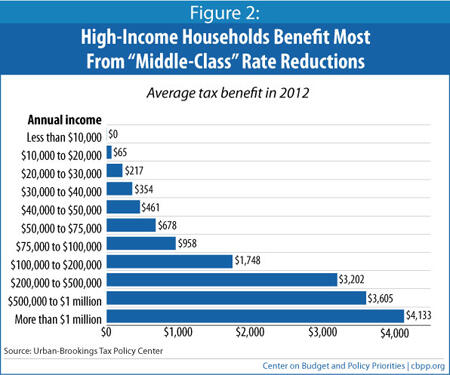
- The creation of the 10 percent bracket and the tax-rate reductions in the middle two brackets (from 28 to 25 percent, and from 31 to 28 percent) deliver tax cuts that are six times larger, on average, for people making more than $1 million than for people making between $50,000 and $75,000.[2] Those making over $1 million would receive an average tax cut of $4,133 from extending these provisions, as compared to an average tax cut of $678 for people in the $50,000-$75,000 income range.
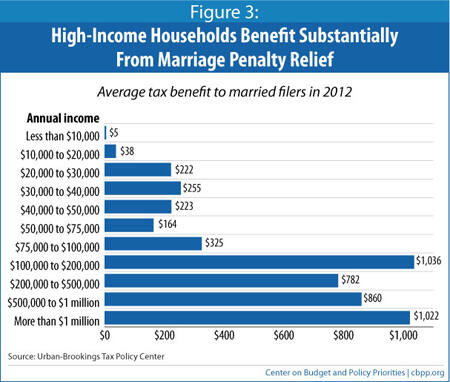
- Similarly, “middle-class” marriage penalty relief — delivered through an expanded 15 percent bracket and an increased standard deduction for married tax filers, as well as a delayed phaseout of the Earned Income Tax Credit (EITC) for such filers — provides an average tax cut of $1,022 for couples with incomes above $1 million, compared to $164 for those earning between $50,000 and $75,000.[3]
And although some observers have warned that the AMT) is becoming a middle-class tax, the temporary “patches” that Congress has passed to keep its reach from extending further actually benefit affluent people far more than those truly in the middle. Extending the AMT patch would provide an average of $2,035 in tax savings for couples making between $200,000 and $500,000 as compared to an average tax reduction of $123 for people making between $50,000 and $75,000.[4]
In short, the nation’s top 2 percent of households will receive much larger tax cuts (in dollar terms) than the middle class even if Congress extends only the middle-class tax cuts.
How Different “Middle-Class” Tax Cuts Affect Middle- and Upper-Income Households
The “middle-class tax cuts” are generally understood to include: 1) the 2001 tax law’s creation of the 10 percent tax bracket and tax-rate reductions in other brackets (but not the law’s rate reductions in the top two brackets), 2) the law’s marriage penalty relief, 3) its expansion of the Child Tax Credit, and 4) a “patch” that Congress has enacted each year since 2001 to prevent a large increase in the number of households subject to the AMT. With the exception of the child credit expansion, high-income people not only benefit from these tax cuts but receive a larger dollar benefit from them, on average, than middle-class people.
Income Tax Rate Reductions
The table below lists the marginal tax rates for 2011 both under current law (that is, if all of the 2001 tax cuts expire as scheduled at the end of 2010) and under an extension of the “middle-class” rate reductions. (These rates reflect the rate at which an additional dollar of income is taxed. They do not reflect the percentage of a taxpayer’s overall income that he or she owes in income tax; those percentages are much lower than the marginal tax rates shown in the table, because all of the rest of a taxpayer’s income) — i.e., all of it other than the portion of income that falls into the top tax bracket the taxpayer faces — is taxed at lower rates. Average tax rates are also lower than marginal tax rates because almost every taxpayer benefits from personal exemptions, the standard or itemized deductions, and/or tax credits.)
| Table 1: | |||
| Potential Income Tax Rate Schedules in 2011 | |||
| Tax rate under current law | Tax Rate if “middle-class” brackets are extended | Applied to taxable income (income after exemptions and deductions) up to … | |
| Single | Married | ||
| 15% | 10% | $8,575 | $17,150 |
| 15% | 15% | $34,850 | $69,700* |
| 28% | 25% | $84,350 | $140,600 |
| 31% | 28% | $176,000 | $214,250 |
| 36% | 33% | $195,550 | $237,300 |
| 36% | 36% | $382,650 | $382,650 |
| 39.6% | 39.6% | no limit | no limit |
| *Without marriage penalty relief, the 15 percent bracket would end at $58,200 for married couples | |||
This crucial distinction is often overlooked. It is perhaps best explained through a metaphor: the income tax operates as a staircase, not an elevator. This means that people who make $1 million a year do not go directly to the top “floor” (i.e., to the top tax rate, currently 35 percent) but instead take the “stairs,” paying tax on the first increment of taxable income at 10 percent, paying tax on the next increment at 15 percent, and so on until reaching the top rate.
Because of this, the 10 percent bracket — which the 2001 tax law carved out from within the old 15 percent bracket — reduces taxes not only for people whose incomes fall within that bracket, but for every taxpayer whose income exceeds the 10 percent bracket, as well. In fact, taxpayers in higher brackets receive the maximum possible benefit from the 10 percent bracket.
The 2001 tax law also created a new 25 percent bracket to replace part of the 28 percent bracket. For married couples, taxable income between $69,700 and $140,600 will be taxed at this 25 percent rate in 2011, assuming the middle-class tax cuts are extended. Let’s consider how this bracket affects three illustrative households, all married couples with two children. (See the appendix for a discussion of the methodology used in computing tax cuts for the illustrative households.)
- The Smith household has a joint income of $75,000. After taking all of its deductions and exemptions, it is left with a taxable income of $48,300. Because the household’s taxable income is below the $69,700 threshold for the 25 percent bracket, it makes no difference to the family whether the 25 percent rate returns to 28 percent.
- The Jones household has a joint income of $125,000. Its taxable income after deductions and exemptions is $97,500, putting it in the middle of the 25 percent tax bracket. Specifically, the household has $27,800 of its income ($97,500 minus $69,700) taxed at the 25 percent rate. Because the rate is 25 percent instead of 28 percent, the household pays $834 less in taxes on this portion of its income (3 percent times $27,800 equals $834).
- The Todd household has a joint income of $600,000 and taxable income of $550,000, far above the $140,600 ceiling for the 25 percent bracket. It currently pays the 25 percent rate on $70,900 of its income (the full amount of income that falls into the 25 percent tax bracket, since the bracket starts at $69,700 of income and ends at $140,600 of income). Because the rate is 25 percent instead of 28 percent, the household pays $2,127 less in taxes on this portion of its income.
In other words, this “middle-class” tax cut — the reduction of the tax rate in this bracket from 28 percent to 25 percent — provides no benefit at all to the household with gross income of $75,000, a household whose income places it in the heart of the middle class, while giving the household with income in excess of $500,000 a tax reduction of $2,127.
The other middle-bracket rate change in 2001 lowered the 31 percent rate to 28 percent. In 2011 for married couples, taxable income for between $140,600 and $214,250 is taxed at this 28 percent rate. The benefits of this change are even more skewed toward high-income households. Consider the same three households just described.
- Because the Smith household’s taxable income is below the $140,600 threshold for the 28 percent bracket, it makes no difference to the household whether the 28 percent rate returns to 31 percent.
- Because the Jones household’s taxable income is also below the $140,600 threshold, increasing the 28 rate to 31 percent provides no tax cut to this household either.
- But the Todd household, with taxable income exceeding $500,000, receives the full benefit of the reduction in this tax rate from 31 percent to 28 percent — a tax cut of $2,210.
Marriage Penalty Relief
A “marriage penalty” exists in the tax code when two people pay higher taxes if they marry than if they remain single. The 2001 tax cut reduced marriage penalties by: 1) setting the standard deduction for couples at twice the level for singles; 2) setting the 15 percent bracket’s income ceiling for couples at twice the level for singles; and 3) raising the income level at which the EITC begins phasing out for married couples.
The standard deduction and EITC changes have little effect on high-income people, who tend to itemize deductions and are ineligible for the EITC. However, the other change — the raising of the point at which the 15 percent tax bracket ends for married filers and a higher tax rate kicks in — provides a tax cut for people higher up the income scale while having no effect on many middle-class couples. More than three-fifths of all couples — those with taxable incomes under $58,200 in 2011 — would be in the 15 percent bracket even without the increase in the income level at which that brackets ends, and they consequently do not benefit from an increase in that level. Meanwhile, couples with very high incomes receive the maximum benefit from this provision.
In all, the Tax Policy Center found that couples with incomes between $50,000 and $75,000 receive an average of just $164 from the three marriage relief provisions, compared to $1,022 for couples making over $1 million.[5] (See Figure 3.)
Child Tax Credit Expansion
The expansion of the Child Tax Credit is the one major “middle-class” tax cut that does not affect high-income people, because this credit begins phasing out for couples with incomes above $110,000. It phases out entirely at $$150,000 of income for a married couple with two children.
AMT Patch
The AMT is a parallel tax system designed to ensure that high-income people do not qualify for so many tax breaks that they pay little or no income tax. Over time, however, its impact has begun to drift down the income scale because the AMT parameters in the tax code are not indexed to inflation.
Since 2001, Congress has repeatedly enacted temporary “patches” that increase the amount of income exempt from the AMT, thereby effectively providing an ad hoc inflation adjustment and avoiding a large increase in the number of taxpayers affected. Tax Policy Center analysis has shown that the benefits of continuing to “patch” the AMT each year are the highest for people with incomes between $200,000 and $500,000. Their average benefit from the annual AMT patch is $2,035, compared to $123 for taxpayers with incomes between $50,000 and $75,000.
Conclusion
High-income people benefit significantly from the “middle-class” tax cuts. They will continue to receive substantial tax cuts if Congress extends the middle-class tax cuts while allowing the high-income tax cuts to expire on schedule at the end of this year. Indeed, if policymakers follow this route, people making more than $1 million will receive more than five times the tax cut benefit, in dollar terms, as a middle-class family making $50,000 to $75,000.
Appendix
Measuring the Benefits of Particular Tax Cuts for the Illustrative Households
There are two general approaches to calculating the benefits of a particular tax cut or set of tax cuts, such as the 2001 tax cuts: calculate the effect of each tax cut (or set of tax cuts) individually — without regard to the impact of the other tax cuts — or calculate the effects of each tax cut sequentially, so that the effects of each tax cut are “stacked.”
The Tax Policy Center, in its estimates of the distributional impact of the various tax cut provisions, uses the sequential approach. Under this methodology, the tax benefits from each individual provision (or set of provisions) add to the total benefits from the Bush tax cuts as a whole, because the sequencing or “stacking” captures all interactions between the provisions.
One issue with this methodology is that the benefit from a given provision can vary significantly depending on its placement in the sequence — in other words, whether it is considered before, or after, other provisions. While alternative sequences would always produce the same totals, they might result in very different tax benefits attributed to each individual provision.
To calculate the tax cuts from individual provisions for the three illustrative households in this paper, we applied the other approach: measuring the impact of each provision individually. Specifically, we assumed that all of the middle-class tax cuts remain in place for 2011 and then calculated the increase in the household’s tax burden if a particular provision were removed. This approach is helpful for illustrating the benefits of a particular provision for households in a given point in the income distribution because the tax benefit does not depend on the provision’s place in the sequence.
The drawback of measuring the impact of each provision individually is that it does not capture the interactions between provisions. This means that the total benefit an illustrative household will receive from the entire package of tax cuts will not necessarily be reached by adding the benefits from each provision.
[2] Tax Policy Center, “Incremental Effects of Allowing the 2001 and 2003 Tax Cuts to Sunset: Eliminate 10 Percent Bracket and Raise 25 and 28 Percent Tax, Distribution of Federal Tax Change by Cash Income Level, 2012,” July 21, 2010, http://www.taxpolicycenter.org/numbers/Content/PDF/T10-0170.pdf.
[3] Tax Policy Center, “Incremental Effects of Allowing the 2001 and 2003 Tax Cuts to Sunset: Restore Marriage Penalties: Standard Deduction, Bottom Tax Brackets for Couples, and EITC Phaseout Threshold, Distribution of Federal Tax Change by Cash Income Level, 2012,” July 21, 2010, http://www.taxpolicycenter.org/numbers/Content/PDF/T10-0168.pdf.
[4] Tax Policy Center, “Incremental Effects of Allowing the 2001 and 2003 Tax Cuts to Sunset: Eliminate AMT Patch, Distribution of Federal Tax Change by Cash Income Level, 2012,” July 21, 2010, http://www.taxpolicycenter.org/numbers/Content/PDF/T10-0172.pdf.
[5] Tax Policy Center, “Incremental Effects of Allowing the 2001 and 2003 Tax Cuts to Sunset: Restore Marriage Penalties: Standard Deduction, Bottom Tax Brackets for Couples, and EITC Phaseout Threshold, Distribution of Federal Tax Change by Cash Income Level, 2012,” July 21, 2010, http://www.taxpolicycenter.org/numbers/Content/PDF/T10-0168.pdf.
End Notes
[1] If the benefits from the tax cuts are calculated relative to income, upper-middle-class households benefit more from the middle-class tax cuts than the very wealthiest households do. Because of the latter’s significantly higher incomes, the comparatively larger dollar benefits they receive constitute a relatively small percentage of their income. Nevertheless, very high-income households do benefit substantially from the middle-class tax cuts.
More from the Authors