What the 2010 Trustees’ Report Shows about Social Security
On August 5, the Social Security Board of Trustees issued the 70th annual report on the program’s financial and actuarial status. [1] The trustees’ report shows some mild deterioration in the program’s short-term outlook — a finding that was widely expected — and a mild improvement in its long-run finances, thanks largely to the recent enactment of health reform.
Several key points emerge from the new report:
- The trustees continue to estimate that the trust funds will be exhausted in 2037— the same date that they forecast in last year’s report.
- Even after 2037, Social Security could pay more than three-fourths of scheduled benefits using its annual tax income. Those who fear that Social Security won’t be around when today’s young workers retire misunderstand the trustees’ projections.
- The program’s shortfall is relatively modest, amounting to 0.7 percent of Gross Domestic Product (GDP) over the next 75 years (and 1.4 percent of GDP in 2084). A mix of tax increases and benefit modifications — carefully crafted to shield recipients of limited means, potentially make benefits more adequate for the neediest beneficiaries, and give ample notice to all participants — could put the program on a sound footing indefinitely.
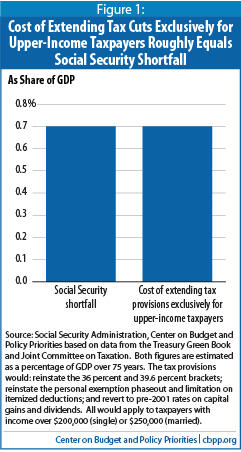
- The 75-year Social Security shortfall is about the same size as the cost, over that period, of extending the 2001 and 2003 tax cuts for the richest 2 percent of Americans (those with incomes above $250,000 a year). Members of Congress cannot simultaneously claim that the tax cuts for people at the top are affordable while the Social Security shortfall constitutes a dire fiscal threat.
- Preserving and building upon the cost-control measures enacted in the health reform law will be important not only to Medicare, but — to a lesser degree — to Social Security as well.
Report Holds Few Surprises
The trustees’ report focuses on the outlook for the next 75 years — a horizon that spans the lifetime of just about everybody now old enough to work. The trustees expect the program’s tax income to remain near today’s levels, at about 13 percent of taxable payroll, while declining gently as a percentage of GDP.[2] Meanwhile, the program’s costs are expected to climb to over 17 percent of taxable payroll or 6 percent of GDP — up from 13 percent of taxable payroll and 4.8 percent of GDP today. Over the entire 75-year period, the trustees put the Social Security shortfall at 1.92 percent of taxable payroll, or 0.7 percent of GDP. The shortfall is concentrated in the later years of the projection.
It’s no accident that the program will grow steadily (relative to the economy) over the next 25 years, peaking as a share of GDP around 2035 and leveling off after that. While Social Security provides a safety net to people in all age groups — to young children and their surviving parents who have lost a family breadwinner, to working-age adults who have suffered a disability, and to retired workers and elderly widows and widowers — about three-fourths of its benefits go to people age 65 or older. The share of the population that is 65 or older will climb steeply through 2035, from just under 13 percent of the population today to 20 percent. Social Security’s increase in cost as a percentage of GDP roughly mirrors that pattern. This confirms that Social Security’s fundamental challenge is demographic, traceable to a rising number of beneficiaries rather than to escalating costs per beneficiary.[3]
The size of the shortfall over the next 75 years is similar to previous trustees’ forecasts (see Table 1) and represents a mild improvement from last year’s report. Of the improvement in the new forecast — which equals 0.08 percent of taxable payroll over 75 years — the actuaries credit 0.14 percentage points to the positive effects of the new health reform law, whose excise tax on high-cost, employer-sponsored health plans is expected to shift some employee compensation from (nontaxable) fringe benefits to (taxable) wages. The actuaries ascribe a negative 0.06 percentage points to the simple passage of another year (i.e., to the fact that the 75-year valuation period is now 2010 through 2084, rather than 2009 through 2083). [4] All other changes are individually small and net to zero.
| TABLE 1 | ||||||
| Trustees’ Estimates Have Fluctuated But Tell a Consistent Story | ||||||
|
| Change since previous report due to— | |||||
|
| Legislation and regulations | Valuation period | All othera | Total change | Actuarial balance | Year of exhaustion |
| 2000 | 0.00 | -0.07 | 0.25 | 0.18 | -1.89 | 2037 |
| 2001 | 0.00 | -0.07 | 0.10 | 0.03 | -1.86 | 2038 |
| 2002 | 0.00 | -0.07 | 0.06 | -0.01 | -1.87 | 2041 |
| 2003 | 0.00 | -0.07 | 0.02 | -0.05 | -1.92 | 2042 |
| 2004 | 0.00 | -0.07 | 0.10 | 0.03 | -1.89 | 2042 |
| 2005 | 0.00 | -0.07 | 0.04 | -0.03 | -1.92 | 2041 |
| 2006 | 0.00 | -0.06 | -0.04 | -0.10 | -2.02 | 2040 |
| 2007 | 0.00 | -0.06 | 0.13 | 0.07 | -1.95 | 2041 |
| 2008 | 0.00 | -0.06 | 0.31 | 0.25 | -1.70 | 2041 |
| 2009 | 0.00 | -0.05 | -0.25 | -0.30 | -2.00 | 2037 |
| 2010 | 0.14 | -0.06 | 0.00 | 0.08 | -1.92 | 2037 |
| Source: Annual trustees’ reports. All figures (except year of exhaustion) are expressed as a percentage of taxable payroll. a “All other” changes include effects of economic, demographic, and disability assumptions and any changes in the actuaries’ methods and models. | ||||||
Some commentators may seize on huge dollar figures that appear in the report, such as the estimated $5.4 trillion shortfall through 2084 (or even the shortfall figure of $16.1 trillion through eternity, a figure about whose validity many experts have expressed serious reservations [5]). Except over relatively short periods, however, it is not useful to express Social Security’s income, outgo, or funding gap in dollar terms, which conveys no sense of the economy’s ability to support the program. Expressing them in relation to taxable payroll or GDP, in contrast, puts them in proper perspective. Over the next 75 years, for example, taxable payroll — discounted to today’s dollars, just as the $5.4 trillion shortfall figure is — will exceed $300 trillion, and GDP will be almost three times as large as that. [6]
Key Dates and What They Mean
2037 is the “headline date” in the new trustees’ report, because that is when the trust funds are expected to run out of Treasury bonds to cash in. At that point, if nothing else is done, benefits would have to be cut to match the program’s annual tax income. The program could then pay about 78 percent of regular benefits, a figure that would slip to 75 percent by 2084. Contrary to popular misinformation, benefits would not stop.
Although the exhaustion date attracts keen attention, the trustees caution that their projections are uncertain. For example, while 2037 is their best estimate of when the trust funds will be depleted, they reckon there is an 80 percent probability that trust fund exhaustion will occur sometime between 2032 and 2045 — and a 95 percent chance that depletion will happen between 2030 and 2055. In short, all reasonable estimates show a long-run problem but not an immediate crisis.
Two other, earlier dates also receive attention but have little significance for Social Security financing:
- 2010 will mark the first year since 1983 in which the program’s total expenses (for benefits and administrative costs) exceed its tax income (from payroll taxes and income taxes that higher-income beneficiaries pay on a portion of their Social Security benefits). That temporary imbalance — which the actuaries peg at $41 billion in 2010 — results from the severe economic downturn and will shrink dramatically in 2011 and disappear in 2012, although a so-called cash deficit will return permanently in 2015 as the retirement of the baby boom accelerates. Throughout that period, however, the trust funds will continue to grow larger, primarily because of the interest income the trust funds will receive on the Treasury bonds they hold. Even in 2010, for example, the trustees estimate that the trust funds’ interest income of $118 billion will more than offset the cash deficit of $41 billion.[7]
- 2025 will be the first year in which the program’s expenses exceed its total income, including its interest income. At that point, the trust funds — after peaking at $4.2 trillion — will start to shrink as Social Security begins to redeem its Treasury bonds to pay benefits.
Neither of these dates affects Social Security beneficiaries. Since the mid-1980s, Social Security has collected more in taxes each year than it pays out in benefits, has lent the excess revenue to the Treasury, and has received Treasury bonds in return. That accounts for the $2.6 trillion in Treasury bonds that the trust funds hold today.
The designers of the 1983 Social Security legislation purposely designed program financing in this manner to help pre-fund some of the costs of the baby boomers’ retirement. The interest income that the Social Security trust funds earn on their bonds, as well as the proceeds the trust funds will subsequently receive when the bonds are redeemed, will enable Social Security to keep paying full benefits until 2037. Of course, policymakers should put Social Security on a sound footing well beyond that. But they should not focus much on annual cash flows in a program that is meant to take a long-term perspective.
What Congress Should Do Soon
The trustees’ report projects that in 2011, for the second year in a row, Social Security beneficiaries should expect no cost-of-living adjustment (COLA). That’s because the consumer price index for urban wage and clerical workers (CPI-W) is expected to be lower in July-September 2010 than it was in the same quarter in 2008, the last level that triggered a COLA (the 5.8 percent increase paid in January 2009). The actual CPI-W for the July-September 2010 quarter will be known in mid-October.
An odd consequence of a zero COLA is that the maximum amount of an individual’s earnings that is subject to the Social Security payroll tax — currently $106,800 — would stay unchanged for a third year in a row. (The same would be true for the so-called retirement test, which reduces benefits for recipients who are under the full retirement age and whose earnings exceed certain dollar thresholds.) Congress should consider de-linking these measures from the COLA so they can continue rising with average wages as they normally do.[8]
Congress should also act reasonably soon on the Social Security disability program. Most analyses of the trustees’ report — including this one — focus on the combined Old-Age and Survivors Insurance (OASI) and Disability Insurance (DI) trust funds, commonly known as the Social Security trust funds. But technically, these two trust funds are separate, and the Disability Insurance trust fund faces exhaustion in 2018. (The much bigger OASI fund would last until 2040. Combined, the two funds would be depleted in 2037.)
Virtually all analysts expect that Congress will reallocate some payroll tax revenue between the two trust funds — as it has done several times in the past, in either direction —to shore up the DI trust fund. This would enable all parts of the program to pay full benefits until 2037.
We believe Congress also should take steps before long to restore solvency to the entire Social Security program, OASI and DI combined.
By far the most important fiscal decision that Congress will face between now and the end of 2010 is whether to extend the Bush tax cuts that are scheduled to expire at the end of the year. President Obama has proposed to let those cuts expire for Americans making over $250,000 a year. Some legislators have called for extending all of the tax cuts permanently; others have called for extending the high-income tax cuts temporarily on the grounds that they provide economic stimulus, though the Congressional Budget Office ranked this as the least effective of a large number of stimulus proposals.[9] The revenue loss over the next 75 years just from extending the tax cuts for people making over $250,000 — the top 2 percent of Americans — would be about as large as the entire Social Security shortfall over this period (see Figure 1). Members of Congress cannot simultaneously claim that the tax cuts for people at the top are affordable while the Social Security shortfall constitutes a dire fiscal threat.
Conclusion
Because Social Security’s finances are fairly predictable, it is not difficult to craft revenue and benefit proposals that would place the program on a sound long-term footing. The best proposals would protect the most vulnerable workers and beneficiaries and give all participants ample warning of future changes so they can plan their work and savings accordingly.
ActAction on Social Security stalled for a decade in part because of the dispute over “privatization” — that is, whether the program should be partly replaced by private accounts invested in the stock and bond markets. The turmoil in the financial markets in recent years has exposed the serious problems that approach would pose, however, and privatization proposals are now less prominent. As a result, policymakers have an opportunity to act in the not-too-distant future to restore long-term solvency to one of the nation’s most important programs (and, as an important by-product, to make a dent in projected long-run budget deficits). Policymakers should welcome the opportunity.
[2] Payroll taxes equal 12.4 percent of taxable payroll, while dedicated income taxes from higher-income beneficiaries contribute another 0.5 percent, which will rise to 0.9 percent by 2080. Together, those sources are expected to drift down slowly as a percentage of GDP over time because a growing share of employee compensation will take the form of nontaxable fringe benefits, chiefly employer-sponsored health insurance (although provisions of the new health reform law are expected to dampen that trend).
[3] The scheduled rise in the full retirement age (FRA) from 66 to 67, to be phased in between 2017 and 2022, will mitigate the program’s cost growth. The FRA denotes the age at which a new retiree can file for a full benefit; an increase in the FRA acts as a benefit cut, regardless of the actual age at which the beneficiary starts to collect benefits. When the FRA rises to 67, an early retiree who files at 62 will qualify for a monthly benefit that equals 70 percent of a full benefit (versus 75 percent today); one who delays filing until age 70 will get 124 percent of a full benefit (versus 132 percent today). Retirees who begin collecting benefits before reaching the full retirement age collect a lower monthly benefit for a larger number of years, while a retiree who does not begin collecting benefits until after reaching the full retirement age (such as someone retiring at age 70) receives a larger monthly benefit for a smaller number of years.
[4] Every year the 75-year actuarial balance tends to worsen slightly simply because an early year in which the program ran a surplus is dropped and a new, final year in which the program will run a deficit is added.
[5] In 2003, the trustees added “infinite horizon” projections that depict the trust funds’ status through eternity. The American Academy of Actuaries has criticized that measure. The Academy notes that the eye-catching dollar figure for Social Security’s unfunded liabilities through eternity tends to grow bigger every year simply from dropping an early year, regardless of whether there is any change in the program’s underlying financial condition. Even when that gap is appropriately put in context — by comparing it to taxable payroll or GDP — the Academy believes that the “infinite horizon” measure ascribes excessive weight to periods beyond the 75th year, by far the most uncertain part of the projections. See http://www.actuary.org/pdf/socialsecurity/tech_dec03.pdf.
[6] Because of the program’s reliance on payroll taxes (set at 12.4 percent of an individual’s first $106,800 of earnings in 2010), taxable payroll is the traditional denominator for these comparisons. GDP, which is more than three times as large as taxable payroll, measures the total size of the economy and serves as a useful denominator when comparing the relative sizes of Social Security and other federal programs or revenues. (Note that Medicare Hospital Insurance also relies on a payroll tax, but its tax is levied on all wages and salaries, not just those up to $106,800.)
[7] Kathy A. Ruffing, “Social Security Does Not Need a ‘Bailout’: Alarmists’ Claims Are Unjustified, But Action is Needed to Ensure Long-Term Solvency,” Center on Budget and Policy Priorities, April 15, 2010.
[8] Kathy A. Ruffing, “Case For a Social Security Cost-of-Living Adjustment in 2010 Is Weak: If Policymakers Feel a Need to Act, They Should Consider a One-Time Payment,” Center on Budget and Policy Priorities, October 15, 2009.
[9] Chuck Marr and Gillian Brunet, “High-Income Tax Cuts Should Expire on Schedule: Extending Tax Cuts for One or Two Years or Exempting ‘Small Business’ Income Would Be Ill-Advised,” Center on Budget and Policy Priorities, April 1, 2010.
More from the Authors

Areas of Expertise