Studies Shed New Light on Effects of Administration’s Tax Cuts
A wide variety of informative new data and analyses has been released recently that provide a more complete picture of how the 2001-2003 tax cuts are affecting the economy, the budget, and different income groups. This information comes from two new studies of the tax cuts — one by the Congressional
Data from a CBO report released on August 13 indicate that the tax cuts will exacerbate income inequality by boosting the after-tax income of high-income households far more than that of middle- and low-income households.
- Based on the CBO data, the top one percent of households (whose incomes average nearly $1.2 million) will receive an average tax cut of approximately $40,990 in 2004. This is more than 40 times the average tax break for those in the middle fifth of the income distribution. The gap is dramatic even though this calculation does not include the effects of two major tax cuts that disproportionately benefit very high-income households — the “bonus depreciation” business tax cut and the phase-out of the federal estate tax. The CBO study is the most comprehensive analysis available by a governmental body of who benefits from the Bush tax cuts.
- The resulting increase in after-tax income is, on average, more than two and a half times larger for the top one percent of households than for those in the middle of the income scale. As a result, the top one percent will enjoy a larger share of the after-tax income in the nation than they would have received absent the tax cuts, and the bottom 80 percent will receive a smaller share. Economists generally believe that changes in after-tax income represent the most appropriate measure of the distributional impact of tax cuts, since after-tax income reflects the income a household has available to spend or save.
- The top one percent will gain by far the most from the tax cuts even though it has already been the main beneficiary of income trends since the 1970s. Data from a separate CBO study, released in April of this year, indicate that between 1979 and 2001 (the latest year CBO examined), the average after-tax income of the top one percent of households rose by a stunning $409,000, or 139 percent, after adjusting for inflation.[1] This dwarfed the $6,300, or 17 percent, average increase among the middle fifth of the population, over this 22-year period, and the $1,100, or 8 percent, increase among the bottom fifth of the population.
A study by Mark Zandi, the chief economist at the independent economic research firm Economy.com, finds the tax cuts were poorly designed for purposes of stimulating the economy. If designed differently, the stimulus package would have generated significantly more economic and jobs growth for each dollar it cost.
- Zandi examined the average “bang for the buck” of provisions in the enacted tax cuts. He finds that the significant majority of these tax cuts consist of policies that return little bang for the buck, yielding less than $1 of short-term economic demand for each $1 of cost. Altogether, Zandi’s study indicates that the average bang for the buck from the tax cuts has been 74 cents. (In other words, each dollar of tax cuts has produced only 74 cents of added economic demand the next year.)
- Zandi also examined an alternative stimulus package and found it would have yielded far more short-term demand — $1.20 for each $1 of cost — and thus have generated significantly more economic and job growth. The alternative package would have put more money into the hands of those who immediately spend it — low- and middle-income Americans — through tax cuts targeted on this group, greater temporary unemployment benefits, and more federal fiscal relief to states to lessen state budget cuts and tax increases. As noted, the federal tax cuts that were enacted are heavily skewed toward high-income households, who are much less likely than other households to spend their tax cuts quickly. (They are more likely to save their tax cuts.)
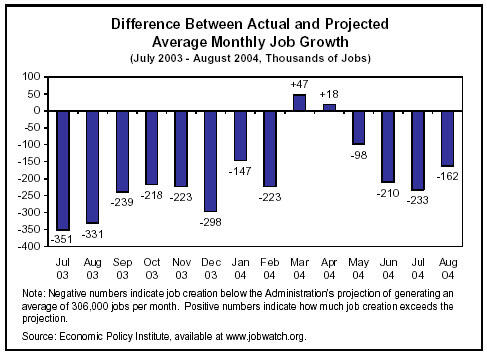
The Economic Policy Institute finds that thenumber of jobs created in the wake of the tax cuts has already fallen 2.7 million jobs short of Administration predictions made in 2003.
- EPI reports that through August, the economy has produced 1.6 million jobs since passage of the 2003 tax bill; this is just 38 percent of the 4.3 million jobs the Administration predicted would be generated over this period.
- Recent economic data indicate that the job market remains lukewarm, with 144,000 jobs being created in August. This is less than half the average monthly job creation the Administration projected in the wake of the tax cuts. While a number of factors have contributed to the weakness in the job market, the tax cuts’ flawed design must share part of the blame.
Data in the Administration’s own Mid-Session Budget Review indicates that the tax cuts have played a larger role than all other legislation enacted since the start of 2001 in the emergence of the current sizable budget deficit, and that the tax cuts account for the majority of the current deficit.
- The Mid-Session Budget Review, released July 30, shows that to date, the tax cuts have accounted for 57 percent of the cost of all legislation enacted since the Administration took office. The tax cuts thus have contributed more to the worsening fiscal picture than all other new government policies combined — more than the sum of the costs of operations in
Iraq Afghanistan - The Mid-Session Review data also show that the tax cuts account for well over half of the 2004 deficit.
- These findings, which are consistent with new CBO data released September 7, contradict claims made by a number of policymakers and activists with an ideological axe to grind who have argued that the recent tax cuts have contributed little or nothing to the deterioration of the budget outlook.
In June, the Center jointly released a report with the
- The assertion has been made that the CBO data show all taxpayers benefit from the tax cuts since all income groups are shown to receive at least some tax cuts. Such assertions, however, rest on the assumption that the tax cuts will never be paid for. This assumption is erroneous; eventually, the government must cover its bills, either by raising taxes or by cutting spending. Financial markets will not tolerate persistent large and unsustainable deficits. As Federal Reserve Board Chairman Alan Greenspan put it when testifying before Congress on September 8, “If you're going to lower taxes, you shouldn't be borrowing essentially the tax cut. And that over the long run is not a stable fiscal situation.”[2]
- The
Tax Policy Center/CBPP study found that under the two scenarios it considered for offsetting the costs of the tax cuts, more than three-quarters of American households ultimately would be made worse off. They will lose more from the financing measures than they would gain from the tax cuts. - The precise results would depend upon the specific measures adopted to offset the costs of the tax cuts. Nevertheless, the basic finding — that once the financing measures that ultimately will have to be adopted are taken into account, most households without high incomes will be net “losers” — is likely to hold under almost every financing scenario, unless a large portion of the tax cuts are repealed. Since the tax cuts’ gains are so heavily concentrated among high-income households, a similarly large share of the tax cuts’ costs would have to be imposed on those same households if middle- and low-income households are not to end up worse off.
CBO Study Shows that the Tax Cuts Benefit High-Income Americans the Most
In mid-August, CBO released a comprehensive analysis of the combined distributional effects of the 2001, 2002, and 2003 tax bills.[3] This study is particularly notable. It is the most comprehensive government study available on the distribution of the tax cuts, and CBO is a highly-respected nonpartisan organization that now is directed by a Republican appointee who worked for the Administration at the time that some of the tax cuts were being crafted. The CBO data confirm what previous independent analysis has shown: the Administration’s tax cuts disproportionately benefit those at the top of the income scale.
The CBO estimates for 2004 generally include the effects of the corporate tax cuts, the largest of which is the bonus depreciation provision, enacted in 2002 and enlarged in 2003. The CBO estimates do not include the effects of phasing out and ultimately eliminating the estate tax; in this respect, the estimates understate the tax cuts received by high-income households. (CBO recently published a study showing that the elimination of the estate tax would significantly reduce charitable contributions. This study is summarized in Appendix 2.)
In its report, CBO only gives estimates of the changes due to the tax cuts in effective tax rates and in the share of tax liabilities that various income groups pay. We derive estimates of the average tax cut, change in effective tax rate, and share of the total tax cut by income group simply and directly from the data that CBO provides.[4] Including the corporate tax cuts, our estimates based on the CBO data indicate:
- The top one percent of households would receive an average tax cut of $78,460 2004 — more than 70 times the average tax cut received by the middle fifth of households.
- The top one percent of households will receive one third of the tax cuts in 2004, which is substantially larger than the share of federal taxes they pay. (For a more detailed discussion on the tax cuts and the share of tax burdens paid, see Appendix 1.)
| Table 1 | ||||
|
| Average Income | Average Tax Cut | Share of the Tax Cut | Percentage Change in After-Tax Income |
| Lowest 20 percent | $16,600 | -$230 | 2.8% | 1.5% |
| Second 20 percent | $38,100 | -$720 | 8.3% | 2.2% |
| Middle 20 percent | $57,400 | -$980 | 11.5% | 2.0% |
| Fourth 20 percent | $84,300 | -$1,520 | 17.7% | 2.3% |
| Top 20 percent | $203,700 | -$4,890 | 59.9% | 3.3% |
| All | $80,100 | -$1,680 | 100.0% | 2.7% |
|
|
|
|
|
|
| 81-90 percent | $116,600 | -$2,210 | 13.4% | 2.5% |
| 91-95 percent | $155,000 | -$3,180 | 9.8% | 2.7% |
| 96-99 percent | $243,100 | -$4,830 | 12.0% | 2.8% |
| Top one percent | $1,171,000 | -$40,990 | 24.6% | 5.3% |
| Source: CBPP calculations based on CBO data. | ||||
The CBO data also include estimates that exclude the effects of the corporate tax cuts. In part because the largest corporate tax cut is currently scheduled to expire at the end of this year, we emphasize these estimates here.[5] Even if both the corporate and estate tax cuts are excluded, the size of the tax cuts provided to different income groups still varies dramatically. According to the CBO data, the effects of the tax cuts when the corporate tax cuts (as well as the estate tax reductions) are not included in the analysis are as follows:
- Those in the bottom fifth of households, with average incomes of just $16,600, will receive an average tax cut of $230 in 2004.
- The fifth of households in the middle of the income spectrum, with average incomes of $57,400, will receive an average tax cut of $980.
- By contrast, the top fifth of households, with average incomes of $203,700, will receive tax cuts averaging $4,890.
- And the top one percent of households – with average incomes of $1,171,000 – will receive an average tax cut of $40,990. This is more than 40 times the size of the average tax cut going to the middle fifth of households.
Another approach to examining the distribution of the tax cuts is to examine how the tax cuts affect the “after-tax” income of households at different income levels. Economists generally regard this measure as the best measure of the effect of changes in tax policy on the distribution of income. After-tax income represents how much households have available to spend and save. By this measure as well, the tax cuts are lopsided, disproportionately benefiting those at the top of the income spectrum. According to the CBO data:
- The bottom 20 percent of Americans will see their after-tax incomes increase by an average of 1.5 percent due to the Bush tax cuts, while the tax cuts will raise the after-tax income of the middle 60 percent by about 2 percent, on average.
- Those in the top quintile will enjoy larger after-tax income gains, with after-tax income increasing 3.3 percent due to the tax cuts.
- The top one percent will see its after-tax income grow by an average of 5.3 percent, more than double the percentage increase enjoyed by the middle quintile.[6]
- Because the top one percent of households is receiving a disproportionately large increase in after-tax income, the tax cuts have led to a greater concentration of income among those at the top of the income spectrum (and have decreased correspondingly the share of after-tax income received by low- and middle-income households).
As lopsided as the tax cuts are in 2004, their distribution will become more uneven in future years. In future years, several other tax breaks that go almost entirely to high-income households — the eventual elimination of the estate tax as well as the removal of the limitation on itemized deductions and the use of personal exemptions for high-income households — are scheduled to phase in. In contrast, the principal tax cuts that benefit middle- and low-income households are fully in effect in 2004.
Does Everyone Come Out Ahead?
One of the main lines of response to the CBO study by supporters of the tax cuts is that the study shows that all groups have gotten a tax cut. Everyone appears to be a “winner,” even if some win much more than others. This response reflects the assumption that the tax cuts, in essence, are a “free lunch” — that they do not have to be offset.[7]
This assumption is erroneous. Eventually, the tax cuts will have to be financed. In all likelihood, this financing will make the net effect of the tax cuts much more regressive than CBO’s data indicate, with the vast majority of low- and middle-income households being made worse off due to the tax cuts. These conclusions emerge from a study released in June by the
To date, the tax cuts have been financed through bigger deficits. This postpones but does not eliminate the need to pay for the tax cuts. The situation is analogous to a consumer charging a major purchase to a credit card. The charge postpones, but does not eliminate, the need for the ultimate payment. Because there is uncertainty about how the tax cuts will ultimately be financed, the Tax Policy Center/CBPP report examined two hypothetical scenarios. In both scenarios, the annual cost of the tax cuts from the 2001 and 2003 tax legislation (when fully phased in) would be paid for fully, so the net effect of the tax cuts on the budget would be zero.
| Table 2 | ||
| Income Class | Average net effect, financing with equal dollar burden per household | Average net effect, financing with payments proportional to income |
| Bottom 20 percent | -$1,502 | -$177 |
| Middle 20 percent | -$869 | -$228 |
| Top 20 percent | +$3,934 | +$954 |
| Top one percent | +$38,784 | +$14,793 |
| Source: William G. Gale, Peter R. Orszag, and Isaac Shapiro, “The Ultimate Burden of the Tax Cuts: Once They are Paid For, Low- and Middle-Income Households Likely to be Net Losers, On Average,” Urban-Brookings Tax Policy Center and Center on Budget and Policy Priorities, June 2, 2004 | ||
In the first scenario, every household would pay the same dollar amount to finance the tax cuts. Something close to this scenario could occur if the tax cuts were financed largely or entirely through spending cuts. If this were to occur:
- Households in the middle quintile would, on net, lose an average of about $870 per household per year from the tax cuts.
- In contrast, the top one percent of households would still benefit handsomely from the tax cuts. Even after taking into account the financing measures, the top one percent of households would end up ahead by an average of $38,780 per year.
In the study’s second scenario, households would pay for the tax cuts in proportion to their incomes. This would be more akin to funding the tax cuts by some combination of spending cuts and tax increases. Even under this scenario, low- and middle-income Americans would lose out — while those at the top gained. Under this scenario:
- Households in the middle quintile would lose an average of $230 per year.
- Those in the top one percent would still gain an average of $14,790 per year.
While other financing scenarios can be imagined, most households are likely to wind up as net losers under almost any scenario to pay for the tax cuts, other than repealing major parts of the tax cuts themselves. Since the gains from the tax cuts are so heavily concentrated among high-income households, a similarly large share of the budget cuts or tax increases ultimately adopted to finance the tax cuts would have to fall on these same high-income households to ensure that low- and middle-income households did not end up worse off. With the tax cuts having eliminated or reduced the most important taxes on higher-income households — including the estate tax, capital gains and dividend taxes, and the top marginal tax rates — it would be difficult to recover the needed revenue from these households without restoring those taxes.
A Failed Design: The Tax Cuts and Fiscal Stimulus
In another new study, Mark Zandi, chief economist at Economy.com, appraises the effectiveness and efficiency of the Bush administration’s fiscal policies in boosting the economy. Economy.com is an independent economics research group whose analyses are widely used.
Zandi describes the key to effective fiscal stimulus as being putting money into the hands of those who would immediately spend it. By this measure, he concludes that the “economic efficacy of the President’s fiscal policies has been particularly poor.”[9]
The economy has struggled during the Bush Administration’s tenure, and Zandi catalogues a number of measures of the economy’s performance.
- Growth of real gross domestic product — the overall measure of the economy’s output — has been sluggish, in “one of the weakest performances during any Presidential term since World War II.” Although this in part reflects the timing of the recent downturn — which began early in the Administration’s term — economic growth has been slow even compared to the same stage of past business cycles.
- Real household incomes for typical Americans have dropped since the beginning of 2001. Further, “personal bankruptcy filings, mortgage foreclosure rates, auto repossession rates, and delinquency rates on manufactured housing loans and credit cards are all at or just off record highs.”
- There has been a net loss of jobs. As Zandi notes, “no other President since World War II has suffered out-right job declines during their term.”
| Table 3 | ||
|
| Demand generated per dollar of cost | Share of tax cuts and spending in the 2001, 2002, and 2003 stimulus bills |
| High “Bang for the Buck” |
|
|
| Extend UI benefits | $1.73 | 2% |
| Widening of 10% tax bracket | $1.34 | 26% |
| State fiscal relief | $1.24 | 3% |
| Child tax credit | $1.04 | 8% |
| Total |
| 38% |
| Lower “Bang for the Buck” |
|
|
| Marriage penalty relief | $0.74 | 0% |
| AMT adjustments | $0.67 | 1% |
| Marginal rate reductions for | $0.59 | 31% |
| Business investment write-off | $0.24 | 24% |
| Dividend tax reduction | $0.09 | 4% |
| Estate tax reduction | $0.00 | 2% |
| Total |
| 62% |
| Total “Bang for the Buck” | $0.74 | 100% |
| Source: Mark M. Zandi, “Assessing President Bush’s Fiscal Policies,” Economy.com. | ||
In light of these economic conditions, Zandi does not fault the President “…for his willingness to use all of the economic resources at his disposal to lift the heretofore flagging economy.” But he faults the President “…for how he has used those resources” (emphasis added).
The economic impact of the Administration’s tax policy has been undermined by the skewed distribution of its benefits, Zandi finds. A disproportionate share of the tax cuts went to those at the top of the income spectrum. Yet unlike low-and middle-income households, high-income households tend not to spend immediately the money that they receive. Zandi notes that higher income households “...are substantially less likely to spend any tax savings quickly than lower and middle income households.”
Since higher-income Americans tend to save rather than spend the money they receive, the economic “bang for the buck” of the President’s stimulus policy has, in Zandi’s words, “been substantially lacking.” Zandi assesses the 2001, 2002, and 2003 tax bills by analyzing the amount of additional economic demand produced for each dollar of lost government revenue or increased government spending in the year after the stimulus was provided. Zandi finds that these bills have cost more than $600 billion to date. As shown in Table 3, Zandi concludes that more than three-fifths of the stimulus package comes in the form of low “bang for the buck” provisions that produce less than one dollar of additional demand for each dollar of cost to the federal Treasury. In total, the bang for the buck of the Administration’s tax cuts has been just 74 cents per dollar of lost revenue.
To illustrate the relative inefficiency of the three tax bills, Zandi estimates the effects of an alternative stimulus package. His alternative proposal would have been temporary, cost far less than the Administration’s tax bills over the 2001-2004 period (and have no cost after that), and concentrated its benefits on low- and middle-income Americans. The alternative package includes a six-month payroll tax holiday, a one-time $300 tax cut for each adult and child (for up to two children in a family), and more generous state fiscal relief and federal unemployment benefits than were provided in the enacted package.
The average bang for the buck from this proposal would have been $1.20 in added economic demand for each dollar in cost — a much larger simulative effect than under the tax cuts that were enacted. As a result, using the Economy.com macroeconomic model, Zandi finds that even though the alternative package would have been significantly less costly in the short run, it would have provided a greater boost to overall economic output and created more jobs. Further, his alternative package would end in 2004, thereby avoiding the adverse economic effects that the enacted tax cuts will likely have over the long term.
The results of the Zandi analysis further confirm the thinking of most economists and previous CBO analysis. In 2002, CBO analyzed the stimulative effects of various fiscal policies. Like Zandi, it found that some of the largest tax cuts being pursued by the Administration and its congressional allies were among the least efficient ways available of stimulating the economy.[10]
The Job Front: Continued Weakness
One of the main themes (arguably the main theme) running through the Administration’s arguments for its tax cuts is their importance for job generation. Recent data confirm, however, that the
The Economic Policy Institute has tracked the progress of the job market, comparing actual results to Administration projections. EPI notes that the President’s Council of Economic Advisors estimated that, with the passage of the President’s proposed 2003 tax plan, 5.5 million jobs would be created from July 2003 through the end of 2004. This is equivalent to an average of 306,000 jobs per month starting in July 2003. The 2003 tax plan was adopted in a form that likely gave slightly more immediate stimulus to the economy than the Administration’s original proposal would have. Yet the number of jobs created has fallen far short of Administration expectations.[11]
- As Figure 1 shows, the job market has underperformed relative to Administration projections in 12 of the past 14 months.
- Although the job market did seem to gain steam in the spring of 2004, it has produced jobs at a slower rate in recent months. In August, the economy created 144,000 jobs or 162,000 jobs below the Administration’s monthly projections.
- EPI reports that in total, since July 2003, “there are 2,668,000 fewer jobs than the administration projected would be created by enactment of its tax cuts.” In the first 14 months of this period, a total of 1.6 million jobs have been created, which is just 38 percent of the Administration’s projection.
The weakness in the job market should not be attributed solely or primarily to the failure of Administration policies. Many factors affect the performance of the job market. The Administration, however, has not done the best it could to stimulate the economy and the job market, due to the substantially flawed design of its stimulus policy. As noted, Economy.com found an alternative stimulus package could have cost much less but produced more jobs.
Rising Deficits: Administration Data on the Role of the Tax Cuts
Despite overwhelming evidence to the contrary, a number of policymakers and activists continue to insist that the recent tax cuts have contributed little or nothing to the deterioration of the budget outlook. They either say or imply that the tax cuts “pay for themselves” — that by boosting the economy, the tax cuts can bring in as much or more revenue than they lose through lower tax rates and higher deductions or credits or other tax breaks.
Recent data from the Administration itself indicate, however, that there has been a real budgetary cost to the tax cuts. When the Administration took office in 2001, the
In Table 7 of its new Mid-Session Budget Review, the Administration shows that the tax cuts contributed substantially to the fiscal deterioration. According to the figures in this table:
- The tax cuts have cost about $620 billion over the last four years, including the cost of additional interest payments on the national debt.
- The cost of the tax cuts has ramped up substantially over time. In 2004 alone, the tax cuts add $290 billion to the deficit, constituting a substantial majority of the projected deficit of $445 billion.
- Among the budgetary factors over which policymakers have control (i.e., legislation that policymakers enact into law, as contrasted with changes in the economy), the tax cuts constitute the single largest cause of the shift from surpluses to deficits. The tax cuts are more expensive than all spending increases combined — including new spending for homeland security, the war in
Iraq Afghanistan
| Table 4 | ||
|
| 2001-2004 | Share, attributable to legislation |
| Surpluses projected in January 2001 | 1.3 | |
| Economic and technical reestimates | -1.0 | |
| Tax cuts | -0.6 | 57% |
| Spending increases | -0.5 | 43% |
| Subtotal enacted and assumed legislation | -1.1 | 100% |
| Current deficit estimate | -2.1 |
|
| Source: OMB, President’s Mid-Session Budget Review, Table 7. | ||
New CBO data released September 7 produce similar findings. They show that, to date, the tax cuts have accounted for 59 percent of the cost of legislation enacted since the beginning 2001 (very close to OMB’s estimate of 57 percent). And, according to the CBO data, the cost of the tax cuts will continue to mount. Calculations based on the CBO data show that, over the ten-year period from 2002-2011, the tax cuts will account for just over half of the cost of all new legislation enacted since 2001. (This assumes the tax cuts and other current budget policies are continued.) Over this ten-year period, the cost of the tax cuts, if made permanent, will total $2.8 trillion, including the additional interest payments on the national debt caused by the tax cuts.[12]
Conclusion
The latest evidence on the effects of the recent tax cuts is disturbing. In the short term, we have spent much for relatively little gain. Although the tax cuts are expensive, they have been relatively ineffective at stimulating a struggling economy and have provided the largest direct benefits to very high-income households.
In the long run, the tax cuts will likely do harm. The federal government is on an unsustainable fiscal course. Deficits may not be significantly harming the nation now because the economy has not yet fully recovered from the recent recession. Butlarge deficits extend as far as the eye can see. In a comprehensive new study of the effects of budget deficits on the economy, William Gale and
Appendix 1: The Changing Share of Tax Liabilities
The most meaningful measure of a tax cut’s distribution is its effect on after-tax income. After-tax income, or “disposable” income, is the amount that households have available for their personal needs and wants — shelter, food, medical care, travel, saving, and so on. CBO’s new report contains data allowing us to calculate changes in the distribution of after-tax income caused by the tax cuts; as shown in Table 1 of this analysis, these calculations reveal that the tax cuts increased the after-tax income of the well off much more than they increased the after-tax income of middle- and low-income Americans.
As a result, after-tax income is more concentrated at the very top of the income spectrum than it would be without the tax cuts. Because of the tax cuts, the share of the nation’s after-tax income possessed by the bottom 80 percent of households is lower than it otherwise would be while the share possessed by the top one percent of households is larger.
A variety of forces have increased income inequality in the
Based on the CBO report, some have claimed that the Administration’s tax cuts have actually made the tax system more progressive. They argue that high-income taxpayers are generally paying a significantly greater percentage of federal income taxes because of the 2001, 2002, and 2003 tax cuts; using this statistic, they conclude that “high-income taxpayers had a comparable reduction in tax burden to middle-income taxpayers due to the Bush tax cuts.”[14] This assertion has been featured in statements by the Administration, Republican lawmakers, and conservative analysts.
A fundamental problem with these assertions is that they ignore taxes other than the income tax. Unlike the progressive income tax, other federal taxes — in particular, the payroll tax — are regressive, with middle-and low-income households devoting a greater share of their income to paying these taxes than those at the top of the income scale. Other CBO data show that three-fourths of all tax filers pay more in payroll taxes than they do in income taxes. By reducing income and estate taxes while leaving other taxes unchanged, the Administration’s tax cuts have shifted the source of federal revenues from progressive income taxes towards more regressive payroll taxes. Analyzing tax burdens by focusing solely on the income tax and ignoring other taxes produces misleading results, a trap into which CBO did not fall.
More fundamentally, assessing the share of taxes that different income groups pay is not especially meaningful for assessing the distributional effects of the tax cuts. Essentially, such a statistic tells us that the upper-income group will be paying a larger share of the much smaller amount of federal taxes being collected after the tax cuts. It is possible to increase the share of taxes paid by the well off at the same time that one makes after-tax income more unequal; those who focus on changes in the share of taxes paid are not focusing on the most meaningful results. It is the after-tax income data that indicate the degree to which the tax cuts have affected how much households have at their disposal.
For example, if all federal taxes were eliminated except for a tax of $1 a year on the top one percent of households, these high-income households would be paying 100 percent of all federal taxes. By this measure, the tax cut would be called “progressive.” Nonetheless, high-income earners would disproportionately benefit from the tax cut. A large, progressive tax system — that had substantially increased the share of disposable income going to low- and middle-income Americans — would have been replaced with one that is nearly non-existent. Thus, high-income Americans would see a far greater percentage increase in their disposable income than all others. The fact that the remaining $1 per year system would be paid entirely by the top one percent would make no real difference at all. Moreover, the virtual repeal of the tax system would presumably lead to reductions in programs that primarily benefit middle- and low-income households, as most major federal programs do.
Finally, in assessing the net impact of the tax cuts on various groups, it is also necessary to consider how they will be paid for. As discussed in the text, once the tax cuts are paid for, it is very likely that low- and middle-income taxpayers will be worse off in absolute terms — the offsetting spending cuts or tax increases that ultimately will have to be adopted will reduce the income of the low- and middle-income Americans more than the tax cuts increase their income. Those at the top of the income spectrum, by contrast, will still see substantial net benefits from the tax breaks. In sum, the tax cuts have already increased disparities in after-tax income, and once they are paid for, these disparities almost surely will be even greater.
Appendix 2: CBO Also Finds that Administration Tax Cuts Would Substantially Reduce Charitable Giving
In another new study, CBO finds that charitable causes are likely to suffer due to the gradual elimination of the estate tax enacted in the 2001 tax bill. The study examines the effect of the estate tax on charitable giving and finds that its elimination — which benefits only the wealthiest Americans — would cause charitable contributions to fall by large amounts.[15]
- According to CBO estimates, if estate-tax repeal had been in effect in 2000, charitable donations would likely have been reduced by $13 billion to $25 billion that year. The drop in donations would come entirely from reduced giving by the wealthiest Americans, who would no longer be encouraged by the estate tax to donate more in order to reduce the size of their estate and, thus, their estate tax liability.
- The amount by which CBO finds that charitable donations would fall exceeds the total amount of corporate charitable donationsin the
United States - The drop in charitable giving by the very wealthy would almost certainly disproportionately harm low-income Americans, many of whom benefit from giving to charitable causes.
End Notes
[1] Congressional
[2] Chairman Alan Greenspan in “U.S. Representative Jim Nussle (R-IA) Holds Hearing on the Budget and the Economy,” FDCH Political Transcripts,
[3] CBO, “Effective Federal Tax Rates Under Current Law: 2001-2004,” August 2004.
[4] The minority staff of the Joint Economic Committee also derived such estimates in JEC Democrats, “New CBO Analysis Confirms that the Bush Tax Cuts are Skewed Toward the Rich,” August 2004.
[5] We also emphasize the estimates without corporate tax cuts because the effects of the corporate tax cuts actually change direction after 2004. The 2002 tax bill included — and the 2003 tax bill expanded — a corporate tax break known as “bonus depreciation” that allows corporations to defer tax payments to future years by taking large write-offs today. Due to bonus depreciation, corporations pay much lower taxes from 2002 through 2004 and somewhat higher taxes in the future. Thus, the inclusion of the corporate tax cuts leads to larger overall tax cuts now, but smaller overall tax cuts in the future.
[6] If CBO’s estimate of the effects of corporate tax cuts in 2004 is included, the top one percent see an after-tax income gain of 10.1 percent.
[7] It may be noted that tens of millions of households received no tax cut whatsoever. Those left out from the tax cuts tend to be poor, single individuals, as well as families with children that have earnings of less than $10,750.
[8] William G. Gale, Peter R. Orszag, and Isaac Shapiro, “The Ultimate Burden of the Tax Cuts: Once They are Paid For, Low- and Middle-Income Households Likely to be Net Losers, On Average,” Urban-Brookings Tax Policy Center and Center on Budget and Policy Priorities, June 2, 2004.
[9] Mark M. Zandi, “Assessing President Bush’s Fiscal Policies,” Economy.com, July 2004.
[10] CBO, “Economic Stimulus: Evaluating Proposed Changes in Tax Policy,” January 2002.
[11] Economic Policy Institute, “Job Watch: Tracking Jobs and Wages,” accessed
[12] For more details on the new CBO data and the methodology behind these calculations, see
[13] William G. Gale and Peter R. Orszag, “
[14] “Statement of Senators Chuck Grassley, Don Nickles, and Robert Bennett Regarding a Congressional Budget Office Paper ‘Effective Federal Tax Rates Under Current Law, 2001 to 2014,’”
[15] CBO, “The Estate Tax and Charitable Giving,” July 2004. For further analysis of the CBO report, see David Kamin, “New CBO Study Finds That Estate Tax Repeal Would Substantially Reduce Charitable Giving,” Center on Budget and Policy Priorities,
More from the Authors


David Kamin is Professor of Law at New York University School of Law.
Kamin was a Research Assistant with the Center from 2003 through July 2005. Kamin's focus was on federal tax and budget policy, especially with regards to the cost and impact of federal tax bills. Kamin graduated from Swarthmore College with a B.A. in Economics and Political Science. Prior to joining the Center, he worked as a Research Associate at the Committee for Economic Development focusing on federal budget policy.