New IRS Data Show Income Inequality Is Again On The Rise
New figures from the Internal Revenue Service show that income disparities grew substantially from 2002 to 2003. After adjusting for inflation, the after-tax income of the one percent of households with the highest incomes shot up in 2003 by an average of nearly $49,000 per household while the after-tax incomes of the bottom 75 percent of households fell on average. The term “household” here refers to tax filers with positive amounts of adjusted gross income.
The IRS data are especially important because they provide the first full snapshot of trends since 2002 at the very top of the income spectrum; Census data through 2004 fail to capture this information because they omit a substantial share of the income at the top of the income spectrum (such as all capital gains income and all earnings above $999,999 per year). The less complete Census data as well as other information do suggest, however, that income disparities have widened further since 2003 and that it has been an uneven recovery.
Income disparities are again widening in the United States even though they were already at near-record levels. Data from the Congressional Budget Office that go through 2002 show that income inequality that year was wider than in all but six years (1988 and 1997-2001) since the middle of the 1930s.
This backdrop is worth noting as Congress proposes to tackle “reconciliation” legislation that will likely result in cuts to programs for the poor and the middle class but new tax reductions of greatest benefit to the wealthy. The net effect of such an approach would be to widen further the gulf between high-income households and other Americans.
The New IRS Data
The IRS data (released October 4) reflect adjusted gross income, as reported on income tax returns, and the federal income taxes paid on that income. The data cover people with positive adjusted gross income. [1] The focus here is on adjusted gross income after federal income taxes, referred to as "after-tax income." The IRS figures are adjusted for inflation and expressed in 2003 dollars.
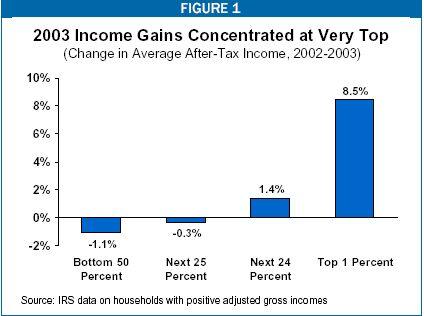
This analysis finds that from 2002 to 2003:
- The average after-tax income of the one percent of tax filers with the highest incomes increased 8.5 percent, from $572,000 to $620,700. Within the top one percent, moreover, the top sliver of this group (the top one-tenth of one percent) fared best of all. [2]
- In contrast, the average after-tax income of the bottom 75 percent of tax filers fell slightly.
- The share of total after-tax income received by the top one percent of tax filers rose from 13.5 percent to 14.4 percent. The shares of after-tax income going to the bottom 90 percent of tax filers all fell.
To be sure, the share of total after-tax income going to those with the highest incomes remains significantly below what it was in 2000, when both the stock market and the incomes at the very top peaked. Nonetheless, income is extraordinarily concentrated today. According to the IRS data, the share of after-tax income going to the top one percent was larger in 2003 than in all but five years (1997-2001) since 1979 (the first year for which these IRS data are available). A later section of this paper provides information covering a much longer time span, as well as data showing that actual gains in income since 1979 have been dramatic for high-income households but modest for middle- and low-income households.
Other Indicators Since 2003
The new IRS data are for 2003. A variety of other information suggests that income inequality has grown further since then. Consider:
- Census data show that the top five percent of households experienced income gains from 2003 to 2004 while the rest of households did not. Most other households, in fact, saw their incomes decline from 2003 to 2004. [3] These data, moreover, are likely to understate any divergence in incomes in 2004. The Census data do not break out trends among the top one percent of households, where income gains may have been especially concentrated. In addition, as noted above, the Census data do not include significant amounts of income received by high-income households; for instance, there is a salary ‘cap’ of $1 million; all earnings above that level are disregarded.
- During this recovery period, wages and salaries as a whole have grown less than half as fast as the average growth during other post-World War II recoveries. Meanwhile, corporate profits have grown more than half as fast as in other recoveries.[4] The ultimate beneficiaries of these large gains in corporate profits are primarily high-income households, since they own the lion’s share of the stocks of corporations.
- Separate surveys of pay trends by Business Week and Forbes magazines both found huge increases in the compensation of chief executive officers (CEOs) in 2004. The Business Week article observed that from 2003 to 2004 “CEO raises and total pay once again dwarfed those of the average worker.”[5] The Forbes report found that the CEOs of the nation’s 500 largest companies received an “aggregate 54 percent pay raise last year…. That easily outpaced 2003’s eight percent raise.”[6] (The income gains among highly-paid CEOs are not captured by the Census data.)
- The rise in federal tax revenues in 2005 also appears to stem in part from a continued growth in income inequality. In May, CBO said that one possible reason that revenues were coming in faster than it forecast earlier this year was that increases in income may have been more concentrated among high-income taxpayers than it anticipated.[7] High-income taxpayers pay taxes at higher rates, so an increasing concentration of income results in a higher level of revenue. In an August report, CBO stressed that much of the recent growth of revenues has occurred because of a boom in corporate tax receipts rather than in taxes on wages and salaries. [8] This development also is consistent with the notion of increased income inequality.
- In recent testimony before Congress, Federal Reserve Board Chairman Alan Greenspan also reiterated his conclusion that income is becoming more concentrated. In response to a question, he said there is a “really serious problem here, as I’ve mentioned many times before this [House] committee, in the consequent concentration of income that is rising.” [9]
CBO Data
The single best source of information on income trends is a data series that the Congressional Budget Office issues. The CBO data series is based heavily on the IRS data for its information about income at the top of the spectrum, but makes several improvements. For instance, the IRS data do not cover the entire population; they do not cover households that lack any adjusted gross income, have negative income, or have incomes so low that they do not file tax returns. CBO supplements the IRS data with Census data so it can cover the entire population. In addition, CBO data take into account the effect of all federal taxes, while the IRS data reflect federal income taxes only. Further, CBO uses a broader measure of income than does the IRS.
At present, the CBO data go through 2002. Released in March of this year,[10] the data show that between 1979 (the first year that the data cover) and 2002:
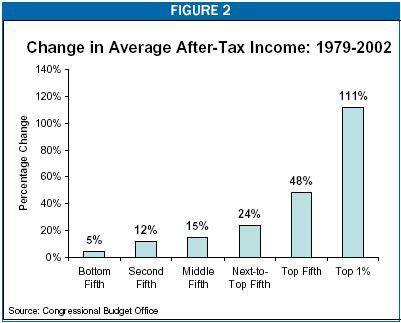
The average after-tax income of the top one percent of the population more than doubled, rising from $298,900 to $631,700. In other words, the after-tax income of households in the top one percent rose by $332,800, or 111 percent, over this period. (CBO adjusted these figures for inflation and expressed them in 2002 dollars. As noted, these dollar figures are not strictly comparable to the dollar figures in the IRS data cited above, because CBO and IRS do not use identical measures of income and for other reasons.)
- By contrast, the average after-tax income of the middle fifth of the population rose a relatively modest 15 percent, or $5,700, over this period, reaching $43,700 in 2002.
- The average after-tax income of the poorest fifth of the population rose only 5 percent, or $600, over the period, to $13,800 in 2002.
Because incomes grew fastest among the most affluent, this group’s share of the total national income grew as well.
- The top one percent of the population received 11.4 percent of national after-tax income in 2002, up from its 7.5 percent share in 1979. (Each percentage point of after-tax income is equivalent to $62 billion in 2002 dollars.)
- In contrast, the shares of national income received by various groups of low- and middle-income people all fell. The middle fifth of the population received 16.5 percent of the national after-tax income in 1979, but 15.8 percent in 2002. The bottom fifth received 6.8 percent of such income in 1979, but 5.1 percent in 2002.
Income was more concentrated at the very top of the income spectrum in 2002 (that is, even before the rise in income inequality in 2003) than in all but six years since the mid-1930s. This conclusion is reached by viewing the CBO data in conjunction with data from a ground-breaking historical analysis of income distribution trends published in a leading economics journal. [11] Viewed together, the studies indicate that the richest one percent of households received a larger share of the national income in 2002 than at any time since 1937, except for 1988 and the period from 1997 to 2001.[12]
| Average After-Tax Income by Income Group | ||||
| Income Category | 1979 | 2002 | Percent Change | Dollar Change |
| Lowest fifth | $13,200 | $13,800 | 4.5% | $600 |
| Second fifth | $26,700 | 29,900 | 12.0% | $3,200 |
| Middle fifth | $38,000 | $43,700 | 15.0% | $5,700 |
| Fourth fifth | $49,800 | $61,700 | 23.9% | $11,900 |
| Top fifth | $87,700 | $130,000 | 48.2% | $42,300 |
| Top 1 Percent | $298,900 | $631,700 | 111.3% | $332,800 |
| Source: Congressional Budget Office, Effective Federal Tax Rates: 1979-2002, March 2005. | ||||
Federal Policies Are Exacerbating Income Disparities
The major tax bills that have been enacted since 2001 have served to further concentrate income at the top of the income spectrum. These tax cuts have helped high-income households far more than other households. This can be seen by examining information on the combined effect of the tax-cut bills adopted in 2001, 2002, and 2003. According to data from the Urban Institute-Brookings Institution Tax Policy Center:
- In 2005, the bottom fifth of households will receive an average combined tax cut of $18 from these bills, raising their after-tax income by 0.3 percent.
- The middle fifth of households will receive an average tax reduction of $742, increasing their after-tax income by 2.6 percent.
- The top one percent of households, however, will receive an average tax reduction this year of $34,900 — leading to a jump in their after-tax income of 4.6 percent.
- And households with incomes exceeding $1 million will fare best of all, receiving an average tax cut of $103,000 — an increase of 5.4 percent in their after-tax income, more than double the percentage increase received by the middle fifth.
Further, some of the tax cuts that were enacted in 2001 are still being phased in. These tax cuts are heavily tilted to those at the top of the income scale. These tax cuts include the elimination of the tax on the nation’s largest estates as well as two tax cuts that will start to take effect in 2006 and will go almost entirely to high-income households (97 percent of the tax cuts from these two measures will go to people with incomes above $200,000).[13] Consequentially, the tax cuts ultimately will be even more skewed toward high-income households than they were in 2005.
To date, the President and Congress have taken little heed of the trend toward increasing income concentration, and have not shown concern about the degree to which the tax cuts are exacerbating income disparities. To the contrary, Congress (with the President’s support) is on track to pass “reconciliation” legislation this fall that is expected to include cuts to programs assisting low- and middle-income households at the same time that it extends tax cuts — such as the reduction in taxes on capital gains and dividend income — that are of primary benefit to high-income households. Such legislation would continue the pattern of recent years, under which actions by federal policymakers have contributed to a further widening of income disparities between the most affluent households and other Americans.
End Notes
[1] “Adjusted gross income” is defined as gross income reduced by certain amounts, such as interest paid on student loans or the amount of an IRA contribution that is not subject to taxation. AGI is the definition of income used by the IRS to calculate individual income tax liabilities.
[2] David Cay Johnston, “At the Very Top, a Surge in Income in ’03,” The New York Times, October 5, 2005, page C4.
[3] After adjusting for inflation, from 2003 to 2004 the average income of the top five percent of households rose by an average of $4,340 or 1.7 percent. By contrast, for example, the average income of the middle fifth of households fell by $300 or 0.7 percent.
[4] Isaac Shapiro, Richard Kogan, Aviva Aron-Dine, “How Does This Recovery Measure Up,” Center on Budget and Policy Priorities, August 9, 2005.
[5] Louis Lavelle, “A Payday For Performance,” Business Week online, April 18, 2005.
[6] Scott DeCarlo, “CEO Compensation,” Forbes, April 21, 2005.
[7] Congressional Budget Office, Monthly Budget Review, May 5, 2005.
[8] Congressional Budget Office, The Budget and Economic Outlook: An Update, August 2005.
[9] Federal Reserve Board Chairman Alan Greenspan, Testimony before the House Financial Services Committee, July 20, 2005.
[10] Congressional Budget Office, Historical Effective Federal Tax Rates: 1979 to 2002, March 2005.
[11] Thomas Pickety and Emmanuel Saez, “Income Inequality in the United States, 1913-1998,” Quarterly Journal of Economics, 118, 2003. Their tables have been updated through 2002 at http://emlab.berkeley.edu/users/saez/
[12] Data for 1986 are ignored in this comparison. Incomes at the top were distorted that year because high-income taxpayers made temporary adjustments to their incomes in response to the enactment of the Tax Reform Act of 1986.
[13] Robert Greenstein, Joel Friedman, and Isaac Shapiro, “New Tax Cuts Primarily Benefiting Millionaires Slated to Take Effect in January,” Center on Budget and Policy Priorities, September 19, 2005.