The Value of TANF Cash Benefits Continued to Erode in 2012
Cash assistance benefits for the nation’s poorest families with children fell again in purchasing power in 2012 and are now at least 20 percent below their 1996 levels in 37 states, after adjusting for inflation. Unlike in 2011, when six states reduced the already-low benefits they provide through the Temporary Assistance for Needy Families (TANF) program, no states cut benefit levels in 2012. A few states increased their family grants, but most states kept them unchanged, allowing the benefits to continue to be eroded by inflation. With the country’s economic outlook looking somewhat more favorable in the coming year, it is time for states to halt the erosion of TANF benefits and slowly regain some of the purchasing power lost over the past 16 years.
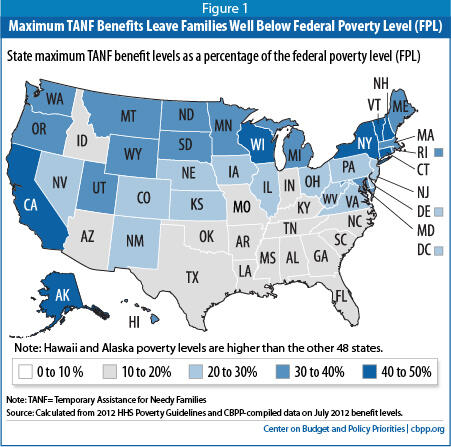
For a majority of recipients, the purchasing power of TANF benefits is below 1996 levels, after adjusting for inflation. These declines came on top of even larger declines in benefits over the preceding quarter-century; between 1970 and 1996, cash assistance benefit levels for poor families with children fell by more than 40 percent in real terms in two-thirds of the states. As of July 1, 2012, benefits for a family of three with no other cash income for all states were below 50 percent of the federal poverty line, measured as a share of the Department of Health and Human Services poverty guidelines for 2012. Benefits were below 30 percent of the poverty line in the majority of states. There is not a single state in the nation in which the TANF benefit level for a family of three with no other cash income is at least equal to the Fair Market Rent for a two-bedroom apartment.[1] In fact, in 25 states, TANF benefits amount to less than half of the Fair Market Rent.
TANF provides a safety net to relatively few poor families: in 2011, just 27 families received TANF benefits for every 100 poor families, down from 68 families receiving TANF for every 100 in poverty in 1996. But for the families that participate in the program, it often is their only source of support and without it, they would have no cash income to meet their basic needs.
This paper is an annual update of state TANF benefit levels as of July 1 each year (the beginning of the fiscal year for most states). This update covers the changes in TANF benefit levels between July 1, 2011 and July 1, 2012. The benefit levels cited here reflect the benefits for a family of three with no other income as of July 1, 2012.
End Notes
Endnotes:
[1] The Fair Market Rent is the U.S. Department of Housing and Urban Development’s estimate of the amount needed to cover the rent and utility costs of a modest housing unit in a given local area.More from the Authors