The Ryan Budget’s Tax Cuts: Nearly $6 Trillion in Cost and No Plausible Way to Pay for It
New Tax Policy Center Estimates Show $5.7 Trillion Revenue Loss
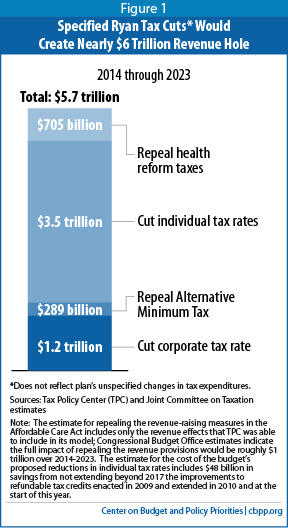
The new budget from House Budget Committee Chairman Paul Ryan proposes a series of dramatic tax cuts that would cost nearly $6 trillion in lost federal revenue over the next decade (see Figure 1), and that would provide the lion’s share of their benefits to high-income households and corporations. But, despite its stated promise to the contrary, the budget does not include a plausible way to pay for it all.
The budget sets a goal of cutting the top individual tax rate to 25 percent (from 39.6 percent) and it would repeal the Alternative Minimum Tax (AMT), which is designed to ensure that high-income people pay at least a minimum level of tax. It would cut the corporate tax rate to 25 percent (from 35 percent) and greatly cut taxes on corporations’ foreign profits. It also would repeal all of the revenue-raising measures of health reform (i.e., the Affordable Care Act or ACA), which are designed to help offset the cost of that law’s health insurance coverage expansions.
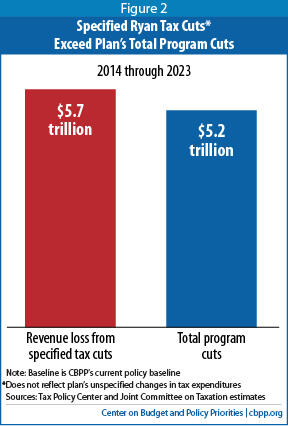
Estimates from the Urban-Brookings Tax Policy Center (TPC) show those tax cuts would cost the federal government nearly $6 trillion over the next decade, which exceeds the Ryan budget’s total spending cuts, exclusive of its interest savings. These tax cuts would provide extremely large new tax cuts to wealthy Americans, even as Chairman Ryan’s spending cuts would fall disproportionately on the most vulnerable individuals and families.[1]
Chairman Ryan offers no proposals to offset the nearly $6 trillion in costs. He only links to a tax reform framework from House Ways and Means Committee Chairman Dave Camp, which mentions “scaling back tax preferences that distort economic behavior” but provides no details on how to do so.[2] The Ryan budget does not identify a single deduction, credit, exclusion, or other preference to narrow or close.
If, on the other hand, policymakers truly sought to offset the full $6 trillion in costs by scaling back tax expenditures, they could only do so by increasing taxes on households with incomes below $200,000. When the TPC analyzed a similar plan from Governor Romney — which would have cut the top income-tax rate from 35 to 28 percent — it found that even after dramatically scaling back tax expenditures for filers with incomes above $200,000, Romney’s plan would still have provided large net tax cuts to those households. To pay for these tax cuts without adding to the deficit, TPC estimated that families with children and with incomes below $200,000 would have faced tax increases of about $2,000 per family, on average.
The tax cuts that Chairman Ryan seeks are substantially larger than Governor Romney’s, with a goal of cutting the top rate from 39.6 to 25 percent. Without any cuts to tax expenditures, reaching the Ryan budget’s goal of a 25 percent top rate while abolishing the AMT and repealing the Affordable Care Act’s revenue-raising measures would result in tax cuts worth an average of about $330,000 a year to households with incomes of more than $1 million a year; the tax cuts for high-income filers would necessarily be larger under Ryan’s plan than under Romney’s.[3] As explained below, even with the same dramatic scaling back of tax expenditures for filers with incomes above $200,000 that TPC examined in its Romney analysis — including entirely wiping out their deductions for mortgage interest and charitable giving — families with children that have incomes below $200,000 would have to face tax increases averaging more than $3,000 a year, if policymakers were to avoid increasing the deficit while reaching Chairman Ryan’s 25-percent top-tax-rate goal.
A Massive New Revenue Hole
Tax Policy Center estimates show that the Ryan tax cuts would cost nearly $6 trillion over 2014 to 2023.[4] ) (See Figure 1.) This includes:
- Cutting the top corporate tax rate from 35 to 25 percent, at a cost of about $1.2 trillion.Image
- Chairman Ryan’s proposal to cut the top individual tax rate to 25 percent and repeal the AMT, at a cost of $3.8 trillion. (Chairman Ryan proposed cutting the top tax rate to 25 percent in his previous budget, but it would cost even more now because the American Taxpayer Relief Act (ATRA) enacted in January raised the top individual income-tax rate from 35 percent to 39.6 percent. Cutting the top rate from 39.6 percent to 25 percent, as the new Ryan budget proposes, would cost substantially more than cutting it from the old 35 percent to 25 percent.[5] )
- Repealing the revenue provisions in the ACA. As Chairman Ryan’s staff confirmed, the Ryan budget would repeal “all of [the ACA’s] tax increases.”[6] TPC was able to include in its estimate the cost of some of the ACA tax provisions, totaling $705 billion, but not all.[7] (CBO estimates indicate that the cost of repealing all of the ACA taxes, as Chairman Ryan proposes, would be about $1 trillion over ten years.[8]) The ACA’s revenue-raising measures are progressive, with some of its key provisions — such as its increase in Medicare payroll taxes for high-income households — focused on people on the upper rungs of the income ladder.
Together, the tax cuts in the Ryan budget total nearly $6 trillion in lost revenue. That exceeds the $5.2 trillion in program cuts the budget calls for (see Figure 2, and box on page 5).
Either tax increases for households with incomes below $200,000, or higher deficits
The Ryan budget assumes that overall revenues would remain at the same level as under current law — that is, at the same level as under a tax code with a top individual tax rate of 39.6 percent, a 35 percent corporate tax rate, the recently modified AMT, and the revenue measures in the ACA. It assumes that savings from scaling back tax expenditures would cover all of these tax cut costs. As noted, it identifies no specific tax expenditures to curb.
The President has proposed limiting tax preferences for high-income people by capping their value at 28 cents on the dollar and, with the new ATRA tax rates, that proposal would likely raise about $500 billion over ten years.[9] The Ryan budget would have to raise more than ten times that amount from scaling back tax expenditures just to keep its revenue measures from expanding the deficit.
The difficulty of doing so without boosting either deficits or tax burdens on households with incomes below $200,000 was driven home in last year’s presidential campaign. TPC analyzed Governor Romney’s individual income tax plan, which would have cut the top tax rate from 35 to 28 percent. TPC estimated that without cuts to tax expenditures, the Romney plan would have cut taxes for households with incomes over $200,000 by about $28,000 on average, and cut taxes for households with incomes over $1 million a year by more than $175,000 on average.
TPC also found that even if Romney accompanied his rate cuts with drastic base-broadening measures — including, for high-income filers, completely eliminating the tax breaks related to mortgage interest, charitable deductions, and employer-sponsored health insurance, among others — his plan still would cut taxes by an average of nearly $10,000 a year for households with incomes above $200,000, and by an average of nearly $90,000 for people with incomes over $1 million a year.
TPC also found that to fully offset the cost of the Romney tax cuts for households with incomes above $200,000, policymakers wouldhave to raise taxes on families with children and with incomes below $200,000 by about $2,000, on average. [10]
The math for the Ryan tax proposals is even more challenging because its tax-rate cuts are much bigger than Romney’s. Under the Romney plan, the top tax rate would have fallen by 7 percentage points, from 35 to 28 percent. Under the Ryan plan, however, it would fall by 14.6 percentage points, from 39.6 to 25 percent. Based on TPC estimates, and as the Appendix explains in more detail, we estimate that:
- Without any reductions in tax expenditures, the tax cut goals in the Ryan budget would cut taxes for households with incomes over $200,000 by about $34,500 and cut taxes for households with incomes of more than $1 million a year by about $330,000 on average.
- If policymakers enacted the same extremely ambitious reductions in tax expenditures for filers with incomes above $200,000 that TPC assumed when it analyzed Romney’s tax plan, filers with incomes of $1 million or more would lose tax breaks totaling about $90,000 on average — still leaving them with an average net tax cut of about $245,000. Households with incomes above $200,000 would get a net cut of about $16,000.
- And, to fully finance the tax cuts for people with incomes over $200,000, filers with children and incomes under $200,000 would see their taxes go up by more than $3,000 on average, even with the ambitious reductions in tax expenditures for high-income households that TPC examined.
Ryan’s $5.2 Trillion Spending Cut
The Ryan budget proposes $5.2 trillion in budget cuts through 2023. Chairman Ryan uses a figure of $4.6 trillion for the size of his spending cuts over this period, reflecting $3.9 billion of policy savings and $700 billion in interest savings. Chairman Ryan starts, however, from a “baseline” that builds in certain savings: permanent sequestration, steep cuts in Medicare payments to doctors under the Sustainable Growth Rate (SGR) formula, reductions in war funding beyond current policy, and the expiration of refundable tax credit provisions after 2017. We, like the Committee for a Responsible Federal Budget (CRFB), use a current policy baseline that does not assume nine years of sequestration cuts, assumes a reduction in war funding in accordance with CBO estimates, and assumes policymakers will extend relief from the scheduled SGR cuts as well as the refundable tax credit provisions, as they have done in the past. As a result, we treat proposals to retain the sequestration savings and the SGR cuts, and to allow the refundable tax credit provisions to end, as reductions in spending. Together, they reflect $1.3 trillion in savings through 2023.
Measured from the current policy baseline that CRFB and we use, the Ryan budget contains $5.2 trillion in spending reductions, not counting its interest savings. Of this $5.2 trillion, $5.0 trillion are cuts to non-defense programs and about $200 billion are war savings. (See Richard Kogan and Kelsey Merrick, “Chairman Ryan Gets 66 Percent of His Budget Cuts from Programs for People With Low or Moderate Incomes,” Center on Budget and Policy Priorities, March 15, 2013, https://www.cbpp.org/cms/index.cfm?fa=view&id=3925.)
Conclusion
Even with sweeping and implausible reductions in tax expenditures for high-income filers, policymakers could not achieve the tax cut goals in the Ryan plan without either adding to the deficit or raising taxes on households with incomes below $200,000 to fill the revenue hole.
Appendix
The Tax Policy Center has estimated the distributional effect of the Ryan plan, compared to current law.[11] These estimates include the impact of the Ryan plan’s reduction in the top corporate tax from 35 to 25 percent. We sought to examine just the effects of the plan’s individual income tax cuts, and so removed the effects of the corporate rate cut that were included in TPC’s analysis.[12] This change has the effect of reducing the size of the tax cut for high-income taxpayers compared to last year’s TPC analysis.
This gave us an estimated distribution of the gross individual tax cut that would result from the budget’s stated goal of reducing the top rate to 25 percent (without assuming reductions in tax expenditures to pay for the tax cuts). As discussed in the paper, we estimate that households with income over $1 million would receive a gross tax cut of about $330,000 on average from the Ryan plan’s individual income tax cut goals.
The estimate almost certainly understates the gross tax cuts for high-income filers. TPC’s analysis takes into account the effect of only a portion of the revenue-raising measures enacted as part of health reform; Chairman Ryan has said he would repeal all of those measures. The benefit to high-income filers would increase if the analysis included the effects of repealing all of these provisions.
Further, the TPC estimates give Ryan the benefit of the doubt about some tax provisions that he has previously said he would cut. The American Taxpayer Relief Act increased the capital gains and dividends tax rates that high-income households pay from 15 percent to 20 percent and reinstated the limitation on itemized deductions (known as the “Pease” provision) and the phase-out of personal exemptions (known as PEP) for upper-income taxpayers.[13] Last year’s Ryan budget assumed the lower 15 percent rate in capital gains and dividends and repeal of Pease and PEP. This year’s budget is silent on these provisions, and TPC’s analysis assumes they would remain in effect.
Estimating Cuts in Tax Expenditures
The Ryan budget assumes that all of its proposed tax cuts are paid for by broadening the tax base to produce revenue-neutral reform. Chairman Ryan provides no detail of what base broadening — cuts to the deductions, exemptions, exclusions, credits, and other tax preferences known collectively as “tax expenditures” — would be used to pay for his specified tax cut goals. To estimate the possible effect of base broadening on the tax liabilities of households in different income groups, we examine the effects of including the aggressive reductions in tax expenditures that TPC modeled when it analyzed Governor Romney’s plan.
To analyze whether the Romney plan could meet its distributional and revenue goals, TPC assumed that base broadening would occur “starting at the top,” with various tax expenditures being reduced or eliminated first for high-income taxpayers in order to pay for as much as possible of the Romney plan’s tax cuts. TPC assumed that all itemized deductions, the tax exclusion for employer-sponsored health insurance, and education tax credits would be eliminated for households with incomes above $200,000. TPC found that even under these extremely aggressive assumptions regarding cuts in popular tax expenditures, filers with incomes above $200,000 would still get a large net tax cut under the Romney plan, because the rate cuts would be so large. For the Romney plan not to increase the deficit, TPC found, net taxes would have to rise for filers with incomes below $200,000.
To analyze the Ryan budget’s tax plan, we took the same “starting at the top” approach as TPC used in assessing the Romney plan. We found that filers with incomes of $1 million or more would lose tax breaks worth about $90,000, on average — but that this would leave them with a net tax cut of $245,000. Overall, households with income above $200,000 would get an average net tax cut under the Ryan plan, while filers with incomes below $200,000 would, on average, face a net tax increase if the plan were to be revenue neutral. Both the tax cut for high-income filers and the tax increase for filers with incomes below $200,000 would necessarily be larger than under the Romney plan because the Ryan plan has a much bigger reduction in the top income tax rate.[14]
Our estimates of the net impact of the Ryan plan are rounded numbers because there may be small differences in the economic assumptions and methodology behind various TPC tables that were produced in different years.
End Notes
[1] See the following CBPP reports: Richard Kogan and Kelsey Merrick, “Chairman Ryan Gets 66 Percent of His Budget Cuts from Programs for People With Low or Moderate Incomes,” March 15, 2013, https://www.cbpp.org/cms/index.cfm?fa=view&id=3925; Dottie Rosenbaum, “Ryan Budget Would Slash SNAP Funding By $135 Billion Over Ten Years,” March 15, 2013, https://www.cbpp.org/cms/index.cfm?fa=view&id=3923; and Paul N. Van de Water, “Medicare in Ryan’s 2014 Budget,” March 15, 2013, https://www.cbpp.org/cms/index.cfm?fa=view&id=3922.
[2] David Camp, Chairman, U.S. House of Representatives Committee on Ways and Means, Letter to the Honorable Paul Ryan, http://budget.house.gov/uploadedfiles/fy14budgetletterwm.pdf.
[3] TPC estimates that the combined individual and corporate tax cuts in the Ryan plan would be worth $408,497 to households with income above $1 million. Our estimate reflects just the impact of the individual tax cuts, with the effects of the corporate tax cuts removed. See TPC Table T13-0110.
[4] Tax Policy Center table T13-0112, http://www.taxpolicycenter.org/numbers/displayatab.cfm?Docid=3870&DocTypeID=5; JCT estimates.
[5] Revenue losses from tax cuts are relative to CBPP’s current policy baseline. See Richard Kogan and Kelsey Merrick, “Chairman Ryan Gets 66 Percent of His Budget Cuts from Programs for People With Low or Moderate Incomes,” Center on Budget and Policy Priorities, March 15, 2013, https://www.cbpp.org/cms/index.cfm?fa=view&id=3925.
[6] Jennifer Haberkorn and Brett Norman, “At heart of Paul Ryan budget: Repealing Obamacare,” March 13, 2013, http://dyn.politico.com/printstory.cfm?uuid=BFA40875-D13A-4691-A4B1-659E2207DFA6.
[7] The TPC estimates include the cost of: the 0.9 percent additional tax on earnings; the 3.8 percent Medicare payroll tax on investment income; the increase in the floor for deductible medical expenses to 10 percent of adjusted gross income; the health insurer excise tax; the excise tax on high-premium health insurance plans; and the penalties on employers of more than a certain size that do not offer health insurance to their employees.
[8] CBPP calculation of Congressional Budget Office estimates from “Letter to Speaker John Boehner from Director Doug Elmendorf,” July 24, 2012, p 6, http://www.cbo.gov/sites/default/files/cbofiles/attachments/43471-hr6079.pdf.
[9] The President’s proposal, as stated in the Administration’s fiscal year 2013 budget, would have raised $520 billion over the 2013-2022 period, according to the Joint Committee on Taxation. Because ATRA does not fully return tax rates on income above $250,000 to Clinton-era levels, as that estimate assumed, the proposal now would likely raise somewhat less than this amount.
[10] Samuel Brown, William G. Gale, and Adam Looney, “On the Distributional Effects of Base-Broadening Income Tax Reform,” Tax Policy Center, August 1, 2012, http://www.taxpolicycenter.org/publications/url.cfm?ID=1001628.
[11] Table T13-0110.
[12] To do this we used table T12-0040 and Table 3 in Samuel Brown, William G. Gale, and Adam Looney, “On the Distributional Effects of Base-Broadening Income Tax Reform,” Tax Policy Center, August 1, 2012, http://www.taxpolicycenter.org/publications/url.cfm?ID=1001628.
[13] Tables T13-0014, T13-0017, and T13-0064.
[14] This estimate is generous to Rep. Ryan, because it assumes the same amount of tax expenditure cuts would be achievable under the Ryan tax rate structure as TPC assumed was plausible under the Romney tax rate structure. Ryan’s top tax rate goal, however, is 25 percent — below the 28 percent that Governor Romney proposed. Because the value of itemized deductions and other tax expenditures is proportional to tax rates, the amount of tax expenditure savings possible with a top tax rate of 25 percent would be less than is possible with a top tax rate of 28 percent.
More from the Authors

Areas of Expertise