Economic Downturn and Legacy of Bush Policies Continue to Drive Large Deficits
Economic Recovery Measures, Financial Rescues Have Only Temporary Impact
Federal deficits and debt have been sharply higher under President Obama, but the evidence continues to show that the Great Recession, President Bush’s tax cuts, and the wars in Afghanistan and Iraq explain most of the deficits that have occurred on Obama’s watch — based on the latest Congressional Budget Office projections as well as legislation enacted since we last issued this analysis of what lies behind current deficits and debt.
Though some lawmakers and pundits continue to blame record deficits on the President’s policies in general — and his actions to boost the economy and stabilize the financial system in particular — these policies increase budget deficits only briefly; they will have no significant impact on the long-term problem of large deficits and rising debt.
Although longer-term pressures on spending stem chiefly from an aging population and rising health-care costs, those pressures are not new. Policymakers knew about them when they enacted the Bush-era tax cuts and assented to fighting two wars on borrowed money. (These pressures also were taken into account in the Congressional Budget Office projections issued at the start of 2001, which showed budget surpluses for the next several decades.)
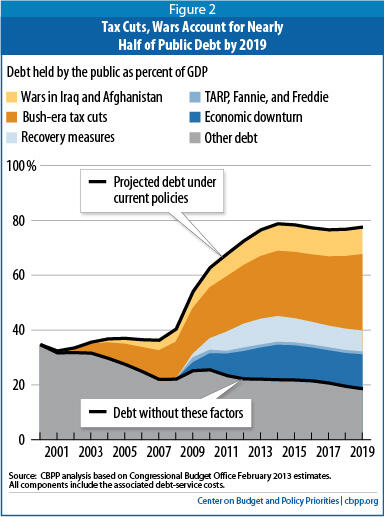
The goal of reining in long-term deficits and debt would be much easier to achieve if it were not for the policies set in motion during the Bush years. That era’s tax cuts — most of which policymakers extended in this year’s American Taxpayer Relief Act, with President Obama’s support — and the wars in Iraq and Afghanistan will account for almost half of the debt that we will owe, under current policies, by 2019.[1] By contrast, the economic recovery measures and financial rescues will account for just over 10 percent of the debt at that time.
Image
 Recession Caused Sharp Deterioration in Budget Outlook
A steep economic decline became apparent in the summer and fall of 2008, as the Bush Presidency neared its end. The housing sector plunged, financial markets verged on meltdown, job losses mounted, and the National Bureau of Economic Research confirmed what everybody already recognized — that the nation was in recession (which the Bureau concluded began in December 2007). Two weeks before President Obama’s first Inauguration, the Congressional Budget Office (CBO) projected a 2009 deficit of well over $1 trillion.[2]
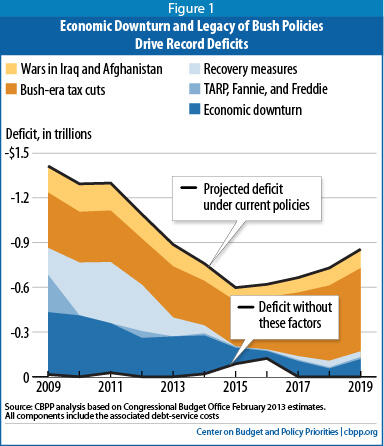
The recession battered the budget, driving down tax revenues and swelling outlays for unemployment insurance, food stamps, and other safety net programs.[3] We calculate that changes in the economic outlook since the summer of 2008 account for over $400 billion of the deficit in both 2009 and 2010 and smaller amounts in later years. We estimate that the downturn has pushed up deficits by $2.5 trillion (including the associated interest costs) over the 2009-2018 period (see Figure 1).[4]
Financial Rescues, Stimulus Added to Deficits in Near Term
The government put Fannie Mae and Freddie Mac — two giant government-sponsored enterprises (GSEs) engaged in mortgage finance — into conservatorship in September 2008.[5] In October 2008, the Bush Administration and Congress enacted a rescue package to stabilize the financial system by creating the Troubled Asset Relief Program (TARP). Together, TARP and the GSEs accounted for almost $250 billion of fiscal year 2009’s record deficit (including the related debt-service costs). Their contribution to deficits then fades rapidly, however.
In February 2009, the new Obama Administration and Congress enacted the American Recovery and Reinvestment Act (ARRA) to arrest the economy’s plunge. By design, ARRA added to the deficit. Since then, policymakers have enacted several other measures — including tax cuts for businesses, temporary aid to states, a partial payroll-tax holiday for workers, and further extensions of unemployment benefits — to spur recovery and aid the unemployed. By our reckoning, the combination of ARRA and these other measures accounts for $1.7 trillion (including $0.3 trillion in associated debt-service costs) of the $10 trillion in deficits over the 2009-2019 period. Their effects were highly concentrated in 2009 through 2012, and boosted the economy during its most vulnerable period.[6]
Tax Cuts, War Costs Do Lasting Harm to Budget Outlook
Some commentators blame major legislation adopted since 2008 — the stimulus bill and other recovery measures and the financial rescues — for today’s record deficits. Yet those costs pale next to other policies enacted since 2001 that have swollen the deficit and that have lasting effects.
Just two policies dating from the Bush Administration — tax cuts and the wars in Iraq and Afghanistan — accounted for over $500 billion of the deficit in 2009 and will account for nearly $6 trillion in deficits in 2009 through 2019 (including associated debt-service costs of $1.4 trillion). By 2019, we estimate that these two policies will account for almost half — over $8 trillion — of the $17 trillion in debt that will be owed under current policies.[7] (See Figure 2.) These impacts easily dwarf the stimulus and financial rescues, which will account for less than $2 trillion (just over 10 percent) of the debt at that time. Furthermore, unlike those temporary costs, these inherited policies do not fade away as the economy recovers.[8]
Without the economic downturn and the fiscal policies of the previous Administration, the budget would be roughly in balance in this decade. Even if we regard the economic downturn as unavoidable, we would have entered it with a much smaller debt — allowing us to absorb the recession’s damage to the budget and the cost of economic recovery measures, while keeping debt comfortably below 50 percent of GDP, as Figure 2 suggests. That would have put the nation on a much sounder footing to address the demographic challenges and the cost pressures in health care that darken the long-run fiscal outlook.
Technical Note
Baseline projections depict the likely path of the federal budget under specific assumptions about current policies. We base our estimates on CBO’s latest ten-year projections of the budget outlook, published in February 2013, with several adjustments to reflect what will happen if current tax and spending policies — which sometimes diverge from current laws — continue.
Specifically, our baseline includes the budgetary effects of continuing temporary tax cuts — the so-called “normal tax extenders,” such as the research and development tax credit, as well as several expansions in refundable tax credits slated to expire after 2017. Our baseline also assumes the effects of continuing to defer scheduled cuts in payments for Medicare providers (including a 25 percent cut scheduled for 2014), as has routinely occurred in recent years, and freezing reimbursements at today’s rates instead. We also account for a gradual phase-down of operations in Iraq and Afghanistan and a decline in emergency disaster-relief funding from 2013’s unusually high levels. Finally, we assume that the automatic spending reductions (or “sequestration”) scheduled to take place starting in March 2013 will be cancelled. We do, however, assume compliance with the discretionary spending caps enacted in the Budget Control Act of 2011 as amended. In all cases we based our adjustments on estimates published by CBO.[9]
| Table 1 Selected Components of Deficits Under Current Policies, Through 2019 (By fiscal year, in billions of dollars) | |||||||||||||
| 2009 | 2010 | 2011 | 2012 | 2013 | 2014 | 2015 | 2016 | 2017 | 2018 | 2019 | 2001-08 | 2009-19 | |
| Deficit under current policies | 1,413 | 1,293 | 1,300 | 1,089 | 887 | 759 | 598 | 619 | 664 | 731 | 856 | 2,006 | 10,209 |
| Selected components: | |||||||||||||
| Economic downturn | 418 | 449 | 332 | 374 | 279 | 258 | 107 | 49 | 106 | 173 | n.a. | 0 | 2,544a |
| TARP, Fannie, and Freddie | 249 | -66 | -30 | 46 | -27 | 14 | 9 | 7 | 9 | 9 | 14 | 0 | 235 |
| ARRAb | 182 | 328 | 171 | 58 | 51 | 44 | 19 | 5 | 13 | 22 | 33 | 0 | 925 |
| Other recovery measures | 0 | 93 | 269 | 254 | 103 | 9 | -20 | -1 | 11 | 21 | 5 | 0 | 744 |
| Bush-era tax cuts | 371 | 340 | 346 | 309 | 343 | 299 | 305 | 350 | 427 | 505 | 558 | 1,955 | 4,154 |
| War costs | 178 | 188 | 184 | 164 | 147 | 116 | 91 | 87 | 100 | 118 | 127 | 673 | 1,499 |
| Source: CBPP calculations based on data from CBO. All estimates include the associated debt-service costs. “n.a.” denotes “not available.” a Through 2018, the final year of CBO’s September 2008 budget projections. (Not available for 2019. For Figures 1 and 2, we simply assume that this category would amount to another $200 billion in 2019, a rough extrapolation of the previous few years’ patterns.) b Excluding cost of a one-year AMT “patch,” which was included in ARRA. Note: CBO=Congressional Budget Office; TARP=Troubled Asset Relief Program; Fannie and Freddie=Fannie Mae and Freddie Mac; ARRA=American Recovery and Reinvestment Act of 2009; AMT=Alternative Minimum Tax. | |||||||||||||
We have previously explained in detail how we calculated certain major contributors to deficits for the rest of this decade; interested readers are referred to that October 2012 report.[10] This update takes into account another round of economic and technical revisions by CBO, which on balance reduced projected deficits slightly.[11] It also incorporates the American Taxpayer Relief Act (ATRA) enacted in January 2013, which permanently continued the bulk of the Bush tax cuts as well as Alternative Minimum Tax relief.[12] ATRA did, however, allow about one-fifth of the Bush tax cuts to lapse — chiefly for married couples earning over $450,000 and unmarried people over $400,000 — which (since our earlier analysis assumed extension of all the tax cuts) somewhat reduces the share of deficits and debt that we ascribe to that cause.[13] ATRA also extended bonus-depreciation rules and unemployment benefits (through 2013), and certain refundable tax credits originally enacted in ARRA (through 2017) — costs that we have added to “other recovery measures.” None of those updates materially alters the conclusions that we draw in this analysis.
Despite the apparent precision of the effects shown here, users should be aware of their limitations, as we have cautioned in previous versions of this paper. This project involves tallying up estimates that were done as much as 12 years apart and employed different economic and technical assumptions. CBO does not generally revisit the effects of legislation once it is enacted, and many of the measures that we have tallied surely ended up costing a different amount — either more or less — than initially “scored.”[14] And, after more than four years in office, President Obama has continued (with modifications) some policies that began in the Bush era, blurring to some degree the assignment of responsibility for those policies’ budgetary effects. In particular, the enactment of ATRA — over President Obama’s signature — has settled the fate of the Bush-era tax cuts for the foreseeable future.
This represents the final update of an analysis that we first produced in 2009 and have updated once or twice annually since.
End Notes
[1] We focus here on debt held by the public, which reflects funds that the federal government borrows in credit markets to finance deficits and other cash needs. That is the proper measure on which to focus because it is what really affects the economy. We compare it to GDP because stabilizing the debt-to-GDP ratio is a key test of fiscal sustainability. See James R. Horney et al., “Fiscal Commission Should Not Focus On Gross Debt,” Center on Budget and Policy Priorities, July 21, 2010, https://www.cbpp.org/cms/index.cfm?fa=view&id=3238.
[2] Congressional Budget Office, The Budget and Economic Outlook: Fiscal Years 2009 to 2019 (January 2009).
[3] At the same time, the recession pushed down inflation and interest rates, which generated some offsetting savings.
[4] These estimates end in 2018, which was the last year of CBO’s September 2008 budget projections. For Figures 1 and 2, we assumed that the increase in deficits that the economic downturn caused will amount to another $200 billion in 2019, a rough extrapolation of the previous few years’ patterns.
[5] That occurred on September 7, 2008 — too late for inclusion in the CBO report issued just two days later.
[6] CBO estimates that ARRA boosted employment and GDP significantly, with peak effects in mid-2010. See Congressional Budget Office, Estimated Impact of the American Recovery and Reinvestment Act on Employment and Economic Output from October 2012 Through December 2012, February 2013.
[7] See Table 1 in the technical note at the end of this paper. These debt estimates simply sum up the policies’ effects on deficits over the two separate periods (2001-2008 and 2009-2019) shown there, and include the associated interest (also known as debt-service) costs.
[8] The new Medicare prescription drug benefit, enacted in 2003, also adds to deficits over this period — by over $700 billion, net of premiums from enrollees and payments from states, in 2009 through 2019 — but for reasons explained in our October 2012 paper, we cannot quantify the net budgetary effect of the Medicare Modernization Act that added the drug benefit.
[9] These adjustments are drawn from Table 1-7, “Budgetary Effects of Selected Policy Alternatives Not Included in CBO’s Baseline,” in Congressional Budget Office, The Economic and Budget Outlook: Fiscal Years 2013 to 2023 (February 2013). For consistency with past versions of this analysis, we assume continuation of the so-called normal tax extenders. As such, this baseline differs from the one used by Richard Kogan et al., “$1.5 Trillion in Deficit Savings Would Stabilize the Debt Over the Coming Decade,” Center on Budget and Policy Priorities, February 11, 2013, https://www.cbpp.org/cms/index.cfm?fa=view&id=3900. Another difference is that the baseline in the Kogan et al paper smooths outlays, deficits, and debt in years that are marked by 11 or 13 (rather than 12) months’ payments in certain programs.
[10] Kathy Ruffing and James Horney, “Downturn and Legacy of Bush Policies Drive Large Current Deficits,” Center on Budget and Policy Priorities, October 10, 2012, https://www.cbpp.org/cms/index.cfm?fa=view&id=3914.
[11] Because CBO now assumes slightly higher interest rates, its new forecast also raises the debt-service costs that we ascribe to various components of the deficit. This is especially noticeable after 2015, and explains — for example — why war costs contribute rising amounts to the deficit even as the wars themselves wind down. (We calculate debt-service effects using actual interest rates through 2012, spliced with CBO’s projected interest rates for 2013 and later.)
[12] Chye-Ching Huang, “Budget Deal Makes Permanent 82 Percent of President Bush’s Tax Cuts,” Center on Budget and Policy Priorities, January 3, 2013, https://www.cbpp.org/cms/index.cfm?fa=view&id=3880.
[13] We also make two technical corrections to what we include in “Bush-era tax cuts,” with roughly offsetting effects. We now exclude the cost of so-called normal tax extenders from that price tag, but we include the portion of permanent AMT relief enacted in ATRA that reflected an interaction with the rate reductions that were at the heart of the Bush tax cuts.
[14] ARRA is an exception to the rule that CBO doesn’t revisit the effects of past legislation. CBO has regularly updated its estimates of ARRA, as amended, largely in response to the transparency and accountability provisions of that Act.
More from the Authors

Areas of Expertise