Romney's Charge That Most Federal Low-Income Spending Goes for "Overhead" and "Bureaucrats" Is False
For Major Low-Income Programs, More Than 90 Percent Goes to Beneficiaries
Presidential candidate Mitt Romney has endorsed a proposal to eliminate major federal assistance programs for low-income Americans and turn them over to the states, often with deep funding cuts. But the rationale he offered for doing so in this past Sunday’s “Meet the Press” debate — that the federal bureaucracy eats up most of the money Congress provides for these programs, and little actually reaches people in need — is simply false. At least nine-tenths of federal spending for each of these programs (and in most cases, a higher percentage) reaches low-income Americans.
Romney said that “all these federal programs that are bundled to help people and make sure we have a safety net need to be brought together and sent back to the states,” and he specifically called for subjecting Medicaid, food stamps, and housing vouchers to this treatment. He has also embraced the budget of House Budget Committee Chairman Paul Ryan (R-WI), which the House passed in April, including provisions that would convert Medicaid and food stamps to block grants and cut their federal funding by $750 billion and $127 billion over ten years, respectively.
On Sunday, Romney said that most federal funding for these programs is absorbed by federal administrative costs, leaving very little for the low-income people whom the programs are supposed to help:
What unfortunately happens is with all the multiplicity of federal programs, you have massive overhead, with government bureaucrats in Washington administering all these programs, very little of the money that’s actually needed by those that really need help, those that can’t care for themselves, actually reaches them.
This statement is false. Budget data for the major low-income assistance programs — Medicaid, food stamps (now known as the Supplemental Nutrition Assistance Program, or SNAP), the Supplemental Security Income program for the elderly and disabled poor, housing vouchers, the school lunch and breakfast programs, and the Earned Income Tax Credit — show that, in every case, federal administrative costs range from less than 1 percent to 8 percent of total federal program spending. Combined federal and state administrative costs range from 1 percent to 10 percent of total federal- and state-funded program spending.
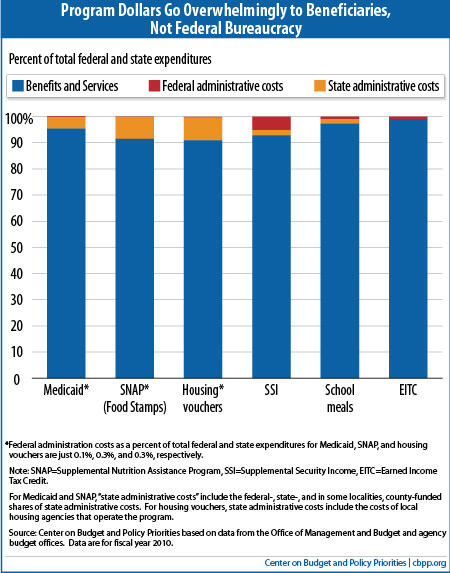
As detailed below, the data show that 91 to 99 percent of total federal spending on these programs reaches beneficiaries in the form of benefits or services, as does 90 to 99 percent of combined federal and state spending for these programs. These figures are for fiscal year 2010, the latest year for which full data are available.
Turning the programs over to the states, as Romney has proposed, likely would not reduce their administrative costs materially, if at all. State and local governments would still incur administrative costs and states would have to assume some administrative costs that the federal government now bears. In addition, splitting certain administrative tasks among the 50 states would likely be less efficient and more costly than having the federal government continue to carry them out. One example is approving and monitoring retail food stores that participate in SNAP to prevent program abuse. The federal government uses a centralized database on SNAP food purchases across the country to identify stores that have suspicious redemption patterns and warrant investigation — something that states would be hard-pressed to replicate individually without spending considerably more money.
The data on the six major low-income programs are as follows:
- Medicaid. Federally funded administrative costs accounted for 3.8 percent of federal Medicaid spending in fiscal year 2010; the other 96.2 percent went for health care and long-term care for beneficiaries. Moreover, most of the 3.8 percent went for the federally financed portion of state administrative costs.[1] The federal government’s own administrative costs accounted for only 0.2 percent of federal Medicaid spending. For federal- and state-funded Medicaid spending combined, 4.6 percent went for administrative costs and 95.4 percent went for care for beneficiaries.
- SNAP (formerly known as food stamps). Federal administrative costs accounted for one-quarter of 1 percent of federal SNAP spending in 2010. Adding the federally financed portion of state administrative costs brings total administrative costs to 4 percent of federal SNAP spending. Another 1 percent of federal costs went for the federal share of costs of nutrition education and employment and training services for SNAP participants. Some 94.6 percent of federal spending went directly for food that the program’s low-income beneficiaries purchased.
These percentages change only modestly with regard to total SNAP costs — i.e., federal- and state-funded costs combined. Eight percent of total federal- and state-funded costs went for administration, less than 2 percent went for services for beneficiaries, and about 90 percent went for food that beneficiaries purchased.[2] - Housing vouchers. Some 0.3 percent of program dollars went for federal administrative costs, 8.7 percent went for the administrative costs of the 2,400 state and local public housing agencies (PHAs) that operate the program, and 90.9 percent went for rental assistance for low-income tenants.
- Supplemental Security Income (SSI). Some 92.8 percent of spending went for benefit payments to beneficiaries, with administrative costs accounting for the remaining 7.2 percent. That figure includes the federal government’s own administrative costs (5.2 percent) as well as the costs of the states’ Disability Determination Services (2.0 percent), which are reimbursed by the federal government.
- School lunch and breakfast programs. Some 0.9 percent of federal spending went for federal administrative costs, while 1.6 percent went for federal support for state administrative costs. The rest, 97.5 percent, went to schools to subsidize their costs in operating the school meals programs.
- Earned Income Tax Credit. Over 99 percent of EITC dollars went directly to households receiving the EITC, with the IRS estimating that its administrative costs amounted to less than 1 percent of EITC costs.
Technical Note
CBPP's analysis of administrative costs in major benefit programs relies to the maximum extent possible on published information. There is no single published source that includes all of the relevant data. In some cases, some or all of the federal cost of administering a benefit program is not included in that program's spending as conventionally shown, but appears elsewhere in the federal budget as part of the federal administering agency's overall salary and expense appropriation. We took pains to include such costs. (If anything, our method may have erred in the direction of overstating such costs.)
We focused on costs for fiscal year 2010, because that is the latest year for which full data are available (except for the Earned Income Tax Credit, for which the latest data available are for 2009). The analysis was conducted by a team of CBPP experts, the majority of whom are former CBO analysts or former OMB budget examiners.
Medicaid. The Medicaid program is operated by the Centers for Medicare and Medicaid Services (CMS). We used CMS-64 spending data (available at http://www.cms.gov/MedicaidBudgetExpendSystem/Downloads/NetExpenditure02through10.zip ) for fiscal year 2010. These data from the federal Medicaid Budget and Expenditure System show total mandatory Medicaid spending on a national and state-by-state basis, as well as the federal and state share of such costs. They also indicate how much federal and state spending was for benefits and services and how much for state administration.
The CMS-64 data do not show how much the federal government spent on its own Medicaid administrative costs, though as noted, they do show the federal share of state administrative costs. For federal administrative costs (which are mostly provided as discretionary funding via the appropriations process), we analyzed CMS's 2012 budget submission ( http://www.hhs.gov/about/FY2012budget/cmsfy12cj_revised.pdf) to estimate the portion of fiscal year 2010 CMS appropriations (as well as some mandatory funding) that was attributable to federal Medicaid administration, as opposed to the administration of Medicare and other programs that CMS operates.
To calculate the percentage of federal Medicaid spending that goes to benefits and services, we divided the federal share of 2010 Medicaid spending on benefits and services from the CMS-64 data by total federal Medicaid spending from the CMS-64 data, adding in CMS appropriations and other funding for federal Medicaid administration. Total federal spending — including the CMS overhead — was $270 billion, of which $260 billion (96.2 percent) was for benefits and services, $9.8 billion (3.6 percent) for federally-funded state administration, and an estimated $0.5 billion (0.2 percent) for CMS administration.
To calculate the share of total federal and state 2010 Medicaid spending combined that went to benefits and services, we divided total federal and state spending on benefits and services from the CMS-64 data by total federal and state Medicaid spending from the CMS-64 data, after adding in CMS appropriations and other funding for federal Medicaid administration from the 2012 CMS budget information. States' spending was $132 billion, of which $124 billion was for benefits and $8 billion for administration. Total federal and state spending was nearly $402 billion, of which more than $383 billion (95.4 percent) was for benefits and services and $18.4 billion (4.6 percent) for administration.
Supplemental Nutrition Assistance Program (SNAP). We analyzed SNAP benefits and the administrative costs associated with those benefits, as well as the costs of employment and training and nutrition education services for SNAP recipients, which we list as a separate expenditure category in the text of our paper. (In the graph in the paper, for simplicity's sake, we include them in the "benefits and services" category.) We did not include expenditures for the block grant for nutrition assistance in Puerto Rico and some other U.S. territories, which is a separate program from SNAP, or federal support for food banks and some small grant programs, which also are separate programs. (These items are separate line items in the same budget account as SNAP and account for about 4 percent of that budget account. Including them would have made the federal and state administrative costs a smaller share of the total.) We added a portion of the spending from a separate budget account, Nutrition Programs Administration, to capture the costs of federal policy and program staff in running SNAP.
Specifically, we calculated that federal SNAP costs in 2010 totaled $68.4 billion, of which $64.7 billion (94.6 percent) went for benefits, $0.6 billion (0.9 percent) for services including employment and training and nutrition education, $2.9 billion (4.2 percent) for the federal share of state administration, and less than $0.2 billion (0.3 percent) for federal administration.
In addition, states spent an estimated $3.6 billion, including $3 billion for administration and $0.6 billion for their share of employment and training and nutrition education services. Thus, of combined federal and state spending, about 90 percent went for benefits, less than 2 percent for services, and 8 percent for administration.
Sources of data are: 2012 United States Department of Agriculture (USDA) Budget Explanatory Notes for the Food and Nutrition Service ( http://www.obpa.usda.gov/30fns2012notes.pdf, pp. 30-45 and 30-90); the SNAP State Activity Report (SAR) (http://www.fns.usda.gov/snap/qc/pdfs/2010_state_activity.pdf); and the Office of Management and Budget (budget appendix, http://www.whitehouse.gov/sites/default/files/omb/budget/fy2012/assets/agr.pdf , plus some unpublished detail; the impact of the unpublished detail which was provided by USDA career staff via OMB, is very small and does not affect the results). Our analysis is consistent with the 2011 data published in the Congressional Budget Office's "fact sheet" at http://www.cbo.gov/budget/factsheets/2011/6-suppnutrition.pdf, though the CBO table provides considerably less detail and does not include all federal administrative spending.
Housing vouchers. Figures for housing assistance payments and state and local agency costs are obligations for 2010 shown under Tenant-Based Rental Assistance in the budget appendix for the Department of Housing and Urban Development ( http://www.whitehouse.gov/sites/default/files/omb/budget/fy2012/assets/hud.pdf ). The table found there shows the local agency costs for "administrative fees" and "family self sufficiency coordinators," which we include as administrative costs. All other obligations in the table are for assistance payments on behalf of tenants.
Federal administrative costs come from a separate account, Public and Indian Housing (PIH), also in the HUD budget appendix. We pro-rated those costs by multiplying that account's total personnel compensation by the ratio of voucher program full-time-equivalent employees (FTEs) to total PIH FTEs. FTE information is available at http://portal.hud.gov/hudportal/documents/huddoc?id=SalariesExp_2012.pdf (p.A-3) and http://portal.hud.gov/hudportal/documents/huddoc?id=Tenant_BR_Assis_2012.pdf (p. H-7).
We find that housing vouchers cost $18.1 billion in 2010, of which $16.5 billion (90.9 percent) went to housing assistance, $1.6 billion (8.7 percent) to state and local administrative costs, and an estimated $57 million (0.3 percent) for federal administrative costs.
Supplemental Security Income (SSI). The Annual Report of the Supplemental Security Income Program ( http://www.ssa.gov/OACT/ssir/SSI11/ssi2011.pdf) shows the portion of program dollars that went to benefits and administration (Tables IV.C2 and IV.E1, respectively). In 2010, benefits were $47.2 billion, and administrative costs were $3.7 billion. We counted payments to employment networks and vocational rehabilitation providers as administrative costs. Almost all of the administrative costs are discretionary and are part of the Social Security Administration's overall appropriation for administrative costs. A portion of these administrative costs went to states to cover costs of their Disability Determination Services (DDSs), which weigh eligibility for both SSI and Social Security Disability Insurance (DI). According to the agency's budget documents ( http://www.socialsecurity.gov/budget/2012LAE.pdf), total obligations for payments to the DDSs were $2.2 billion in 2010 (Table 3.9). Based on the relative volumes of DI and SSI applications, we judged that SSI accounted for about 45 percent of that total. In sum, we calculated that the SSI program spent 92.8 percent of its outlays for benefits and 7.2 percent for administrative costs, including the estimated 2.0 percent that financed the state DDSs.
School lunch and breakfast programs. We analyzed spending on the National School Lunch Program and the School Breakfast Program using data provided to the Congressional appropriations committees to accompany the President's Budget. Actual spending data for fiscal year 2010 appears in the2012 USDA Budget Explanatory Notes for Committee on Appropriations for Food and Nutrition Service (available at http://www.obpa.usda.gov/30fns2012notes.pdf ).
Data on the amount of funding provided to schools for their costs in operating the programs are found on lines 1(a) and (b) of the table on page 30-13. We also included approximately $15 million in grants to schools to upgrade their kitchen equipment to provide healthier meals. Together, these costs account for 97.5 percent of federal spending on the school lunch and breakfast programs.
The federal government also provides funds to state agencies for their administrative costs in operating both the school meals programs and other child nutrition programs, including the child care meals program, the summer meals program, and a fruit and vegetable snack program. These funds are shown in the budget as federal funding for state administrative expenses (SAE), but they are not broken down between the school meals programs and the other child nutrition programs. We counted the full amount of SAE grants to states as administrative costs for the school meals programs even though a portion of those funds are used to administer the other child nutrition programs. As a result, we have slightly overstated administrative costs. The amount of SAE funding provided in fiscal year 2010 is found on line 2 of the table on page 30-13. We also included roughly $9 million provided to states through two grant programs aimed at improving program administration. Together these funds for state administrative costs accounted for 1.6 percent of federal spending on the school lunch and breakfast programs in 2010.
The federal government retains a small amount of funds to oversee the school meals programs. Federal administrative funding includes a portion of funding provided to USDA's Food and Nutrition Service to administer all the federal nutrition programs. Approximately $36 million of these funds were used to oversee the child nutrition programs, including the school lunch and breakfast programs (see page 30-89). Again, including this full amount slightly overstates administrative spending on the school meals programs. We also included federal administrative funding devoted to improving program integrity, nutrition education, and food safety.
In addition to cash reimbursements for each lunch and breakfast served that meets federal nutrition requirements, the federal government provides more than $1 billion worth of commodities to schools for lunches. We did not include the value of these commodities when calculating the total federal funding provided to schools to operate the school meals programs. We did include an estimate of the costs associated with commodity procurement in our analysis of federal administrative costs.
In total, we estimate that the school meals programs cost nearly $13.2 billion in 2010, of which $12.8 billion (97.5 percent) went to schools, $0.2 billion (1.6 percent) represented states' administrative costs, and slightly over $0.1 billion (0.9 percent) represented federal administrative costs. [3]
Earned Income Tax Credit. The Internal Revenue Service (IRS) calculates the EITC "administrative cost ratio" as the program's administrative costs divided by the sum of benefits paid and overpayments deterred. Administrative costs include those related to compliance, outreach, processing, and customer service. For fiscal year 2009, the IRS calculates that administrative costs were $169 million, while EITC benefits were $49.5 billion and "revenue protected" was $3.2 billion. The resulting ratio is a fraction of 1 percent. Administrative costs also account for less than 1 percent of program costs if the "revenue protected" is removed from the calculation. These numbers were provided to CBPP in IRS correspondence dated January 10, 2012.
End Notes
[1] A temporary increase in the federal share of Medicaid health care costs (but not of state administrative costs) was in effect in FY 2010. Adjusting to remove the effect of this temporary increase would raise the share of federal Medicaid expenditures going for administrative costs in FY 2010 to 4.5 percent.
[2] These figures reflect temporary increases in SNAP benefits and in federal support for state administrative costs that were in effect in FY 2010. Without those temporary measures, 88 percent of combined federal and state SNAP expenditures would have gone for benefits, 2 percent for nutrition education and employment services, and 10 percent for federal and state administrative costs in FY 2010.
The SNAP figures are also affected by the increase in SNAP caseloads that has occurred because of the economic downturn; prior to the recession, about 85 percent of combined federal and state SNAP expenditures went for benefits, 2 to 3 percent went for nutrition education and employment services, and 12 to 13 percent went for state administrative costs (including both the federal- and state-funded portions of such costs). The federal government’s own costs in administrating the program accounted for less than one-half of 1 percent of total SNAP expenditures.
[3] As noted above, 97.5 percent of federal spending for the school meals programs went to schools to operate these school meals programs. Our report had a figure of 97.4 percent. Since the report was published we discovered a tiny technical glitch; the correct figure is 97.5 percent, and the report has been modified accordingly.