Top 1 Percent of Americans Reaped Two-Thirds of Income Gains in Last Economic Expansion
Income Concentration in 2007 Was at Highest Level Since 1928, New Analysis Shows
The Piketty-Saez data has been updated. An analysis of the new data as of March 7, 2012 can be found here: https://www.cbpp.org/cms/index.cfm?fa=view&id=3697.
Two-thirds of the nation’s total income gains from 2002 to 2007 flowed to the top 1 percent of U.S. households, and that top 1 percent held a larger share of income in 2007 than at any time since 1928, according to an analysis of newly released IRS data by economists Thomas Piketty and Emmanuel Saez.[1]
During those years, the Piketty-Saez data also show, the inflation-adjusted income of the top 1 percent of households grew more than ten times faster than the income of the bottom 90 percent of households.
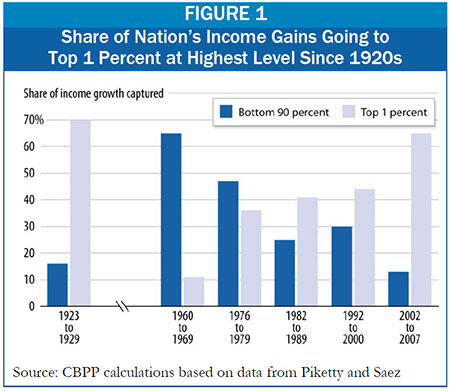
The last economic expansion began in November 2001 and ended in December 2007, according to the National Bureau of Economic Research, which means the Piketty-Saez data essentially cover that expansion. The last time such a large share of the income gain during an expansion went to the top 1 percent of households — and such a small share went to the bottom 90 percent of households — was in the 1920s (see Figure 1). [2]
Piketty and Saez’s unique data series on income inequality, based on IRS files, is particularly valuable because it provides detailed information on income gains at the top of the income scale and extends back to 1913.
The new data show:
- 2007 marked the fifth straight year in which income gains at the top outpaced those among the rest of the population. From 2002 to 2007, the average inflation-adjusted income of the top 1 percent of households rose 62 percent, compared to 4 percent for the bottom 90 percent of households (see Table 1).
| Table 1: | |||
| Dollar Increase | Percent Increase | Average Annual Increase | |
| Bottom 90 Percent | $1,206 | 3.9% | 0.8% |
| Next 9 Percent | $19,476 | 13.0% | 2.5% |
| Top 1 Percent | $521,127 | 61.8% | 10.1% |
| Top 0.1 Percent | $3,455,384 | 94.1% | 14.2% |
| Note : In 2007, the bottom 90 percent of households were those with incomes below about $110,000. The next 9 percent were those with incomes between $110,000 and about $400,000, and the top 0.1 percent were those with incomes above about $2,000,000. Calculations are in current 2007 dollars. | |||
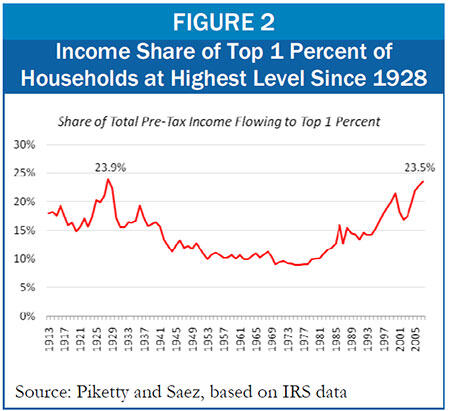
- The share of the nation’s income flowing to the top 1 percent of households increased sharply, from 16.9 percent in 2002 to 23.5 percent in 2007 — a larger share than at any point since 1928 (see Figure 2). In 2000, at the peak of the 1990s boom, the top 1 percent received 21.5 percent of total income.[3]
- Income gains have been even more pronounced among those at the very top of the income scale. The incomes of the top one-tenth of 1 percent (0.1 percent) of U.S. households have grown more rapidly than the incomes of the top 1 percent of households as a whole, rising by 94 percent — or $3.5 million per household — since 2002. The share of the nation’s income flowing to the top one-tenth of 1 percent of households increased from 7.3 percent of the total income in the nation in 2002 to 12.3 percent in 2007. This is the highest level in the Piketty-Saez data going back to 1913, surpassing even the previous peak in 1928.
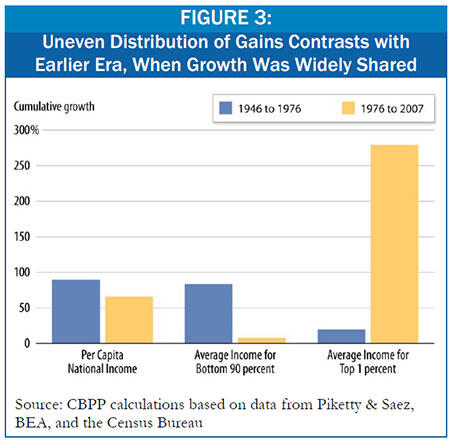
The uneven distribution of economic gains in recent years continues a longer-term trend that began in the late 1970s. In the three decades following World War II (1946-1976), robust economic gains were shared widely, with the incomes of the bottom 90 percent actually increasing more rapidly in percentage terms, on average, than the incomes of the top 1 percent. But in the three decades since 1976, the incomes of the bottom 90 percent of households have risen only slightly, on average, while the incomes of the top 1 percent have soared. [4] (See Figure 3.)
With the latest IRS data, we now have a complete picture of income concentration during the recent economic expansion, which ended in December 2007, although we do not yet have data on the recession’s effects on income concentration. Based on National Account statistics and other indicators, Professor Saez predicts that income concentration will likely fall in 2008 and 2009 as it did following the dot.com collapse at the start of this decade. Whether the highest income households will once more capture a highly disproportionate share of income gains as the economy begins to recover is uncertain, but Saez, along with Harvard economist Lawrence Katz, points to previous recessions and notes that only major policy shifts like the New Deal have prevented income concentration from “bouncing back” after a decline. In the absence of significant policy changes, income concentration levels could well return to their previous highs after the current recession ends and resume their 30-year climb. [5]
End Notes
[1] Piketty and Saez rely on detailed Internal Revenue Service micro-files for available years, extending the full series to 1913 using aggregate data and statistical techniques. Their August 2009 revision incorporates the detailed micro-files for 2007 that just became available. For details on their methods, see Thomas Piketty and Emmanuel Saez, “Income Inequality in the United States: 1913-1998,” Quarterly Journal of Economics, February 2003, or, for a less technical summary, see http://elsa.berkeley.edu/~saez/saez-UStopincomes-2007.pdf. Their most recent estimates are available at http://elsa.berkeley.edu/~saez/TabFig2007.xls.
[2] According to the National Bureau of Economic Research, the last economic expansion began in November 2001 and ended in December 2007. However, the real income of the top 1 percent of households did not reach a trough until 2002 and that of the bottom 90 percent until 2003. For the purposes of this paper we measure income growth between 2002 and 2007. If we had chosen 2001 as the base year, the share of income gains accruing to the top 1 percent would have been 76 percent and that of the bottom 90 percent would have been 2 percent. If we had chosen 2003, those respective shares would have been 59 percent and 20 percent.
[3] Piketty and Saez present three different data series, each of which uses a different income concept and therefore yields somewhat different estimates of the share of income going to each group. (For example, estimates of the share of income going to the top 1 percent in 2007 range from 18.29 percent in one series to 23.50 percent in the series we rely on here to 20.33 percent in the third series.) We follow the income concept in Saez’s most recent report and focus on the series that includes capital gains income both in ranking households and in measuring the income that households receive. This definition of income corresponds most closely to adjusted gross income (AGI), although it has the disadvantage of fluctuating with the stock market.
Piketty and Saez also present a data series that includes capital gains income but ranks households without capital gains, as well as a series that excludes capital gains altogether. All three data series yield similar results. For example, in 2007, under both income concepts that include capital gains income, the share of income flowing to the top 1 percent was at its highest level since 1928. Under the income concept that excludes capital gains, the income share going to the top 1 percent was at the highest level since 1929.
[4] Different data series show modestly larger or smaller gains for the bottom 90 percent, but all series show a similar discrepancy between the bottom 90 percent and the top 1 percent.
[5] Saez details his prediction for trends in income concentration in the public summary of his work (supra note 1). Katz is quoted in David Leonhardt and Geraldine Fabrikant, “Rise of the Super-Rich Hits a Sobering Wall,” New York Times, Aug. 20, 2009.
More from the Authors