
Employed But Not Insured:
A State-by-State Analysis of the Number of Low-Income
Working Parents Who Lack Health Insurance
by Jocelyn
Guyer and Cindy Mann
Table of Contents Press
Release Click here to view PDF version of this report. |
I. Overview
States now offer health care coverage to uninsured children in low-income working families through Medicaid and, in some states, through newly established child health programs. The parents who head these families, however, remain at high risk of being uninsured. More than 5.4 million low-income working parents were uninsured in 1997 according to the U.S. Census Bureau data analyzed in this report.(1)
- Nationwide, more than one out of three working parents (34.5 percent) with income below 200 percent of the poverty level ($27,300 a year for a family of three in 1998) were uninsured.
- The uninsured rate among working parents with income below 100 percent of the federal poverty level ($13,650 a year for a family of three) is even higher. Nationwide, close to half (46 percent) of all poor working parents are uninsured.
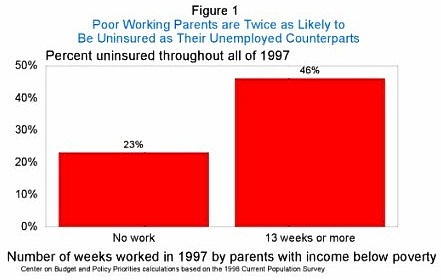
- Working poor parents are twice as likely to be uninsured as their unemployed counterparts. In 1997, some 23 percent of poor parents who had no earnings throughout the year were uninsured compared to 46 percent of poor parents who worked for 13 weeks or more during the year.
 Unless action is taken, the number of uninsured working parents is likely to
grow. More and more low-income parents are joining the workforce at the same time that
employer-based coverage for low-wage workers is declining. Although states generally
provide Medicaid to parents who are receiving welfare, including parents combining welfare
and work, few states cover low-income working parents who have no current or recent
attachment to the welfare system. As a result, most parents who are supporting their
families through part-time or full-time work are ineligible for Medicaid even if they work
at jobs that pay very low wages and that do not offer health care coverage.(2)
Unless action is taken, the number of uninsured working parents is likely to
grow. More and more low-income parents are joining the workforce at the same time that
employer-based coverage for low-wage workers is declining. Although states generally
provide Medicaid to parents who are receiving welfare, including parents combining welfare
and work, few states cover low-income working parents who have no current or recent
attachment to the welfare system. As a result, most parents who are supporting their
families through part-time or full-time work are ineligible for Medicaid even if they work
at jobs that pay very low wages and that do not offer health care coverage.(2)
- Some 43 states do not cover working parents who earn enough to bring them just to the poverty level ($13,650 a year for a family of three).
- In half the states, working parents are ineligible for Medicaid if their earnings exceed 59 percent of the poverty level ($7,992 a year for a family of three).
- In nine states (shown in Figure 2), working parents are ineligible for Medicaid if their earnings reach 37 percent of the poverty level — $5,051 a year for a family of three. In these states, parents who earn $7 an hour are ineligible for health care coverage through Medicaid if they work more than eight to 13 hours a week.
- For example, in Texas parents
Figure 2
States with Particularly Limited Medicaid
Coverage for Low-Income Working ParentsIn these states, how many hours
a week can a parent who is seeking
Medicaid work and still be eligible?At a job that
pays $7 an hourAt a job that
pays $5.15 an hourAlabama 8 hours 11 hours Arkansas 8 hours 11 hours Louisiana 9 hours 12 hours West Virginia 11 hours 15 hours Texas 12 hours 16 hours Indiana 12 hours 17 hours Virginia 13 hours 17 hours Florida 13 hours 18 hours Idaho 13 hours 18 hours Note: Based on the earnings threshold for parents in three-person families that do not receive welfare. who earn $7 an hour are ineligible for coverage if they work more than 12 hours a week. Parents in Texas who earn the federal minimum wage of $5.15 an hour are ineligible if they work more than 19 hours a week.
- Only seven states — Delaware, Hawaii, Massachusetts, Minnesota, Oregon, Rhode Island and Vermont — and the District of Columbia have Medicaid earnings thresholds that are at least equal to the poverty level ($13,650 a year for a family of three).(3) The District of Columbia, Minnesota, Rhode Island, and Vermont cover parents with income at or above 150 percent of the poverty level.
- In addition, some 21 states fail to cover parents in two-parent families to the same extent that they cover parents in single-parent families. In these states, working parents in two-parent families will be ineligible for Medicaid at even lower incomes levels than those that apply to parents in single-parent families.
While the Medicaid earnings thresholds for working parents vary widely among the states, this is not a report about "good" versus "bad" states. For example, all of the states listed in Figure 2 have recently expanded coverage for low-income children — some quite substantially — and many are looking for ways to also cover their parents. Few states provide Medicaid more broadly to low-income working parents because, until recently, federal Medicaid law generally limited coverage to parents who were receiving welfare or who recently had left welfare.(4)
Parents Already Enrolled in Medicaid May Be Able to Retain Medicaid Coverage at Somewhat Higher Income Levels The earnings thresholds noted here apply to low-income working parents in three-person families who are applying for Medicaid. As discussed later in this report, parents may be able to retain Medicaid at somewhat higher income levels if they are enrolled in Medicaid under these more restrictive thresholds and then increase their earnings. For example, parents who have been on welfare and Medicaid and then increase their earnings to a level that would make them ineligible for Medicaid if they were first applying for coverage can retain Medicaid coverage for a limited period of time under "Transitional Medical Assistance" rules. |
This restriction no longer operates under federal law. As a result of a provision in the 1996 federal welfare law that delinked Medicaid eligibility from eligibility for welfare, states have a new option to expand coverage more broadly to low-income working parents. Because the option to expand is through Medicaid, the federal government will provide states with federal Medicaid matching payments that will finance anywhere from 50 percent to 77 percent of the cost of such an expansion (with the exact portion depending on each state's federal Medicaid matching rate). Rhode Island and the District of Columbia already have used this option to expand coverage to more low-income working parents along with their children, and Missouri and Wisconsin recently adopted parent coverage expansions through federal Medicaid waivers. Every state can now take advantage of the new federal option — and federal Medicaid matching payments — to provide this critical support to low-income working families.
II. Data on Uninsured Parents
In 1997, according to Census Bureau data, there were 15.8 million working parents whose family income was below 200 percent of the poverty level — $27,300 a year for a family of three. More than a third of these parents — 5.4 million parents — were uninsured throughout all of 1997.
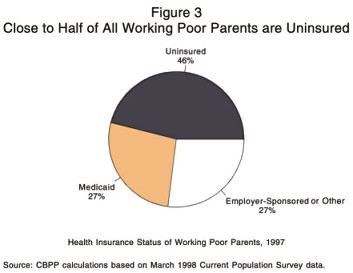
Among the 4.9 million working parents with income below 100 percent of the poverty level in 1997, about a quarter were covered through Medicaid and another quarter were insured through employer-sponsored or "other" coverage (including other sources of private coverage and the military's health insurance program). The single largest group of working poor parents — 46 percent — were uninsured throughout all of 1997.
 Tables 1 and 2 provide state-specific estimates of the number and percentage
of working parents who were uninsured in each state during the mid-1990s. Table 1 shows estimates of the uninsured rate among working parents
with income below 200 percent of the poverty level, while Table 2 shows such estimates for
working parents with income below 100 percent of the poverty level. Because the
state-level Census data are based on small samples, particularly for the less populated
states, these data generally should not be used to compare uninsured rates across states.
The data do, however, give a sense of the magnitude of the problem in each state.(5)
Tables 1 and 2 provide state-specific estimates of the number and percentage
of working parents who were uninsured in each state during the mid-1990s. Table 1 shows estimates of the uninsured rate among working parents
with income below 200 percent of the poverty level, while Table 2 shows such estimates for
working parents with income below 100 percent of the poverty level. Because the
state-level Census data are based on small samples, particularly for the less populated
states, these data generally should not be used to compare uninsured rates across states.
The data do, however, give a sense of the magnitude of the problem in each state.(5)
Low-income working parents are at high risk of being uninsured because, as described in more detail below, they have limited access to publicly-funded coverage and, at the same time, they often are not offered coverage through their employers. In 1996, only 43 percent of workers making $7 or less per hour were offered health insurance coverage by their employers.(6) In contrast, among workers making more than $15 an hour, 93 percent were offered coverage. Moreover, not all low-wage workers who are offered coverage can afford to purchase that coverage, particularly as more of the cost of coverage has been shifted on to employees in recent years. Between 1988 and 1996, the cost to employees of purchasing coverage for themselves increased at an average annual rate of 18.3 percent and the cost of purchasing family coverage over this same period grew at an average annual rate of 11.9 percent.(7)
| Working Parents in
Families with Income Below 200 Percent of Poverty Lacking Health Insurance, Mid-1990s |
|||||
| Number of working parents below 200% of poverty | Number without health insurance | Percent without health insurance | 90 Percent Confidence Interval* | ||
| Low | High | ||||
| United States | 16,060,000 | 5,410,000 | 33.7% | 32.3% | 35.1% |
| Alabama | 274,000 | 78,000 | 28.6% | 18.4% | 38.8% |
| Alaska | 34,000 | 12,000 | 34.5% | 22.6% | 46.3% |
| Arizona | 412,000 | 187,000 | 45.5% | 36.6% | 54.4% |
| Arkansas | 248,000 | 86,000 | 34.7% | 26.2% | 43.3% |
| California | 2,226,000 | 901,000 | 40.5% | 36.1% | 44.8% |
| Colorado | 181,000 | 56,000 | 31.1% | 18.8% | 43.4% |
| Connecticut | 120,000 | 27,000 | 22.1% | 8.2% | 36.0% |
| Delaware | 35,000 | 12,000 | 33.0% | 19.2% | 46.7% |
| District of Columbia | 20,000 | 5,000 | 27.4% | 12.9% | 41.9% |
| Florida | 859,000 | 328,000 | 38.1% | 32.1% | 44.2% |
| Georgia | 494,000 | 216,000 | 43.7% | 33.9% | 53.5% |
| Hawaii | 73,000 | 6,000 | 8.0% | 1.1% | 14.9% |
| Idaho | 101,000 | 37,000 | 37.0% | 27.9% | 46.1% |
| Illinois | 609,000 | 142,000 | 23.4% | 17.1% | 29.6% |
| Indiana | 293,000 | 70,000 | 24.0% | 13.4% | 34.6% |
| Iowa | 190,000 | 44,000 | 23.1% | 13.6% | 32.6% |
| Kansas | 167,000 | 42,000 | 25.4% | 15.4% | 35.5% |
| Kentucky | 267,000 | 105,000 | 39.4% | 28.7% | 50.1% |
| Louisiana | 321,000 | 115,000 | 35.9% | 26.3% | 45.6% |
| Maine | 73,000 | 26,000 | 35.9% | 23.4% | 48.4% |
| Maryland | 207,000 | 64,000 | 30.8% | 16.9% | 44.6% |
| Massachusetts | 222,000 | 58,000 | 26.1% | 16.1% | 36.1% |
| Michigan | 432,000 | 111,000 | 25.7% | 18.2% | 33.1% |
| Minnesota | 234,000 | 51,000 | 21.6% | 11.2% | 32.0% |
| Mississippi | 255,000 | 78,000 | 30.8% | 22.2% | 39.3% |
| Missouri | 308,000 | 96,000 | 31.3% | 19.8% | 42.7% |
| Montana | 78,000 | 19,000 | 24.2% | 16.4% | 32.1% |
| Nebraska | 102,000 | 20,000 | 19.5% | 10.0% | 29.1% |
| Nevada | 88,000 | 30,000 | 33.9% | 21.6% | 46.2% |
| New Hampshire | 49,000 | 14,000 | 29.0% | 14.2% | 43.7% |
| New Jersey | 303,000 | 109,000 | 36.0% | 26.8% | 45.3% |
| New Mexico | 162,000 | 78,000 | 48.1% | 39.0% | 57.2% |
| New York | 960,000 | 333,000 | 34.7% | 29.3% | 40.0% |
| North Carolina | 415,000 | 137,000 | 33.1% | 24.8% | 41.4% |
| North Dakota | 39,000 | 8,000 | 21.1% | 11.4% | 30.7% |
| Ohio | 569,000 | 130,000 | 22.9% | 16.3% | 29.5% |
| Oklahoma | 268,000 | 85,000 | 31.7% | 22.8% | 40.6% |
| Oregon | 194,000 | 47,000 | 24.1% | 13.6% | 34.7% |
| Pennsylvania | 549,000 | 128,000 | 23.4% | 16.8% | 29.9% |
| Rhode Island | 33,000 | 8,000 | 23.1% | 9.1% | 37.2% |
| South Carolina | 254,000 | 87,000 | 34.2% | 22.9% | 45.5% |
| South Dakota | 43,000 | 8,000 | 18.8% | 9.7% | 27.9% |
| Tennessee | 415,000 | 106,000 | 25.5% | 16.3% | 34.8% |
| Texas | 1,639,000 | 798,000 | 48.7% | 43.6% | 53.7% |
| Utah | 163,000 | 33,000 | 20.1% | 12.4% | 27.7% |
| Vermont | 39,000 | 9,000 | 23.0% | 13.3% | 32.8% |
| Virginia | 356,000 | 99,000 | 27.7% | 17.1% | 38.3% |
| Washington | 262,000 | 65,000 | 24.8% | 13.0% | 36.7% |
| West Virginia | 135,000 | 44,000 | 32.6% | 23.4% | 41.9% |
| Wisconsin | 247,000 | 41,000 | 16.7% | 7.0% | 26.4% |
| Wyoming | 41,000 | 14,000 | 33.7% | 24.3% | 43.1% |
| *There is a 90 percent chance that the actual uninsured rate among working parents below 200 percent of the poverty level, if it were determined from a survey of all households, would fall in the range defined by the low-end and high-end estimates of the 90 percent confidence interval. The confidence interval is higher in states with smaller sample sizes. | |||||
| Source: CBPP tabulations of Census Bureau's March Current Population Survey data from 1996-98. Data are for 1995 - 1997. Based on parents living with children between the ages of 18 and 65 in families with income below 200 percent of poverty and in which the parents worked a combined total of more than 13 weeks a year. Due to rounding error, the uninsured rate presented in column 4 may not equal the quotient of columns 2 and 3. | |||||
| Number of working poor parents | Number without health insurance | Percent without health insurance | 90 Percent Confidence Interval | ||
| Low | High* | ||||
| United States | 4,818,000 | 2,222,000 | 46.1% | 43.5% | 48.8% |
| Alabama | 81,000 | 32,000 | 39.5% | 18.9% | 60.2% |
| Alaska | 8,000 | 3,000 | 36.1% | 12.2% | 60.0% |
| Arizona | 148,000 | 93,000 | 62.6% | 48.2% | 77.1% |
| Arkansas | 64,000 | 39,000 | 61.1% | 43.9% | 78.2% |
| California | 794,000 | 379,000 | 47.8% | 40.4% | 55.2% |
| Colorado | 37,000 | 16,000 | 42.4% | 12.7% | 72.0% |
| Connecticut | 35,000 | 13,000 | 36.4% | 4.0% | 68.7% |
| Delaware** | 7,000 | 3,000 | 45.1% | 12.6% | 77.6% |
| District of Columbia** | 6,000 | 2,000 | 38.6% | 10.3% | 66.9% |
| Florida | 266,000 | 140,000 | 52.6% | 41.4% | 63.8% |
| Georgia | 134,000 | 72,000 | 54.0% | 35.1% | 72.9% |
| Hawaii | 19,000 | 3,000 | 15.6% | 0.0% | 34.1% |
| Idaho | 35,000 | 19,000 | 53.0% | 37.1% | 68.9% |
| Illinois | 178,000 | 57,000 | 31.8% | 19.2% | 44.4% |
| Indiana | 73,000 | 35,000 | 48.2% | 22.7% | 73.6% |
| Iowa | 56,000 | 18,000 | 32.0% | 12.9% | 51.2% |
| Kansas | 40,000 | 16,000 | 41.0% | 19.3% | 62.7% |
| Kentucky | 101,000 | 54,000 | 53.9% | 36.3% | 71.4% |
| Louisiana | 95,000 | 52,000 | 54.4% | 36.4% | 72.3% |
| Maine | 18,000 | 11,000 | 59.9% | 34.2% | 85.7% |
| Maryland | 51,000 | 20,000 | 38.6% | 9.3% | 68.0% |
| Massachusetts | 59,000 | 18,000 | 30.6% | 10.2% | 50.9% |
| Michigan | 124,000 | 42,000 | 33.7% | 18.6% | 48.8% |
| Minnesota | 47,000 | 14,000 | 30.0% | 3.7% | 56.4% |
| Mississippi | 87,000 | 36,000 | 41.7% | 25.6% | 57.7% |
| Missouri | 83,000 | 32,000 | 38.4% | 14.8% | 62.1% |
| Montana | 25,000 | 9,000 | 35.4% | 20.2% | 50.6% |
| Nebraska | 22,000 | 5,000 | 20.6% | 0.0% | 41.7% |
| Nevada | 25,000 | 14,000 | 55.7% | 29.3% | 82.2% |
| New Hampshire** | 10,000 | 5,000 | 47.6% | 9.3% | 86.0% |
| New Jersey | 63,000 | 30,000 | 48.4% | 26.6% | 70.2% |
| New Mexico | 63,000 | 38,000 | 60.7% | 46.2% | 75.1% |
| New York | 300,000 | 118,000 | 39.4% | 29.5% | 49.3% |
| North Carolina | 120,000 | 59,000 | 49.3% | 32.8% | 65.7% |
| North Dakota | 13,000 | 4,000 | 28.2% | 9.4% | 47.0% |
| Ohio | 159,000 | 55,000 | 34.7% | 20.7% | 48.6% |
| Oklahoma | 88,000 | 40,000 | 45.3% | 28.8% | 61.7% |
| Oregon | 58,000 | 20,000 | 34.3% | 13.3% | 55.3% |
| Pennsylvania | 136,000 | 53,000 | 38.9% | 23.7% | 54.1% |
| Rhode Island** | 9,000 | 5,000 | 54.2% | 23.8% | 84.6% |
| South Carolina | 69,000 | 28,000 | 41.2% | 18.4% | 63.9% |
| South Dakota | 13,000 | 4,000 | 28.4% | 8.5% | 48.3% |
| Tennessee | 110,000 | 36,000 | 32.8% | 13.9% | 51.8% |
| Texas | 573,000 | 362,000 | 63.1% | 54.9% | 71.3% |
| Utah | 31,000 | 13,000 | 41.7% | 20.8% | 62.6% |
| Vermont | 10,000 | 3,000 | 32.1% | 10.8% | 53.5% |
| Virginia | 95,000 | 36,000 | 38.2% | 15.6% | 60.8% |
| Washington | 68,000 | 24,000 | 35.2% | 10.9% | 59.4% |
| West Virginia | 37,000 | 22,000 | 58.8% | 40.1% | 77.6% |
| Wisconsin | 62,000 | 15,000 | 24.1% | 2.0% | 46.1% |
| Wyoming | 11,000 | 5,000 | 48.6% | 29.4% | 67.8% |
*There is a 90 percent chance that the actual uninsured rate among working parents below 100 percent of the poverty level, if it were determined from a survey of all households, would fall in the range defined by the low-end and high-end estimates of the 90 percent confidence interval. The confidence interval is higher in states with smaller sample sizes. |
|||||
| **Figures are based on a sample size that falls below the minimum recommended by the Census Bureau for reliable estimates. | |||||
| Source: CBPP tabulations of Census Bureau's March Current Population Survey data from 1996-98. Data are for 1995 - 1997. Based on parents between the ages of 18 and 65 living with children in families with income below 100 percent of poverty and in which the parents worked a combined total of more than 13 weeks a year. Due to rounding error, the uninsured rate presented in column 4 may not equal the quotient of columns 2 and 3. | |||||
End Notes:
1. The national estimates of the number and percentage of uninsured working parents in this report are based on calculations done by the Center on Budget and Policy Priorities using data from the U.S. Census Bureau's March 1998 Current Population Survey. In this report, "low-income" is defined as having income below 200 percent of the federal poverty level ($27,300 a year for a family of three). The term "working parent" includes household heads and their spouses between the ages of 18 and 65 who lived with children and who worked a combined total of more than 13 weeks during the year. The data show that poor parents who work more than 13 weeks during the year work an average of 28.4 hours during each work week.
2. In general, this report considers the basic Medicaid income eligibility rules that apply to low-income families with children in each state. Pregnant women, disabled parents, and parents who are themselves under the age of 19 may be eligible for Medicaid at higher income levels than the levels presented in this report. A small number of states also cover parents through "medically needy" eligibility categories at somewhat higher income levels, although in practice states with medically needs categories generally use them primarily to cover people with high medical bills. Appendix B provides additional details on the Medicaid eligibility categories for families with children and describes the methodology for identifing the state-specific earnings thresholds for working parents included in this report.
3. Maine also extends Medicaid to single parents with earnings up to 100 percent of the poverty level, but it only covers parents in two-parent families if one of the parents is incapacitated or the principal wage earner works fewer than 100 hours a month. As noted later in this report, Missouri and Wisconsin have adopted but not yet implemented Medicaid expansions for parents.
4. The one exception is that states have had the option to provide coverage to families with children with income somewhat above welfare income eligibility thresholds without regard to whether they were eligible for welfare under what is known as the "medically needy" eligibility category. In most states, however, this category is used primarily to offer partial coverage to families that have high medical bills relative to their incomes and that "spend down" to the medically needy income eligibility levels. States also have had the opportunity to vary from federal law by seeking a waiver from the federal government. Delaware, Hawaii, Massachusetts, Minnesota, Oregon and Vermont have expanded coverage for parents through waivers.
5. State estimates of the number and percentage of uninsured working parents are based on calculations done by the Center on Budget and Policy Priorities using U.S. Census Bureau data from the March 1998, March 1997 and March 1996 Current Population Surveys. In developing the estimates in Tables 1 and 2, the Center used a standard strategy employed by researchers and others of pooling CPS data for a three-year period to increase the accuracy of state-specific estimates of uninsured rates. A three-year average of CPS data is used in the new child health insurance program (CHIP) to allocate the federal child health block grant funds among states.
6. Philip F. Cooper and Barbara Steinberg Schone, More Offers, Fewer Takers for Employment-Based Health Insurance: 1987 and 1996, Health Affairs, 16(6) (1997), pp. 142-149. The percentage of workers with wages at or below $7 per hour who have "access" to employer-based coverage is somewhat higher (55 percent in 1996) because some low-wage workers are offered coverage through the employer of a family member.
7. Ellen O'Brien and Judith Feder, How Well Does the Employment-Based Health Insurance System Work for Low-Income Families?, Kaiser Commission on Medicaid and the Uninsured, September 1998.

Publication Library | Center Staff | Search this site
Job Opportunities | Internship Information | Top Level
 International Project | State Fiscal Analysis Initiative
To join the Center's e-mail notification list, ask questions,
or send comments, write [email protected]
Center on Budget and Policy Priorities
820 First Street, NE, Suite 510
Washington, DC 20002
Ph: (202) 408-1080
Fax: (202) 408-1056