fuera de serie
Perspectivas sobre las políticas
más allá de los números
más allá de los números
Este contenido no está disponible en Español.
What’s the Picture on Inequality in Your State?
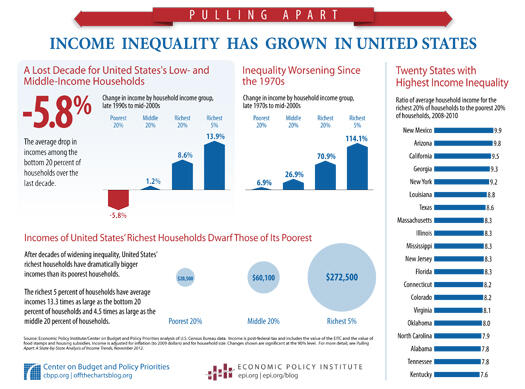
Our new state-by-state report on income inequality includes an infographic like the one below for each state, showing its national ranking and how different income groups in the state have fared over time. Click here for the infographics.
Imagen

Reciba las últimas noticias y los reportes del Centro