Entering Their Second Decade, Affordable Care Act Coverage Expansions Have Helped Millions, Provide the Basis for Further Progress

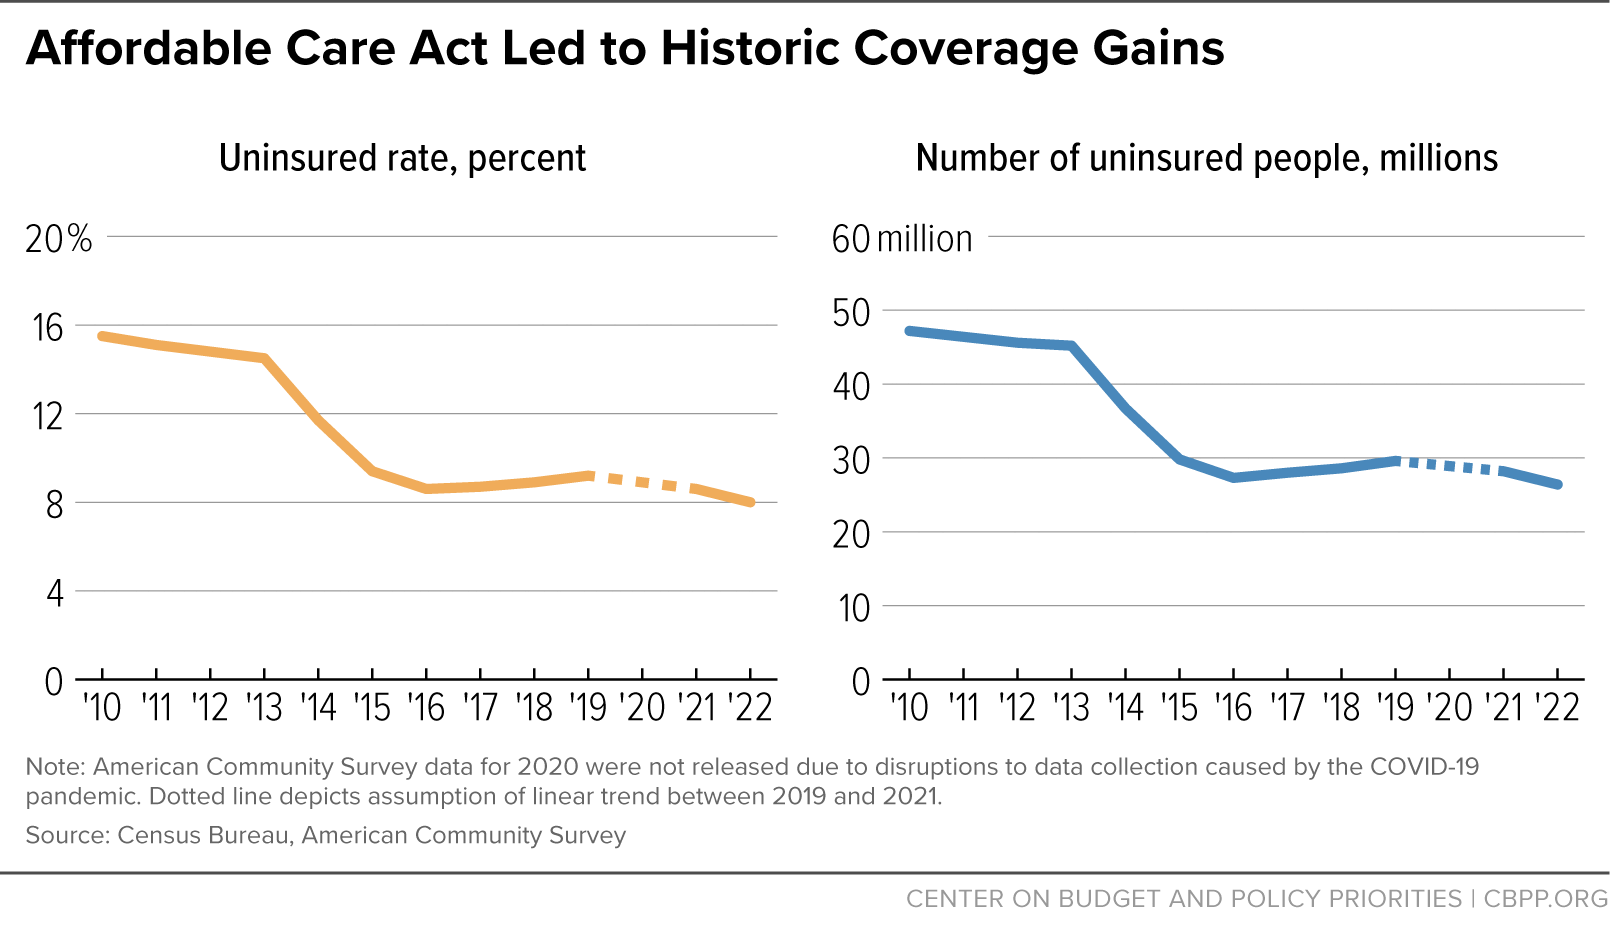
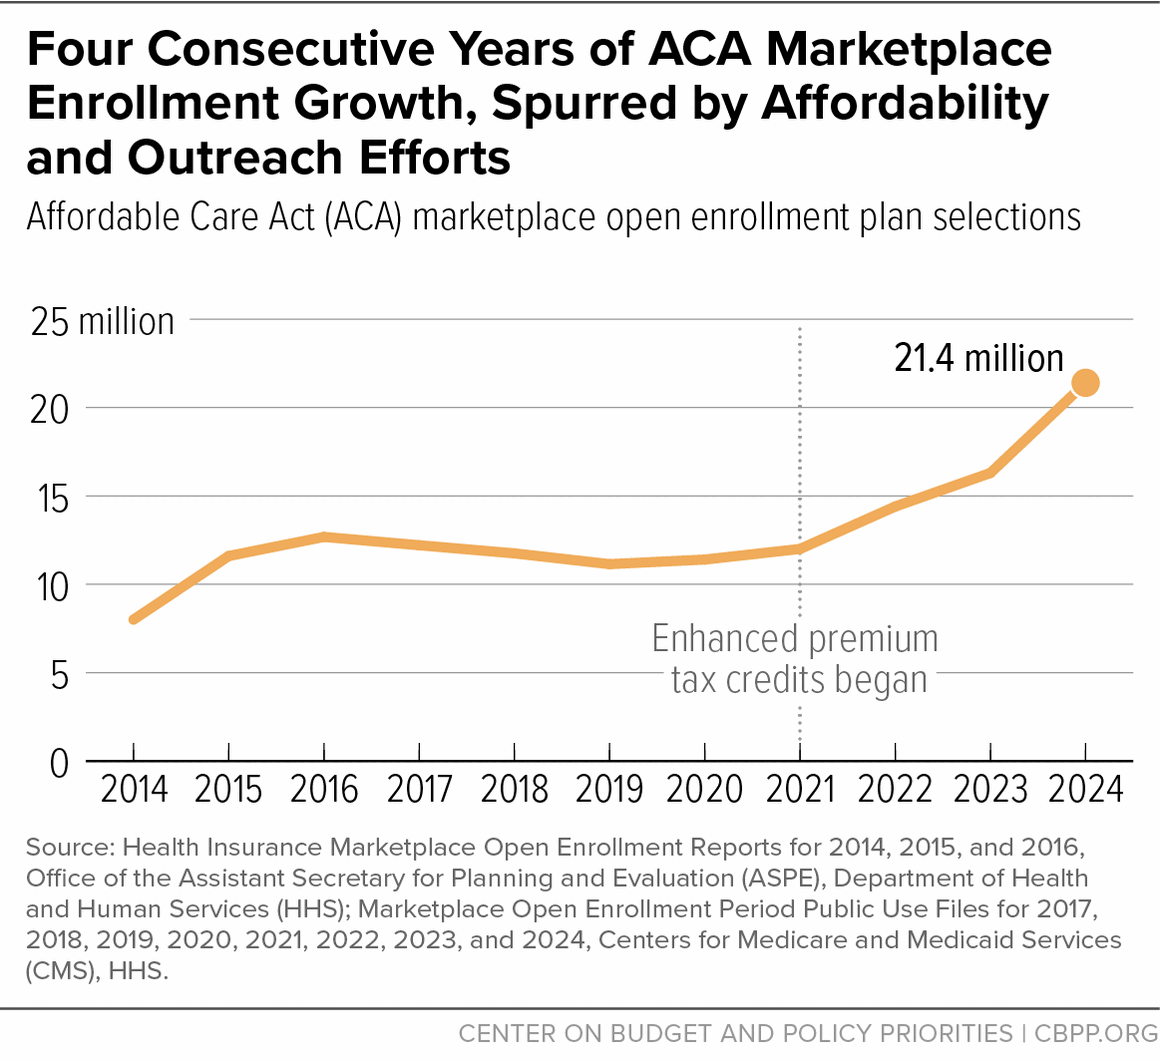
The Affordable Care Act (ACA) expanded eligibility for affordable health coverage in two main ways: by creating health insurance marketplaces with federal financial assistance that reduces premiums and deductibles and by allowing states to expand Medicaid to adults with household incomes up to 138 percent of the federal poverty level (FPL). Both of these coverage expansions took effect in 2014.[1] As of the end of open enrollment, 21.4 million people have selected an ACA marketplace plan for 2024, and 40 states and the District of Columbia have expanded Medicaid. The number of people who are uninsured has dropped from 45.2 million in 2013 to 26.4 million in 2022, a historic decline.[2] In addition to reducing the number of people without any coverage, the ACA marketplace plans and Medicaid provide far lower-cost coverage to millions more people.

Looking ahead, federal and state policymakers should maintain and build on these gains, both by continuing to provide expanded financial assistance that lowers the cost of coverage through the ACA marketplaces and by closing the Medicaid coverage gap to ensure people with low incomes have a pathway to affordable coverage in every state.

More People Have Affordable Health Coverage Because of the ACA

Today, roughly 40 million people are enrolled in coverage under the ACA marketplaces and Medicaid expansion.[3] The ACA’s coverage expansions drove a precipitous decline in the uninsured rate, which fell and eliminating prior barriers in the private insurance market for people with pre-existing health conditions, the ACA provided new options for many people who lack access to affordable employer-sponsored health benefits. Self-employed people, people who work in industries less likely to offer insurance (like food service and construction), gig and part-time workers, people who retire before they become eligible for Medicare at age 65, people who work at small businesses, and people with low incomes are now more likely to be covered.

Coverage gains have been particularly significant for people of color, who have historically experienced higher uninsured rates due to systemic racism, discrimination in employment and education, and other factors that diminish income and access to employer-based health insurance. Between 2013 and 2022, uninsured rates for people under age 65 dropped from 23.8 percent to 14.1 percent among American Indian and Alaska Native people, from 29.7 percent to 17.8 percent among Latino people, and from 18.7 percent to 9.9 percent among Black people.[4]

Enhanced Premium Tax Credits Significantly Reduce Premiums for ACA Marketplace Enrollees and Have Contributed to Historic Enrollment Levels

Temporary enhancements to premium tax credits (PTCs), originally enacted in the American Rescue Plan in 2021 and extended through 2025 by the Inflation Reduction Act, have reduced ACA marketplace enrollees’ premiums by an average of $800 per year, making it easier for more people to afford marketplace coverage.[5] For 2024, 21.4 million people selected a marketplace plan, and 4 out of 5 enrollees were able to find a plan for $10 or less per month, though many chose to use their PTCs to select higher-value plans that cost more.[6]

In February 2023, 91 percent of marketplace enrollees were receiving PTCs, and the average monthly premium for marketplace coverage after PTCs was $124 — a 21 percent decline compared to 2021.[7] People with incomes up to 150 percent of the poverty level ($21,870 for an individual under 2023 poverty guidelines) are eligible to pay $0 in premiums for the “benchmark” silver-level plan.[8] The enhancements also ensure that no one pays more than 8.5 percent of their income toward premiums of the silver benchmark plan. As a result, in 2023, an estimated 1.4 million people received PTCs who would not have been eligible without the enhancements.[9] Making marketplace premiums more affordable for enrollees has also allowed people to choose plans that provide greater overall financial protection (which also tend to have higher premiums). Among people who selected a plan on HealthCare.gov, median individual deductibles dropped by almost half, from $750 to $400, between 2021 and 2023.[10]

These improvements — combined with deeper investments in marketing, outreach, enrollment assistance, and simplifications to the enrollment process — have been a major driver of record growth in marketplace enrollment in recent years.[11] Marketplace affordability enhancements have also been especially critical for increasing enrollment among people of color and people with low incomes. Between 2021 and 2023, marketplace enrollment growth among Black and Latino people in states using the HealthCare.gov platform outpaced other racial and ethnic groups and grew by over 80 percent.[12] Between 2021 and 2023, marketplace enrollment among people with incomes between 100 and 150 percent of the poverty level — a group able to enroll in a silver-level plan for a $0 premium — grew by 58 percent (compared to 36 percent enrollment growth overall).[13]

Medicaid Expansion Continues to Lower Uninsured Rates in States That Cover Adults With Low Incomes

The ACA permitted states to expand Medicaid coverage to adults with incomes up to 138 percent of the poverty level (about $20,780 annually for an individual or $35,630 for a family of three in 2024).[14] As of June 2023, about 24.5 million adults were enrolled in the ACA Medicaid expansion group.[15] States that adopted the expansion have dramatically lowered their uninsured rates and reduced state spending on uncompensated care.[16] Extensive research finds that people who gained coverage through the expansion have grown healthier and more financially secure, while long-standing racial inequities in health outcomes, coverage, and access to care have been reduced.[17] To date, 40 states plus the District of Columbia have expanded Medicaid, with Oklahoma and Missouri expanding in 2021 and South Dakota and North Carolina becoming the most recent additions in 2023. Hundreds of thousands of people are projected to gain affordable coverage in these states.[18]

Indeed, the 2022 American Community Survey data show the large and positive impacts of Medicaid expansion on insurance coverage. In particular, Oklahoma and Missouri saw large declines in uninsured rates in 2022 after expanding Medicaid. And administrative data show that Medicaid enrollment in 2022 increased far more in Oklahoma and Missouri than in any other state.[19]

Action Is Needed to Maintain the Momentum of Recent Coverage Gains and Fully Realize the ACA’s Potential

If PTC Enhancements Lapse, Premiums Would Increase for All Marketplace Enrollees

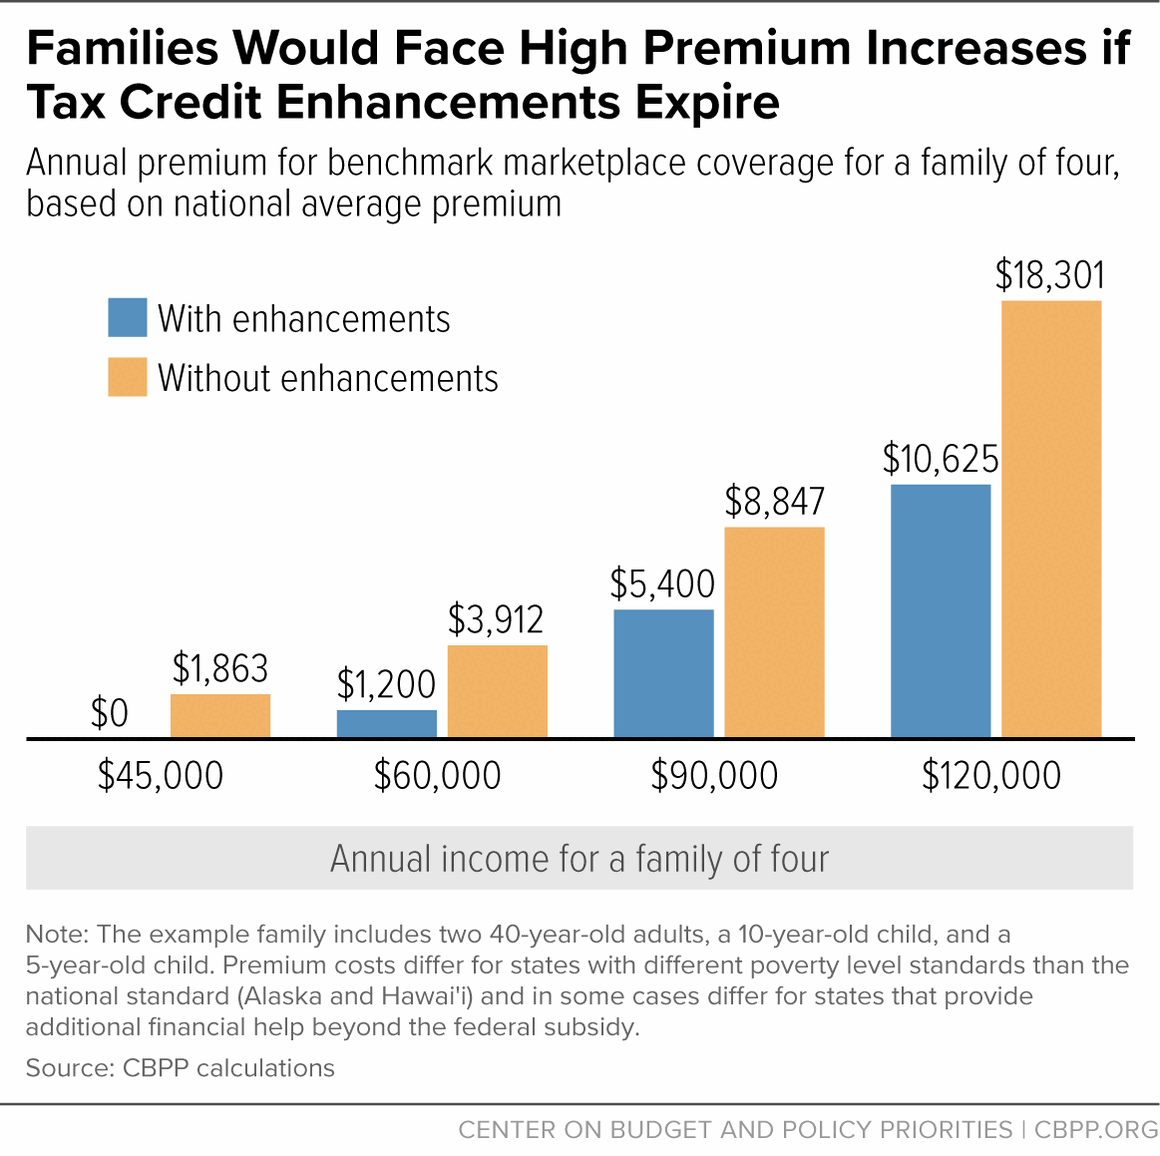
Unless Congress acts, the enhanced PTCs will expire at the end of 2025. Premium costs would increase for marketplace enrollees of all ages and across income levels, with the sticker shock first hitting during the spring and summer of that year, as insurers’ premium rates start becoming public, and intensifying in October and November of 2025 as people begin shopping for 2026 plans. Among people with lower incomes who would see their subsidies reduced, for example:[20]

  • A single individual making $21,000 (144 percent of the poverty level) would no longer be eligible for a zero-premium plan and would see their monthly marketplace premium rise from $0 to $66 — an annual increase of $792.
  • A single individual making $30,000 (205 percent of the poverty level) would see their monthly marketplace premium more than double, from $55 to $168 — an annual increase of $1,350.
  • A 60-year-old couple making $45,000 (228 percent of the poverty level) would see monthly marketplace premiums increase from $117 to $283 — an annual increase of almost $2,000.
  • A family of four making $60,000 (200 percent of the poverty level) would see their monthly marketplace premium increase from $100 to $326 — an annual increase of about $2,700. (See Figure 3 for a family of four at different income levels; Appendix Table 1 for the costs facing people of various family sizes, ages, and incomes; and Appendix Table 2 for the costs facing people of various family sizes, ages, and incomes by state.)

As a result of the enhancements, people with incomes above 400 percent of the federal poverty level became newly eligible for PTCs if their marketplace premiums would exceed 8.5 percent of household income. If the PTC enhancements are not extended, the premium increases for people in this group would be dramatic:

  • A typical 60-year-old couple making $80,000 (405 percent of the poverty level) would see monthly marketplace premiums more than triple, from $567 to $2,026 — an annual increase of roughly $17,500.
  • A typical family of four making $125,000 (416 percent of the poverty level) would see their monthly marketplace premium increase from $885 to $1,525 — an annual increase of about $7,700.

While the majority of marketplace enrollees receive PTCs (more than 90 percent in 2023), even enrollees who do not receive PTCs will likely see increased premiums if the PTC enhancements expire. Fewer people would be expected to enroll in marketplace coverage if the enhancements expire, and because of the effect on the risk pool, insurers would be expected to increase rates. When the PTC enhancements were first due to expire at the end of 2022, an analysis from the Urban Institute estimated that people ineligible for PTCs would pay an average of $712 more in premiums per year if the enhancements expired.[21]

Closing the Medicaid Coverage Gap Would Advance Health Equity by Creating a Pathway to Affordable Coverage for More Than 1.6 Million People

Action is also needed to create a pathway to affordable coverage for the more than 1.6 million people in the ten non-expansion states who fall into a “coverage gap” and are uninsured. People in the coverage gap have incomes that are too low to qualify for financial help with marketplace coverage under current federal rules, but they also don’t qualify for Medicaid in their state because either their income is too high, or they don’t fall into an existing eligibility category.[22] (See Table 1.) In non-expansion states, the median income limit for parents to qualify for Medicaid is just 35 percent of the poverty level — equivalent to $9,037 annually for a family of three in 2024 — and childless adults do not qualify at all.[23] Without action at the state or federal level to close the coverage gap, these people have no way to obtain affordable health coverage.

TABLE 1
Uninsured Adults in the Coverage Gap
StateNumber of Adults
Non-expansion states1,653,000
Alabama107,000
Florida315,000
Georgia192,000
Kansas42,000
Mississippi81,000
South Carolina83,000
Tennessee95,000
Texas726,000
Wyoming11,000

Note: Totals may not sum due to rounding. Estimates include people aged 19-64 in non-institutional settings. Income eligibility for Medicaid and marketplace coverage is determined by grouping individuals into health insurance units and imputing modified adjusted gross income (MAGI) for each program prior to applying state eligibility rules. Immigration status is imputed, and the estimated population without a documented immigration status in the U.S. is not included. Although Wisconsin is a non-expansion state, it does not have a coverage gap because it extends Medicaid eligibility up to the poverty level under a waiver.

Source: CBPP estimates based on the 2022 American Community Survey

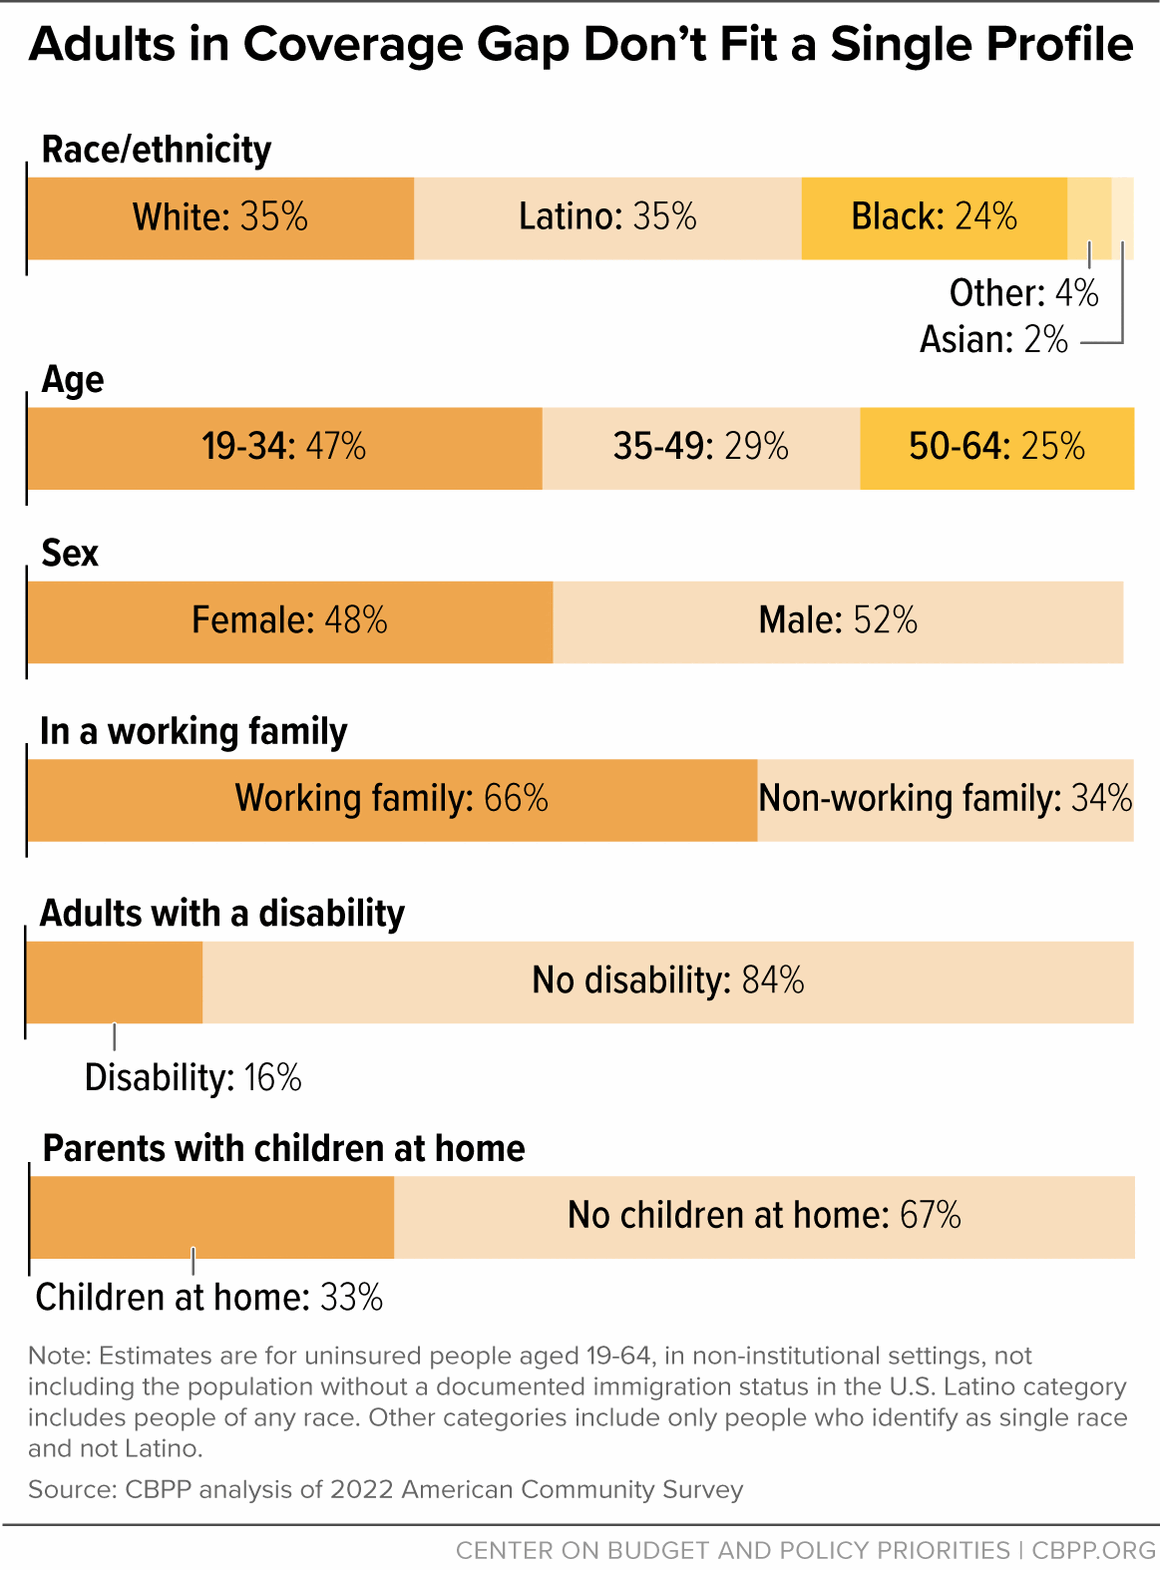
Closing the coverage gap is critical for advancing health equity across racial and ethnic lines; about 65 percent of those in the coverage gap are people of color, most of whom live in the South.[24] (See Figure 4.)

Several states are currently exploring Medicaid expansion. Expanding Medicaid remains a good financial decision for states, with the federal government paying 90 percent of the costs for people who are newly eligible for the expansion. And the Rescue Plan created a large new financial incentive that makes expansion an even better deal for states that haven’t expanded. States that expand Medicaid after March 2021 receive a two-year, five-percentage-point increase in the federal matching rate for their non-expansion enrollees. Even after a state expands Medicaid, non-expansion enrollees account for most of a state’s Medicaid enrollment and costs, so this increase generates substantial additional federal funding for states. The remaining non-expansion states would gain some $13.1 billion combined in federal funding from this provision if they expanded. (See Table 2.)

TABLE 2
Additional Federal Medical Assistance Percentage Funding Under American Rescue Plan Incentive for States That Expand Medicaid
 Additional Federal Funding From Two-Year Rescue Plan Fiscal Incentive
(Millions of Dollars)
Alabama$624
Florida2,941
Georgia*1,254
Kansas384
Mississippi519
South Carolina633
Tennessee1,019
Texas4,834
Wisconsin**865
Wyoming61

* On July 1, 2023, Georgia implemented a Section 1115 waiver that is different than an ACA Medicaid expansion. This waiver only covers adults with incomes up to 100 percent of the poverty level who meet a work-reporting requirement of 80 hours a month. Georgia initially estimated roughly 25,000 people would enroll in the first year, rising to about 53,000 people in year five, but as of December 15, 2023, only 2,344 people have enrolled in the waiver. In contrast, the Urban Institute estimates that adopting the full ACA Medicaid expansion would reduce the number of uninsured by 293,000 people in 2024.

** Estimates assume that childless adults now enrolled in BadgerCare are shifted to the Medicaid expansion group, allowing Wisconsin to access the higher federal match. This shift would reduce the number of people enrolled at the state’s traditional matching rate, thus reducing the Rescue Plan’s fiscal incentive.

Note: Estimates assume expansion occurs on July 1, 2024. Estimates also incorporate projected enrollment declines due to the unwinding of the Medicaid continuous coverage requirement, as described in this report. Estimates include the federal fiscal incentive only.

Source: CBPP estimates using 2022 data from the Medicaid Budget Expenditure System, May 2023 Congressional Budget Office baseline projections, and the Medicaid and CHIP Payment and Access Commission’s Medicaid and CHIP Data Book

Despite clear benefits not only to people who will gain coverage, but also to health care providers and state economies, the last ten years have shown that some states are not likely to adopt the Medicaid expansion. As proposed in President Biden’s 2025 budget, Congress should step in to close the coverage gap for the more than 1.6 million people who do not currently have access to affordable coverage in their states.[25] It is unjust and inequitable that ten years after the ACA went into effect, people who live in states that haven’t adopted the expansion are shut out of coverage. Congress should finish the job started by the ACA and close the coverage gap by creating a federal fallback.

APPENDIX TABLE 1
Premiums Will Increase for Individuals, Couples, and Families if Premium Tax Credit Enhancements Expire
 Annual marketplace premiums
 With enhancements (current)Without enhancementsPremium increase without enhancementsPercentage premium increase
45-year-old individual
$21,000 (144% FPL)$0$792$792N/A
$30,000 (205% FPL)$660$2,010$1,350205%
$45,000 (308% FPL)$2,790$4,424$1,63459%
$60,000 (411% FPL)$5,100$6,467$1,36727%
60-year-old couple
$29,000 (147% FPL)$0$1,147$1,147N/A
$45,000 (228% FPL)$1,404$3,390$1,986141%
$60,000 (304% FPL)$3,660$5,898$2,23861%
$80,000 (405% FPL)$6,800$24,311$17,511258%
Family of four
$45,000 (150% FPL)$0$1,863$1,863N/A
$60,000 (200% FPL)$1,200$3,912$2,712226%
$90,000 (300% FPL)$5,400$8,847$3,44764%
$125,000 (416% FPL)$10,625$18,301$7,67672%

Note: FPL = federal poverty level. The FPL for these calculations is based on 2023 poverty guidelines, which are used to determine premium tax credits for 2024 marketplace coverage. Examples are illustrative and based on 2024 national average benchmark (second-lowest-cost silver plan) premiums with age adjustments. The example family includes two 40-year-old parents, a 10-year-old, and a 5-year-old. Estimates are applicable in all states except for those with different poverty level standards than the national standard and/or those that subsidize marketplace premiums beyond the federal subsidy. See Appendix Table 2 for state-specific estimates.

Source: CBPP calculations

APPENDIX TABLE 2
Annual Premiums Will Increase for Individuals, Couples, and Families if Premium Tax Credit Enhancements Expire
 45-year-old individual; $60,000 (411% FPL)60-year-old couple; $80,000 (405% FPL)Family of four; $125,000 (416% FPL)
StateWith enhance-ments 
(current)
Without enhancementsPremium increase without enhancementsWith 
enhancements (current)
Without enhancementsPremium increase without enhancementsWith enhance-ments (current)Without enhancementsPremium increase without enhancements
U.S. average$5,100$6,467$1,367$6,800$24,311$17,511$10,625$18,301$7,676
Alabama5,1007,6472,5476,80028,74521,94510,62520,2629,637
Alaska6,36212,0545,6928,48245,31036,82813,26034,10820,848
Arizona5,1005,4643646,80020,54013,74010,62515,4624,837
Arkansas5,1005,7496496,80021,61014,81010,62516,2675,642
California5,1006,3451,2456,80023,85317,05310,62517,9557,330
Colorado5,1006,1151,0156,80022,98616,18610,62517,3036,678
Connecticut5,1008,9623,8626,80033,68926,88910,62525,36014,735
Delaware5,1007,2272,1276,80027,16520,36510,62520,4499,824
District of Columbia5,1007,7332,6336,80027,48720,68710,62521,33210,707
Florida5,1006,6301,5306,80024,92318,12310,62518,7618,136
Georgia5,1006,2781,1786,80023,59816,79810,62517,7647,139
Hawai'i5,8596,3454867,80823,85316,04512,19917,9555,756
Idaho5,1005,6545546,80021,25314,45310,62515,9995,374
Illinois5,1006,4131,3136,80024,10717,30710,62518,1477,522
Indiana5,1005,4103106,80020,33613,53610,62515,3084,683
Iowa5,1006,1151,0156,80022,98616,18610,62517,3036,678
Kansas5,1006,5901,4906,80024,77017,97010,62518,6468,021
Kentucky5,1005,8447446,80021,96715,16710,62516,5365,911
Louisiana5,1007,6342,5346,80028,69421,89410,62521,60010,975
Maine5,1006,9831,8836,80026,24819,44810,62519,7599,134
Maryland4,6914,69106,80017,63510,83510,62513,2752,650
Massachusetts5,1005,4543546,80017,07310,27310,62515,4774,852
Michigan5,1005,166666,80019,41812,61810,62514,6183,993
Minnesota4,6514,65106,80017,48210,68210,62513,9653,340
Mississippi5,1006,5761,4766,80024,71917,91910,62517,4246,799
Missouri5,1006,7931,6936,80025,53518,73510,62519,2218,596
Montana5,1006,8341,7346,80025,68718,88710,62519,3378,712
Nebraska5,1007,7282,6286,80029,05122,25110,62521,86911,244
Nevada5,1005,2471476,80019,72412,92410,62514,8484,223
New Hampshire4,5424,54206,80017,07410,27410,62512,8532,228
New Jersey5,1006,2511,1516,80023,49616,69610,62517,6877,062
New Mexico5,1006,3861,2866,80024,00617,20610,62518,0707,445
New York5,1008,8323,7326,80017,66410,86410,62525,17114,546
North Carolina5,1006,7121,6126,80025,22918,42910,62518,9918,366
North Dakota5,1006,5901,4906,80024,77017,97010,62518,6468,021
Ohio5,1005,8987986,80022,17115,37110,62516,6896,064
Oklahoma5,1006,8881,7886,80025,89119,09110,62519,4908,865
Oregon5,1006,6171,5176,80024,87218,07210,62517,5316,906
Pennsylvania5,1006,0349346,80022,68015,88010,62517,0736,448
Rhode Island5,1005,4233236,80020,38713,58710,62515,3464,721
South Carolina5,1006,6711,5716,80025,07618,27610,62518,8768,251
South Dakota5,1008,3523,2526,80031,39624,59610,62523,63413,009
Tennessee5,1006,7931,6936,80025,53518,73510,62519,2218,596
Texas5,1006,4401,3406,80024,20917,40910,62518,2247,599
Utah5,1007,1912,0916,80024,68217,88210,62518,6928,067
Vermont5,10011,4006,3006,80022,80016,00010,62532,03421,409
Virginia5,0305,03006,80018,90912,10910,62514,2343,609
Washington5,1005,6275276,80021,15114,35110,62515,9225,297
West Virginia5,10011,4846,3846,80043,16936,36910,62532,49621,871
Wisconsin5,1006,4541,3546,80024,26017,46010,62518,2627,637
Wyoming5,10011,1326,0326,80041,84435,04410,62531,49920,874

Note: FPL = federal poverty level. The FPL for these calculations is based on 2023 poverty guidelines, which are used to determine premium tax credits for 2024 marketplace coverage. Examples are illustrative and based on 2024 state average benchmark (second-lowest-cost silver plan) premiums with age adjustments. The example family includes two 40-year-old parents, a 10-year-old, and a 5-year-old. Alaska and Hawai’i have state poverty levels that differ from the federal poverty level; estimates for Alaska and Hawai'i assume that the state poverty levels match the federal poverty levels depicted, which means that income levels in the examples differ from those depicted. Depending on the scenario, for a few states, premium payments under the enhancements do not exceed the income cap of 8.5 percent. In those cases, premium payments are equal with or without enhancements. Estimates do not account for any state subsidized marketplace premiums beyond the federal subsidy because such state policies may be dependent on the federal tax credit enhancements.

Source: CBPP calculations

End Notes

[1] Several states and jurisdictions began implementing full or partial Medicaid expansion prior to January 1, 2014: California (July 2011), Connecticut (April 2010), the District of Columbia (July 2010), Minnesota (March 2011), New Jersey (April 2011), and Washington (January 2011).

[2] Census Bureau, 2013 and 2022 American Community Survey.

[3] Centers for Medicare & Medicaid Services (CMS), Medicaid Enrollment Data Collected Through MBES, January 2024, https://www.medicaid.gov/medicaid/national-medicaid-chip-program-information/medicaid-chip-enrollment-data/medicaid-enrollment-data-collected-through-mbes/index.html; CMS, “Historic 21.3 Million People Choose ACA Marketplace Coverage,” January 24, 2024, https://www.cms.gov/newsroom/press-releases/historic-213-million-people-choose-aca-marketplace-coverage.

[4] CBPP analysis of 2013 and 2022 American Community Survey data. The American Indian and Alaska Native (AIAN) category includes people who may be AIAN alone or in combination with other races and ethnicities. The Latino category includes people of any race. The Black and white categories include only people who identify as a single race and not Latino.

[5] CMS, “Biden-Harris Administration Launches Window-Shopping Ahead of 11th ACA Marketplace Open Enrollment Period,” October 25, 2023, https://www.cms.gov/newsroom/press-releases/biden-harris-administration-launches-window-shopping-ahead-11th-aca-marketplace-open-enrollment.

[6] CMS, “Health Insurance Marketplaces 2024 Open Enrollment Report,” March 22, 2024, https://www.cms.gov/data-research/statistics-trends-reports/marketplace-products/2024-marketplace-open-enrollment-period-public-use-files.

[7] CMS, “Effectuated Enrollment: Early 2023 Snapshot and Full Year 2022 Average,” September 2023, https://www.cms.gov/files/document/early-2023-and-full-year-2022-effectuated-enrollment-report.pdf.

[8] The marketplace uses the poverty guidelines, commonly known as the federal poverty level (FPL), in effect at the start of the open enrollment period to determine premium tax credits for the subsequent plan year. All marketplace examples and premium calculations in this report are for the 2024 plan year and therefore use the 2023 FPL. In contrast, Medicaid uses the FPL in effect when a person enrolls. Examples of income levels for Medicaid eligibility therefore use the 2024 FPL.

[9] Before the American Rescue Plan was enacted, people with incomes greater than 400 percent of the FPL were not eligible for PTCs. By setting the upper required contribution percentage at 8.5 percent of income, the Rescue Plan makes some people with incomes greater than 400 percent of the FPL newly eligible for PTCs (if their premiums would exceed 8.5 percent of income). The Department of Health and Human Services (HHS) estimates that in 2023, 1.4 million individuals with incomes greater than 400 percent of the FPL received PTCs because of this provision. CMS, “Biden-Harris Administration Celebrates the Affordable Care Act’s 13th Anniversary and Highlights Record-Breaking Coverage,” March 23, 2023, https://www.cms.gov/newsroom/press-releases/biden-harris-administration-celebrates-affordable-care-acts-13th-anniversary-and-highlights-record.

[10] Deductibles within each plan level did not decrease between 2021 and 2023, but the median individual deductible among plan selections did, suggesting that people selected higher-value plans in 2023. CMS, “2014-2023 OEP Plan Design Public Use File,” September 6, 2023, https://www.cms.gov/data-research/statistics-trends-and-reports/marketplace-products/2023-marketplace-open-enrollment-period-public-use-files.

[11] Medicaid and Children’s Health Insurance Program (CHIP) renewals and terminations resumed in 2023 after being paused since 2020 to keep people covered during the COVID-19 pandemic. As of February 13, 2024, an estimated 16.9 million people have lost Medicaid or CHIP coverage. See: https://www.kff.org/report-section/medicaid-enrollment-and-unwinding-tracker-overview/. Many of these individuals remain eligible for Medicaid or CHIP, but some are now eligible for marketplace coverage. As of December 31, 2023, 2.4 million marketplace plan selections for 2024 were made by people who were previously enrolled in Medicaid or CHIP. See: https://www.cms.gov/newsroom/press-releases/historic-213-million-people-choose-aca-marketplace-coverage.

[12] Anupama Warrier et al., “HealthCare.gov Enrollment by Race and Ethnicity, 2015-2023,” Office of the Assistant Secretary for Planning and Evaluation, HHS, March 22, 2024, https://aspe.hhs.gov/reports/marketplace-enrollment-race-ethnicity-2015-2023.

[13] CMS, “Marketplace Open Enrollment Period Public Use Files,” September 6, 2023, https://www.cms.gov/data-research/statistics-trends-and-reports/marketplace-products/2023-marketplace-open-enrollment-period-public-use-files. Note that because the 2021 Marketplace Public Use File does not include marketplace enrollment data by income for Idaho, Idaho is excluded from this calculation.

[14] The ACA was supposed to provide Medicaid coverage to all adults with low incomes, but in its NFIB v. Sebelius decision of 2012, the U.S. Supreme Court ruled that states would have the option to expand their Medicaid programs rather than face a federal requirement to do so. Because the ACA presumed that all people under 138 percent of the poverty level would be covered by Medicaid and thus made people under the poverty level ineligible for PTCs, the court’s decision led to a “coverage gap” for people with incomes under the poverty level in states that opted not to expand Medicaid. As discussed below, such individuals are ineligible for both Medicaid expansion and marketplace PTCs.

[15] CMS, Medicaid Enrollment Data Collected Through MBES, January 2024, https://www.medicaid.gov/medicaid/national-medicaid-chip-program-information/medicaid-chip-enrollment-data/medicaid-enrollment-data-collected-through-mbes/index.html. These numbers are likely to drop as states continue “unwinding” pandemic-era continuous coverage protections.

[16] Madeline Guth, Rachel Garfield, and Robin Rudowitz, “The Effects of Medicaid Expansion under the ACA: Studies from January 2014 to January 2020,” KFF, March 17, 2020, https://www.kff.org/medicaid/report/the-effects-of-medicaid-expansion-under-the-aca-updated-findings-from-a-literature-review/.

[17]Laura Harker and Breanna Sharer, “Medicaid Expansion: Frequently Asked Questions,” CBPP, forthcoming. See also, Madeline Guth and Maghana Ammula, “Building on the Evidence Base: Studies on the Effects of Medicaid Expansion, February 2020 to March 2021,” KFF, May 6, 2021, https://www.kff.org/medicaid/report/building-on-the-evidence-base-studies-on-the-effects-of-medicaid-expansion-february-2020-to-march-2021/; Madeline Guth, Rachel Garfield, and Robin Rudowitz, op. cit.

[18] Matthew Buettgens and Urmi Ramchandani, “3.7 Million People Would Gain Health Coverage in 2023 if the Remaining 12 States Were to Expand Medicaid Eligibility,” Urban Institute, August 3, 2022, https://www.urban.org/sites/default/files/2022-08/3.7%20Million%20People%20Would%20Gain%20Health%20Coverage%20If%20the%20Remaining%20States%20Were%20to%20Expand%20Medicaid.pdf; Matthew Buettgens, “Medicaid Expansion Would Have a Larger Impact Than Ever during the COVID-19 Pandemic,” Urban Institute, January 2021, https://www.urban.org/sites/default/files/publication/103536/medicaid-expansion-would-have-a-larger-impact-than-ever-during-the-covid-19-pandemic_1.pdf.

[19] Gideon Lukens, “Record Low Uninsured Rate Offers Roadmap to Long-Term Coverage Gains,” CBPP, September 14, 2023, https://www.cbpp.org/blog/record-low-uninsured-rate-offers-roadmap-to-long-term-coverage-gains.

[20] CBPP calculations using 2024 benchmark (second-lowest-cost silver tier plan) premiums with age adjustments. Examples are not projections but rather illustrate the magnitude of the shift in costs that typical individuals and families under these scenarios would experience if the PTC enhancements expire. Actual costs will be determined by future premiums, contribution percentages, and other unknown factors. These national estimates are applicable in all states except for a small number that have state-specific poverty levels and/or provide additional premium subsidies. The family of four includes two 40-year-old parents, a 10-year-old, and a 5-year-old. See Appendix Table 2 for state-specific estimates.

[21] Matthew Buettgens, Jessica Banthin, and Andrew Green, “What If the American Rescue Plan Act Premium Tax Credits Expire? Coverage and Cost Projections for 2023,” Urban Institute, April 7, 2022, https://www.urban.org/research/publication/what-if-american-rescue-plan-act-premium-tax-credits-expire.

[22] CBPP analysis of 2022 American Community Survey. The coverage gap was created when the U.S. Supreme Court ruled in NFIB v. Sebelius that the ACA’s Medicaid expansion was an option for states. While PTCs are available to individuals over 100 percent of the poverty level, the law does not authorize PTCs for people with incomes under 100 percent, making marketplace coverage unaffordable for people with low incomes.

[23] KFF, “State Health Facts: Medicaid Income Eligibility Limits for Adults as a Percent of the Federal Poverty Level,” January 1, 2023, https://www.kff.org/affordable-care-act/state-indicator/medicaid-income-eligibility-limits-for-adults-as-a-percent-of-the-federal-poverty-level/?currentTimeframe=0&selectedRows=%7B%22states%22:%7B%22alabama%22:%7B%7D,%22florida%22:%7B%7D,%22georgia%22:%7B%7D,%22kansas%22:%7B%7D,%22mississippi%22:%7B%7D,%22south-carolina%22:%7B%7D,%22tennessee%22:%7B%7D,%22texas%22:%7B%7D,%22wisconsin%22:%7B%7D,%22wyoming%22:%7B%7D%7D%7D&sortModel=%7B%22colId%22:%22Parents%20(in%20a%20family%20of%20three)%22,%22sort%22:%22desc%22%7D. Medicaid eligibility thresholds as of January 2023; dollar amounts shown here reflect 2024 poverty guidelines determined by HHS.

[24] CBPP analysis of 2022 American Community Survey.

[25] The White House, “President’s Budget,” March 2024, https://www.whitehouse.gov/omb/budget/.