|
August 31, 2006
NINE YEARS OF NEGLECT:
Federal Minimum Wage Remains Unchanged for Ninth Straight Year, Falls to Lowest Level in More than Half a Century
By Jared Bernstein and Isaac Shapiro[1]
The federal minimum wage has remained at $5.15 an hour since September 1, 1997. So as of September 1, 2006, the minimum wage will have remained the same for nine years, while the costs of medical care, gasoline, and other necessities have grown considerably. Further, the minimum wage has fallen exceptionally far below the wages of other workers, including the nation’s CEOs.
-
This lack of Congressional action is approaching an unprecedented stretch. Since the inception of the minimum wage, there has been only one other period in which the minimum wage has remained unchanged for more than nine years. The minimum wage remained the same for the nine-year-and-three-month period from January 1981 until April 1990.
-
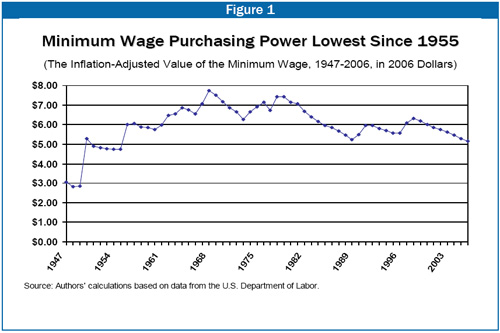
While since September 1997 the minimum wage has remained at $5.15 an hour, the cost-of-living has risen by 26 percent. After adjusting for inflation, the value of the minimum wage is at its lowest level since 1955.
This December 1st will mark nine years and three months since the last increase. Thus, unless Congress acts quickly, so that a federal minimum wage increase is actually put into place before then, on December 2nd the federal minimum wage will have remained at the same level for the longest period since it was established.
Adjustments to the Wage Floor
The federal minimum wage has never included a feature by which it automatically increases each year to ensure that it maintains its purchasing power. As a result, Congress has to act to provide such adjustments.
These adjustments have not always occurred in a timely fashion. Nonetheless, from 1938 to 1981, they did occur with enough regularity that the minimum wage generally either rose in purchasing power or remained relatively stable in real value.
Then from January 1981 to April 1990 the value of the minimum wage was frozen at $3.35 an hour, the longest period without an adjustment in the wage floor. As a result, the minimum wage eroded markedly in value.
Two series of minimum wage increases took effect in the 1990s, the first of which was signed into law by the senior President Bush. These served to restore some of the lost value of the minimum wage. But the last of that series of increases took effect in September 1997, when the federal minimum was raised to its current level of $5.15 an hour.
Minimum Wage has Remained the Same While the Cost of Living Has Risen
One standard for assessing the value of the minimum wage is to track its buying power; that is, to adjust its value to take into account changes in the cost of living. Each year that Congress fails to raise the wage floor and that the cost-of-living rises, the purchasing power of the minimum wage erodes. Thus, the fact that the minimum wage has remained the same for nine years means that its real value has declined considerably over this period.
-
Since September 1, 1997, the overall inflation rate has increased by 26 percent. The costs of certain necessities have risen even more sharply. A gallon of gas costs more than twice as much as it did nine years ago; the cost of medical care increased by 43 percent. (See Table 1.)
|
Table 1: Changes in Cost-of-living and the Minimum Wage Since September 1997 |
|
Overall inflation |
26% |
|
Food |
23% |
|
Housing |
29% |
|
Medical care |
43% |
|
Child care and nursery school |
52% |
|
Educational books and supplies |
61% |
|
Gasoline, unleaded regular |
134% |
|
|
|
|
Minimum wage |
0% |
| Source: Bureau of Labor Statistics |
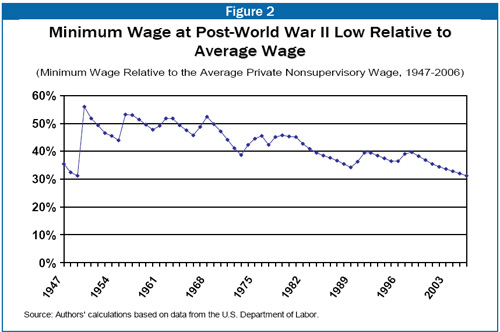
Minimum Wage has Fallen Far Below the Wages of Other Workers
The federal minimum wage has also often been set with the wage level of other workers in mind. This approach reflects the principle that minimum-wage workers should share in economic gains and should not fall too far behind other workers
The minimum wage has also remained stagnant while the pay of chief executive officers has risen sharply. As a result, the gap between the pay of CEOs and the minimum wage has grown dramatically. For example, in 1978, even before the gap began to grow quickly, the average CEO was still paid 78 times as much as a full-time year-round worker earning the minimum wage. By 2005, the average CEO was paid 821 times as much as a minimum wage earner; this is the widest discrepancy on record. As an earlier report from the Economic Policy Institute observed: “An average CEO earns more before lunchtime on the very first day of work in the year than a minimum wage worker earns all year.”[5]
Changes in the Minimum Wage and Changes to the Estate Tax
In reaction to this sharp erosion in the value of the minimum wage, action to raise the minimum wage in Congress has finally begun to stir. In an awkward twist, however, the House adopted legislation that links a dramatic reduction in the estate tax with an increase in the minimum wage. This linkage has been rejected once by the Senate, but the approach may be voted on again by the Senate in September.
The two proposals should not be linked, however. Since 1997 Congress already has been quite generous to the relatively modest number of wealthy estates subject to taxation. High-income households, moreover, seem to be faring reasonably well during this recovery while low-income households are not. Recent Census data reveal, for example, that the average real income of the top five percent of households rose 3.1 percent last year, while that of the bottom fifth of households was up only 0.6 percent.
Specifically, while the minimum wage has remained stagnant since 1997, Congress has enacted legislation that has reduced estate tax burdens in eight of the past nine years.[6] Of further note, in the bill that recently passed the House, the minimum wage increase would benefit 5.6 million workers, while the estate tax reduction would primarily benefit 8,200 very wealthy estates.[7]
|
TABLE 2 |
|
The Value of the Minimum Wage, 1947-2006 |
|
Year |
Nominal |
Adjusted for Inflation
(using CPI-rs) |
As a share of average private nonsupervisory wage |
|
1947 |
$ 0.40 |
3.05 |
35% |
|
1948 |
0.40 |
2.82 |
33% |
|
1949 |
0.40 |
2.86 |
31% |
|
1950 |
0.75 |
5.29 |
56% |
|
1951 |
0.75 |
4.90 |
52% |
|
1952 |
0.75 |
4.82 |
49% |
|
1953 |
0.75 |
4.77 |
47% |
|
1954 |
0.75 |
4.74 |
45% |
|
1955 |
0.75 |
4.75 |
44% |
|
1956* |
0.96 |
6.00 |
53% |
|
1957 |
1.00 |
6.05 |
53% |
|
1958 |
1.00 |
5.88 |
51% |
|
1959 |
1.00 |
5.84 |
50% |
|
1960 |
1.00 |
5.74 |
48% |
|
1961* |
1.05 |
5.97 |
49% |
|
1962 |
1.15 |
6.47 |
52% |
|
1963* |
1.18 |
6.56 |
52% |
|
1964 |
1.25 |
6.85 |
49% |
|
1965 |
1.25 |
6.75 |
48% |
|
1966 |
1.25 |
6.56 |
46% |
|
1967* |
1.39 |
7.08 |
49% |
|
1968* |
1.58 |
7.73 |
52% |
|
1969 |
1.60 |
7.50 |
50% |
|
1970 |
1.60 |
7.16 |
47% |
|
1971 |
1.60 |
6.86 |
44% |
|
1972 |
1.60 |
6.65 |
41% |
|
1973 |
1.60 |
6.26 |
39% |
|
1974* |
1.87 |
6.66 |
42% |
|
1975 |
2.10 |
6.90 |
44% |
|
1976 |
2.30 |
7.15 |
45% |
|
1977 |
2.30 |
6.72 |
42% |
|
1978 |
2.65 |
7.42 |
45% |
|
1979 |
2.90 |
7.43 |
46% |
|
1980 |
3.10 |
7.15 |
45% |
|
1981 |
3.35 |
7.06 |
45% |
|
1982 |
3.35 |
6.67 |
43% |
|
1983 |
3.35 |
6.40 |
41% |
|
1984 |
3.35 |
6.16 |
40% |
|
1985 |
3.35 |
5.96 |
38% |
|
1986 |
3.35 |
5.85 |
38% |
|
1987 |
3.35 |
5.66 |
37% |
|
1988 |
3.35 |
5.46 |
36% |
|
1989 |
3.35 |
5.23 |
34% |
|
1990* |
3.69 |
5.49 |
36% |
|
1991* |
4.14 |
5.95 |
39% |
|
1992 |
4.25 |
5.96 |
39% |
|
1993 |
4.25 |
5.81 |
39% |
|
1994 |
4.25 |
5.69 |
38% |
|
1995 |
4.25 |
5.56 |
37% |
|
1996* |
4.38 |
5.57 |
36% |
|
1997* |
4.88 |
6.09 |
39% |
|
1998 |
5.15 |
6.33 |
40% |
|
1999 |
5.15 |
6.20 |
38% |
|
2000 |
5.15 |
6.00 |
37% |
|
2001 |
5.15 |
5.84 |
35% |
|
2002 |
5.15 |
5.75 |
34% |
|
2003 |
5.15 |
5.62 |
34% |
|
2004 |
5.15 |
5.47 |
33% |
|
2005 |
5.15 |
5.29 |
32% |
|
2006 |
5.15 |
5.15 |
31% |
|
* Minimum wage changed during the course of the year; value reflects weighted average for the year.
Source: Authors calculations based on data from the U.S. Department of Labor. |
End Notes:
|