|
revised September 1, 2006
POVERTY REMAINS HIGHER, AND MEDIAN INCOME FOR NON-ELDERLY IS LOWER, THAN WHEN RECESSION HIT BOTTOM:
Poor Performance Unprecedented for Four-Year Recovery Period
Summary
Overall median household income rose modestly in 2005 — but significantly less than normal for a year during an economic recovery — while the poverty rate remained unchanged, also an unusual development for a recovery year. For the first time on record, poverty was higher in the fourth year of an economic recovery, and median income no better, than when the last recession hit bottom and the recovery began.
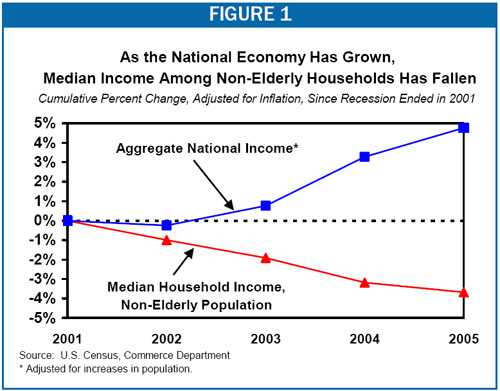
In addition, the 1.1 percent increase in median income that occurred in 2005 was driven by a rise in income among elderly households.[1] Median income for non-elderly households (those headed by someone under 65) fell again in 2005, declining by $275, or 0.5 percent. Median income for non-elderly households declined for the fifth consecutive year and was $2,000 (or 3.7 percent) lower in 2005 than in the recession year of 2001.
Furthermore, the poverty rate, at 12.6 percent, remained well above its 11.7 percent rate in 2001, while overall median household income was $243 lower in 2005 than in 2001 (not a statistically significant difference).
In a related development, the median earnings of both male and female full-time workers declined in 2005. Median earnings for men working full time throughout the year fell for the second straight year, dropping by $774, or 1.8 percent, after adjusting for inflation. The median earnings of full-time year-round female workers fell for the third straight year, declining by $427, or 1.3 percent.
Number of Uninsured Sets Record
Health insurance also deteriorated. The number of uninsured people climbed by 1.3 million in 2005 to 46.6 million, a record high. The percentage of people without insurance rose from 15.6 percent of the population to 15.9 percent. Both figures were substantially above the figures for the 2001 recession year, when 41.2 million people — 14.6 percent of Americans — were uninsured.
Even the number of children who are uninsured rose, increasing for the first time since 1998, and climbing by 360,000 to 8.3 million. Some 11.2 percent of children were uninsured in 2005, up from 10.8 percent in 2004.
Trend Toward Deep Poverty
Census data also show a trend of deepening poverty among those who are poor. The amount by which the average poor person fell below the poverty line in 2005 — $3,236 — was the highest on record. So was the share of the poor (43 percent) who fell below half of the poverty line.[2]
Results Disappointing for this Stage of an Economic Recovery
“Four years into an economic recovery, the country has yet to make progress in reducing poverty, raising the typical family’s income, or stemming the rise in the ranks of the uninsured, compared to where we were in the last recession,” Center executive director Robert Greenstein said.
|
Table 1:
Change in Poverty Rate During First Four Years of Economic Recoveries |
|
Four Year Period: |
Poverty Rate At End of Recession |
Poverty Rate Four Years Later |
Percentage Point Change |
|
1961-1965 |
21.9% |
17.3% |
-4.6% |
|
1970-1974 |
12.6% |
11.2% |
-1.4% |
|
1975-1979 |
12.3% |
11.7% |
-0.6% |
|
1982-1986 |
15.0% |
13.6% |
-1.4% |
|
1991-1995 |
14.2% |
13.7% |
-0.4% |
|
|
|
|
|
|
2001-2005 |
11.7% |
12.6% |
+0.9% |
“It is unprecedented in recoveries of the last 40 years,” he noted, “for poverty to be higher, and the typical working-age household’s income lower, four years into a recovery than when the previous recession hit bottom.”
Considered by itself, Greenstein said, the performance in 2005 was disappointing. From the 1960s until the current recovery period, the poverty rate has declined by an average of 0.5 percentage points during years of an economic recovery, he observed. Yet it failed to drop in 2005. Similarly, the 1.1 percent rise in overall median income was significantly below the 1.8 percent average increase for a recovery year. Greenstein added that when the findings for 2005 are considered in conjunction with the results for the previous years, the result is the worst performance for a period of economic recovery since the Census Bureau began collecting income and poverty data.
“These disappointing figures on median income and poverty are the latest evidence that the economic growth of the past few years has had an unusually limited reach,” he said. “Many middle- and low-income families are not sharing in the gains.”
In related findings that underscore the unevenness of the current economic recovery, data recently issued by the Commerce Department show that a smaller share of the gains from the current economic recovery are going to workers’ wages and salaries than in all but one previous post-World War II recovery period, and a larger share are going to corporate profits than in any other recovery since World War II.
|
Table 2:
Change in Median Income During First Four Years of Economic Recoveries |
|
Four Year
Period: |
Dollar Change by
Fourth Year of Recovery
(In 2005 Dollars) |
Percentage
Change |
|
1970-1974 |
+$748 |
+ 2.0% |
|
1975-1979 |
+$3,279 |
+ 8.7% |
|
1982-1986 |
+$3,244 |
+ 8.3% |
|
1991-1995 |
+$1,238 |
+ 2.9% |
|
|
|
|
|
2001-2005 |
- $243 |
-0.5% |
Hurricanes Do Not Appear to Have Had Much Effect on the New Data
It also may be noted that last year’s hurricanes do not appear to have had much of an effect on the new poverty, median income, and health insurance figures. The hurricanes did not occur until late August and September. The figures on the number and percentage of people who were uninsured, however, apply to people who were uninsured for all 12 months of the year, including the months before the hurricanes hit. In addition, hurricane-related income losses among those who already were poor or below the median national income before the hurricanes hit do not make the poverty rate higher or median income lower. Finally, a number of the people who were most severely affected by the hurricanes apparently are not counted in the new Census data because they evacuated to new trailer camps or shelters and the Census Bureau survey relies largely on older addresses. (See box on page 7.)
Additional Analysis and Detail
This short analysis contains five observations about the new Census data.
1. While overall median income rose in 2005, the typical non-elderly household saw its income fall in 2005 and now has income $2,000 below its level during the recession itself. The typical (or median) household had income of $46,326 in 2005, slightly (1.1 percent) higher than median household income in 2004, after adjusting for inflation. But real median income in 2005 still had not risen above its level in 2001, the year the last recession hit bottom and the recovery began.
And while overall median income grew in 2005, median income fell for the typical non-elderly household by $275 in 2005 and now stands $2,000 below its level in 2001 when the recession ended.
Median income growth during the current recovery compares unfavorably to what has transpired in previous recoveries. In the previous recoveries for which data are available, four years of economic growth has consistently translated into income gains for the typical family. In these recoveries, overall real median income in the fourth year of the recovery averaged 5.5 percent higher than when the recovery began.[3] (See Table 1.)
|
Paulson and Greenspan Warn That Growth Is Not Being Broadly Shared
“[A]mid this country's strong economic expansion, many Americans simply aren't feeling the benefits. Many aren't seeing significant increases in their take-home pay.”
-Treasury Secretary Henry Paulson,
Speech at Columbia University, August 1, 2006 www.ustreas.gov/press/releases/hp41.htm
“[There is a] really serious problem here, as I’ve mentioned many times before this [House] committee, in the consequent concentration of income that is rising.”
- Alan Greenspan
Testimony before the House Financial Services Committee, July 20, 2005.
|
2. At 12.6 percent, the poverty rate in 2005 was statistically unchanged from the poverty rate in 2004. So was the number of Americans living in poverty: 36.95 million Americans were poor in 2005, not a significant change from the 37.0 million who were poor in 2004.
Poverty was higher in 2005 than in the recession year of 2001, when 32.9 million people were poor and the poverty rate stood at 11.7 percent. In the other business cycles of the last 45 years, poverty has always been lower four years into a recovery than in the last recession year. (See Table 3 on page 6.)
3. The share of the poor living in deep poverty remained at a record level in 2005. The proportion of poor people who experienced severe poverty — that is, whose cash incomes fell below half of the poverty line — remained unchanged at its highest level on record, with data going back to 1975. (Half of the poverty line in 2005 was $7,788 for a family of three in 2005; for a family of four, it was $9,985.) Some 43.1 percent of those who were poor in 2005 lived below half of the poverty line.
What analysts call the per-person “poverty gap” — the average amount by which someone who was poor fell below the poverty line — also remained unchanged at its highest level on record. People who were poor fell an average of $3,236 below the poverty line last year.[4] Poor families fell an average of $8,125 below the poverty line in 2005.
|
How Poor is “Poor”?
In the poverty data the Census Bureau released today, Americans are considered poor if their annual incomes in 2005 were below $15,577 for a three-person family, equivalent to $1,298 a month. For a family of four, the poverty line was $19,971 a year, or $1,664 a month.
These amounts are quite modest by any standard. For example, the typical rent paid by U.S. renters in 2005 was $694 a month, or $8,328 on an annualized basis.*
* American Housing Survey: 2005, Table 4-13, www.census.gov/prod/2006pubs/h150-05.pdf |
4. The percentage of Americans without health insurance rose again in 2005. The new Census data show that 46.6 million people were uninsured in 2005, up from 45.3 million in 2004. Some 15.9 percent of Americans were uninsured in 2005, a statistically significant increase from the 15.6 percent who were uninsured in 2004 and the 14.6 percent who lacked insurance in 2001. Some 5.4 million more Americans were uninsured in 2005 than in 2001.
The decline in coverage since 2001 is due primarily to erosion in employer-based insurance. Although the current economic recovery has contributed to unusually robust growth in corporate profits, the percentage of people with employer-sponsored health insurance was significantly lower in 2005 — 59.5 percent — than in 2001, when it stood at 62.6 percent. The main factor propping up health insurance coverage in recent years has been growth in coverage for low-income families and individuals through the nation’s basic public health insurance programs for people with limited means, Medicaid and the State Children’s Health Insurance Program (SCHIP). That has kept the number of uninsured Americans from rising to substantially higher levels.
Of particular note, although health insurance has been eroding for a number of years among adults, coverage for children had been improving through 2004. In 2005, the number of uninsured children rose by 360,000 to 8.3 million, and the percentage of children who are uninsured rose for the first time since 1998. In previous years, declines in employer-based coverage for children were more than outweighed by increases in the number of children covered through Medicaid and SCHIP. In 2005, that was not the case; not only did employer-based coverage for children again decline significantly, but children’s coverage through Medicaid and SCHIP eroded slightly as well. (It is unclear whether the erosion in Medicaid and SCHIP was statistically significant.)
Larger declines in children’s coverage now loom for 2007. Seventeen states face federal funding shortfalls in the SCHIP program in fiscal year 2007. The Congressional Research Service, the U.S. Department of Health and Human Services, and the Center on Budget and Policy Priorities all project that these shortfalls will total $800 million or more in 2007. This amount is equal to the cost of covering at least 530,000 children through SCHIP. Unless Congress acts in September to close these SCHIP shortfalls for 2007, declines in children’s coverage are likely to accelerate in 2007, and more of the gains made in children's coverage in recent years are likely to be reversed. Congress has had information about the SCHIP shortfalls since early February but so far has failed to act.
5. Income inequality appeared to grow again in 2005, with high-income groups securing the largest gains. Researchers concur that the official Census data are not the best measure of trends in income inequality. The Census data fail to capture a substantial amount of income at the top of the income scale, in part because the Census Bureau records income only up to certain specified levels. For example, earnings above $999,999 are not counted; if an individual has $5 million in earnings, his or her earnings are recorded by Census as $999,999. In addition, the Census data leave out all capital gains income, which flows disproportionately to the wealthiest households.[5]
Even so, the Census data shed some light on income inequality trends. The Census data show that the five percent of households with the highest incomes registered large income gains in 2005, with their average incomes increasing by $8,400, or 3.1 percent, after adjusting for inflation. By contrast, income increased only modestly for the rest of the population. For example, the average income of the middle fifth of the population rose by $405 or 0.9 percent while the average income of the bottom fifth increased by $68 or 0.6 percent.
It bears noting that while the Census Bureau’s overall measure of income inequality, the “Gini coefficient,” was up from 2004 to 2005, the change was not statistically significant. But it may well be that the Census data understate this trend because, as just noted, they do not fully capture the increasing concentration of income at the top of the income scale. For instance, from 2003 to 2004 as well, the Census Bureau’s Gini coefficient rose by a statistically insignificant amount. However, data from economists Thomas Piketty and Emannuel Saez that do capture income changes at the top of the income spectrum and are available through 2004 show that income inequality grew markedly in 2004. The Piketty and Saez data, based largely on Internal Revenue Service data, show that the top one percent of households received 41 percent of the increase in overall U.S. household income that occurred in 2004.[6]
|
Table 3:
Key Changes in Poverty, Income, and Health Insurance |
|
|
2004 to 2005 |
2001 to 2005 |
|
Poverty Rate |
-0.1 percentage points |
+0.9 percentage points* |
|
Number Poor |
-0.1 million |
+4.0 million* |
|
Read Median Income |
+$509* |
-$243 |
|
Real Median income of non-elderly |
-$275* |
-$2,000* |
|
Percent without Health Insurance |
+0.3 percentage points* |
+1.3 percentage points* |
|
Number without Health Insurance |
-1.3 million* |
-5.4 million* |
|
* denotes a statistically significant change |
Comparable information on income growth at the top of the income scale is not yet available for 2005, but other data are available that suggest income disparities may be widening. Commerce Department data available through the first quarter of 2006 show that corporate profits have grown more rapidly in the current recovery than in any previous post-World War II recovery, while total wages and salaries earned by all workers have grown more slowly than in all but one previous post-World War II recovery.[7] Since individuals at the top of the income spectrum hold a highly disproportionate share of corporate stock,[8] the Commerce data suggest that the large disparities in income between those at the top and other Americans are continuing to grow. Indeed, the Commerce Department data show no abatement in these trends in 2005 or the first part of 2006.
|
Last Year’s Hurricanes Do Not Appear to Have Substantially Affected the 2005 Poverty and Income Figures
While last year’s hurricanes had harsh effects on many hurricane victims, they do not appear to have substantially affected the national figures on poverty, median income, and the lack of health insurance for 2005. This is true for several reasons.
First, the timing of the hurricanes limited their effect on the annual income, poverty, and health insurance statistics for 2005. Hurricane Katrina occurred at the end of August, and Hurricane Rita followed in late September. Affected families generally had already worked for at least eight months of 2005 and earned the majority of the year’s income before the hurricanes struck. In addition, the Census data issued today on the number and percentage of Americans without health insurance apply to people who were uninsured throughout the entire year.
Second, some of the people who were affected most severely were not counted in the Census poverty and income data for 2005 due to factors related to their evacuation. The Census Bureau surveys did not attempt the near-impossible task of keeping up to date with the current locations and addresses of evacuees. The surveys are particularly likely to have missed certain of their dwelling places such as newly-created FEMA trailer camps or shelters. In some of the Census data released today, hurricane victims who were living in emergency shelters at the time the Census surveys were conducted are omitted.*
Third, many of the families that lost income due to the hurricanes already were too poor for the losses to affect their poverty status or the statistics on national median income. One in six individuals living in FEMA-declared disaster counties was considered poor even before the hurricanes struck in 2005. Income losses among these families would not have altered their poverty status, since they were poor already. In addition, the majority of households in these areas had incomes below the national median even before the hurricanes struck. In 2004, the median income in each of the four Gulf Coast states most heavily affected by the hurricanes (Alabama, Mississippi, Louisiana, and Texas) was below the national median income. Income losses borne by households that already fell below the national median income do not affect the national median figure.
* One set of survey data released today, the data from the Current Population Survey, rely in large part on a list of addresses that was representative of America in the year 2000. These survey data are unlikely to capture accurately people who moved away after the 2005 hurricanes, particularly if they evacuated to one of the many newly-created shelters or trailer camps, which would not appear on address lists for 2000. A second set of survey data released today — data from the American Community Survey, the chief source of local income and poverty data — exclude all shelters as well as all new addresses, such as new trailer camps, that were established after July 2005. |
End Notes:
[1] This reflects the change in median income after adjusting for inflation. All income figures in this analysis are provided in 2005 inflation-adjusted dollars.
[2] The figures for 2005 both for the amount by which the average poor person fell below the poverty line and for the percentage of the poor whose incomes are below half the poverty line were slightly higher than those reported in 2003 and 2004, but the difference is not statistically significant. The figures for these three years were higher than the figures for prior years, with data going back to 1975.
[3] Data on household median income are available back to 1967; data on poverty are available back to 1959. We compare the four-year periods following the recessions that ended in 1961 (for which only poverty data are available), 1970, 1975, 1982, and 1991. We omit the period following the recession that ended in 1980 because another recession began in 1981.
[4] The $3,236 figure is the average amount by which individuals in poor primary families (families that include the head of household) and individuals not living in a family fell below the poverty line in 2005. When a small additional group — people in unrelated families — also is included, the average amount by which people who were poor fell below the poverty line was $3,284. This level also remained at a record high.
[5] In addition to leaving out these income sources for the wealthiest Americans, the basic Census data also miss some sources of income for lower-income households. The Census do not capture all cash welfare payments for the poorest Americans, although the number of dollars missed has declined in recent years as the amount of cash welfare assistance has shrunk. The Census data also do not count as income such items as Earned Income Tax Credit payments and food stamp benefits.
[6] Aviva Aron-Dine and Isaac Shapiro, “New Data Show Extraordinary Jump in Income Concentration in 2004,” Center on Budget and Policy Priorities, revised July 25, 2006.
[7] Some have argued that wages and salaries have grown slowly in the current recovery only because the cost of other forms of employee compensation, such as employer-provided health care benefits, have grown rapidly. The Commerce Department data show, however, that while total employee compensation has grown somewhat more rapidly than wages and salaries, total compensation itself has grown as or more slowly than in any previous recovery since World War II.
[8] The top 1 percent of Americans by wealth owned 51 percent of publicly traded stock in 2004. See Arthur Kennickell, “Currents and Undercurrents: Changes in the Distribution of Wealth, 1989–2004” (revised August 2006), Table 11a, www.federalreserve.gov/pubs/oss/oss2/papers/concentration.2004.5.pdf. |