
Why the surplus has disappeared
| This
series of tables and short papers reflect the latest budget estimates,
issued by the Congressional Budget Office on
|
|
|
| Related reports: |
|
|
|
2001-2002 avg. |
2010 |
2002-2011 total |
|||
|
|
Reduction in surplus due to various factors, in billions of dollars |
Proportion of the deterioration that each factor accounts for |
Reduction in surplus due to various factors, in billions of dollars |
Proportion of the deterioration that each factor accounts for |
Reduction in surplus due to various factors, in billions of dollars |
Proportion of the deterioration that each factor accounts for |
|
|
Surpluses projected in January 2001 |
297 |
|
796 |
|
5,610 |
|
|
|
Changes in the economic forecast |
-73 |
24% |
-46 |
7% |
-793 |
15% |
|
|
Changes due to “technical” reestimates |
-121 |
39% |
-166 |
27% |
-1,528 |
29% |
|
|
Legislation enacted to date: |
|
|
|
|
|
|
|
|
|
Last year’s tax cut |
-55 |
18% |
-260 |
42% |
-1,648 |
31% |
|
|
“Stimulus” bill |
-26 |
8% |
+5 |
-1% |
-100 |
2% |
|
|
Defense, homeland, and international |
-24 |
8% |
-104 |
17% |
-830 |
16% |
|
|
Domestic approps (except homeland) |
-3 |
1% |
-28 |
4% |
-193 |
4% |
|
|
Farm bill |
-4 |
1% |
-13 |
2% |
-108 |
2% |
|
|
all other legislation |
-6 |
2% |
-8 |
1% |
-75 |
1% |
|
Total reduction in the surplus |
-312 |
100% |
-619 |
100% |
-5,274 |
100% |
|
|
Surpluses or deficits currently projected |
-15 |
|
+177 |
|
+336 |
|
|
| Source: CBPP calculations from CBO data. Figures may not add due to rounding. All figures include debt service (interest) costs caused by the policy or reestimate in question. This is the same approach taken by OMB in dividing the deterioration of the surplus among its various causes. | |||||||
What Part of the Shrinkage Was Under Congress’s Direct Control?
Combined, the first three items listed in Table 2 — last year’s tax cut, the stimulus bill, and increases for defense, international affairs, and homeland security — account for 87 percent of the total deterioration in the ten-year surplus for which Congress and the Administration are responsible. They account for a similar percentage in both the short run and the long run, because as the stimulus bill phases out, last year’s tax cut phases in. In each of these three areas, the President is calling for additional costs: larger permanent tax cuts, more “stimulus” tax cuts, and larger increases in defense spending.
|
|
2001-2002 avg. |
2010 |
2002-2011 total |
|||
|
|
Reduction in surplus due to various factors, in billions of dollars |
Proportion of the deterioration that each factor accounts for |
Reduction in surplus due to various factors, in billions of dollars |
Proportion of the deterioration that each factor accounts for |
Reduction in surplus due to various factors, in billions of dollars |
Proportion of the deterioration that each factor accounts for |
|
Last year’s tax cut |
55 |
47% |
260 |
64% |
1,648 |
56% |
|
“Stimulus” bill |
26 |
22% |
-5 |
-1% |
100 |
3% |
|
Defense, homeland, and international |
24 |
20% |
104 |
26% |
830 |
28% |
|
Domestic approps (except homeland) |
3 |
2% |
28 |
7% |
193 |
7% |
|
Farm bill |
4 |
3% |
13 |
3% |
108 |
4% |
|
all other tax and spending legislation |
6 |
5% |
8 |
2% |
75 |
3% |
|
Total cost of legislation to date |
117 |
100% |
407 |
100% |
2,953 |
100% |
Revenue Losses, Not a Spending “Explosion”
Table 3 shows the combined effects of legislation and of economic and technical reestimates from January 2001 through August 2002. As with all tables, we attribute the cost of debt service (payments of increased interest on the debt) to the revenue loss or programmatic spending increase that caused the surplus to shrink.
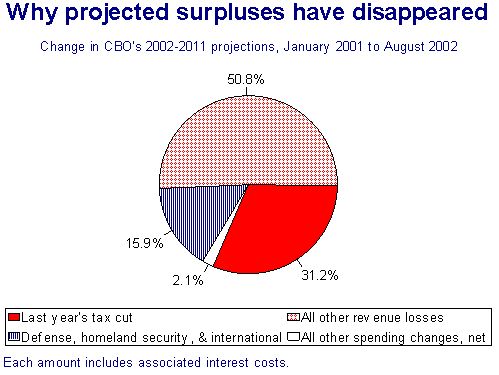
Increased costs of defense, homeland security, and international programs account for 16 percent of the deterioration. Domestic spending increases outside of homeland security account for two percent of the deterioration. (Projections of domestic spending have changed since January 2001 both because of legislative increases and because of reestimates of the costs of entitlement programs; some of those reestimates have been downward.)
|
|
2001-2002 avg. |
2010 |
2002-2011 total |
|
Reduced revenues |
85% |
82% |
82% |
|
Increased costs of defense, homeland security, and international |
8% |
17% |
16% |
|
Increased cost of all other programs, net |
7% |
1% |
2% |
|
Total reduction in the surplus |
100% |
100% |
100% |
| Source: CBPP calculations from CBO data. Figures include the extra interest payments due to each of the causes listed. Figures may not add due to rounding. | |||
The pie chart below depicts the same ten-year data in graph form, dividing the revenue losses (and associated debt service costs) between last year’s tax cut and all other causes of revenue losses.
WHY PROJECTED SURPLUSES HAVE DISAPPEARED
What has happened to debt and interest on the debt?
In fact, increases in interest costs caused by tax cuts and by downward reestimates of revenue are larger than spending increases for all other reasons combined (i.e., for increased funding for defense, homeland security, international and domestic programs, the farm bill, and the like, plus debt service costs on those pieces of legislation). In other words, the tax cut and revenue shortfalls are responsible for more “spending increases” than all real spending increases combined.
|
|
Projected by CBO in January, 2001 |
Projected by CBO in August, 2002 |
|
Level of publicly held Treasury debt in 2011 |
none* |
$3.2 trillion |
|
Net cost of interest payments, 2002 through 2011 |
$0.6 trillion |
$1.9 trillion |
|
* except for a small amount of Treasury debt that could not be conveniently redeemed, such as series E savings bonds. |
||
CBO vs OMB
Previous tables in this series of analyses have covered the ten-year period 2002-2011 because CBO’s projection of January 2001 extended only through 2011. Subsequent tables cover the period 2003-2012, which is the projected ten-year period CBO covers in its new report. Through 2012, CBO projects a $1 trillion surplus. But 83 percent of that surplus occurs in the last two years, after the tax cut is scheduled to expire.
|
|
In billions of dollars |
|
|
OMB projects higher revenues than CBO under current law |
$638 |
|
|
Interest savings resulting from OMB’s projection of higher revenues |
269 |
|
|
Total effect of OMB’s projection of higher revenues |
907 |
|
|
OMB projects lower spending and interest (net) under current law |
14 |
|
|
Total amount by which OMB is more optimistic than CBO |
921 |
|
| Source: CBPP calculations from CBO data. Figures may not add due to rounding. OMB’s July projections were published before enactment of the supplemental appropriations bill and so did not reflect it; this table adjusts the OMB figures to reflect CBO’s estimate of the cost of that bill, so that OMB’s totals and CBO’s totals project the same policies and differ only because of economic and technical estimating differences. Without this adjustment, OMB would appear to be $1.3 trillion more optimistic than CBO. | ||
WHAT IS MISSING FROM THE PROJECTIONS?
CBO and OMB baseline projections merely reflect current law and therefore understate the likely further deterioration of the budget that is expected to occur as a result of legislation that is highly likely or virtually certain to be enacted.[1]
|
CBO’s projected ten-year surplus under current law, 2003-2012 |
$1.0 trillion |
|
|
CBO’s projected ten-year deficit (-) outside of Social Security |
-1.5 |
|
|
Potential or likely costs not included in CBO’s baseline projections: |
|
|
|
|
Extension of expiring provisions of last year’s tax cut |
-0.6 |
|
|
Adjustments to alternative minimum tax |
at least -0.4 |
|
|
Extension of other expiring tax breaks (primarily “stimulus” bill) |
-0.5 |
|
|
Additional tax cuts in Bush budget |
-0.2 |
|
|
Additional tax cuts to be proposed by the Administration after Labor Day |
-?? |
|
|
Prescription drug benefit and Medicare provider relief |
-?? |
|
|
Additional spending for defense, homeland security, and international programs requested by the Administration |
-0.4 |
|
|
Domestic appropriations cuts requested by the Administration |
+0.3 |
|
|
Additional foreign aid funding (Millennium Fund) the President has pledged |
-0.05 |
|
|
|
|
|
Ten-year deficit (-) if all potential costs are incurred |
-0.8 |
|
|
Ten-year deficit (-) outside Social Security if all potential costs are incurred |
-3.3 |
|
| Source: CBPP calculations from CBO data. Figures may not add due to rounding. Figures include the additional debt service that would be caused by the policies. For example, extending provisions of last year’s tax cut that are scheduled to expire will cost $553 billion in lost revenues according to CBO; with debt service costs, the total reaches $605 billion. | ||
End Note:
[1] When creating baseline projections, CBO and OMB both follow definitions and rules spelled out in the Balanced Budget and Emergency Deficit Control Act. Those rules establish a baseline against which legislation can be measured for purposes of enforcing the “pay-as-you-go” rule and the discretionary caps established in 1990. While such enforcement is officially due to expire September 30, that Act nonetheless provides the only statutory definition of a baseline. CBO and OMB avoid controversy — and conceptual measurement differences with each other — by following those definitions.